Auto-diagnosing Kubernetes alerts with HolmesGPT and CNCF tools (5 minute read)
A two-person SRE team cut Kubernetes alert investigation time from 15 minutes to 2 minutes using HolmesGPT, discovering that namespace-specific runbooks mattered more than model selection.
Deep dive
- STCLab's two-person SRE team supports multiple Amazon EKS clusters with full observability (OpenTelemetry, Mimir, Loki, Tempo, Prometheus) but spent 15-20 minutes manually correlating data for every alert
- HolmesGPT uses the ReAct pattern where the LLM reads an alert, picks a tool, analyzes the result, then decides what to check next—the investigation path adapts based on what it finds rather than following a script
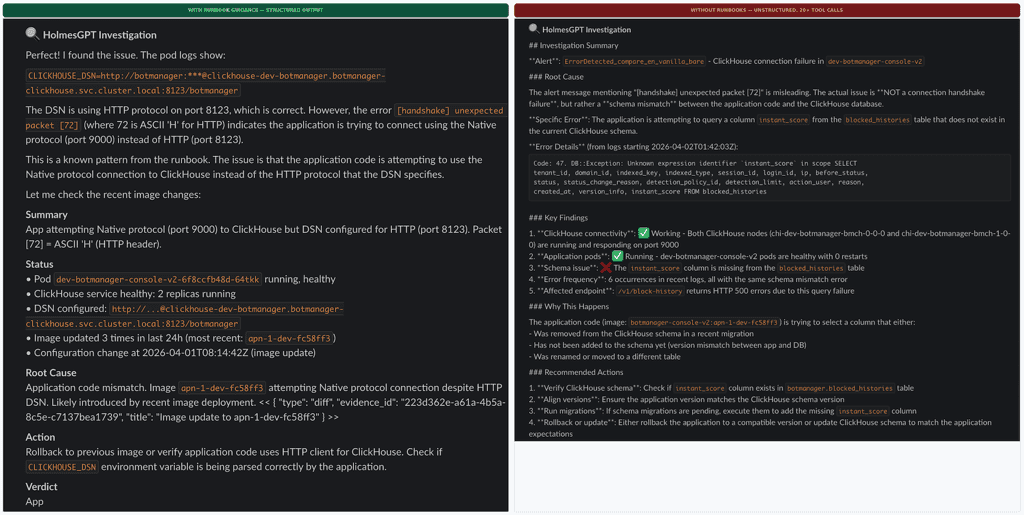
- The team's critical discovery came from controlled testing: the same ClickHouse handshake alert tested with and without runbooks showed the model matched the error pattern in 3-4 tool calls with runbooks versus chasing three wrong hypotheses across 20+ steps without them
- Markdown runbooks include metadata headers specifying namespace scope, available tools, and cautionary notes like which containers lack log collection, allowing Holmes to skip tools that would return nothing
- A custom 200-line Python playbook handles integration gaps: finding the right Slack thread after Robusta posts the initial alert, fingerprinting at workload level to deduplicate pod-level alerts during rollouts, and replicating namespace-to-channel routing
- The team tested seven models across self-hosted and managed hosting: 7B couldn't produce valid tool calls, 9B's thinking mode conflicted with ReAct, 14B on Spot GPUs suffered from evictions and 5-8 minute cold starts during node provisioning
- Managed APIs through VPC endpoints keep cluster data internal but most models failed on HolmesGPT's prompt caching markers—only one model family passed all requirements including Korean output and cross-cluster log correlation
- The team contributed an upstream fix for pod identity authentication (PR #1850) and now runs hybrid deployment with one YAML block to swap between self-hosted staging and managed production
- Workload-level deduplication reduces roughly 40 raw daily alerts to 12 unique investigations, with about 40% resolving automatically for known patterns like OOMKilled and ImagePullBackOff
- Cost runs approximately $0.04 per investigation or $12 monthly total, with the entire pipeline and playbook remaining unchanged regardless of backend model
- The team maintains seven runbooks organized by namespace and alert type, treating the playbook as the stable core and the model as the replaceable component designed for migration
- Future plans include feeding eBPF-level network metrics from Inspektor Gadget (TCP retransmits, connection latency) through Prometheus into the same investigation pipeline
Decoder
- HolmesGPT: CNCF Sandbox project that automates Kubernetes alert investigation using LLMs to dynamically select and execute diagnostic tools
- ReAct pattern: Reasoning and Acting loop where an LLM alternates between thinking about what to check next and executing tools based on previous results
- CNCF Sandbox: Early-stage Cloud Native Computing Foundation projects that show promise but aren't yet mature or widely adopted
- Robusta OSS: Open-source tool that enriches Prometheus alerts with additional context like error logs and Grafana links before posting to Slack
- OpenTelemetry: Vendor-neutral observability framework for collecting metrics, logs, and traces from applications
- Mimir/Loki/Tempo: Grafana Labs projects for long-term storage of Prometheus metrics, logs, and distributed traces respectively
- Runbook: Documented procedures specifying which diagnostic tools are available and which constraints apply in specific namespaces
- KubeAI: CNCF project for running AI workloads on Kubernetes with GPU support
- Inspektor Gadget: CNCF tool using eBPF to collect low-level system and network metrics from Kubernetes clusters
Original article
What a two-person SRE team learned building an AI investigation pipeline. Spoiler: the runbooks mattered more than the model.
Why we built this
At STCLab, our SRE team supports multiple Amazon EKS clusters running high-traffic production workloads. We've got the full observability stack in place: OpenTelemetry feeding into Mimir, Loki, and Tempo. Robusta OSS enriches Prometheus alerts with error logs, Grafana links, and team mentions before dropping them into Slack.
So the data was never the problem. The problem was what happened next. Every alert meant the same drill: check the pod, query Prometheus, dig through Loki, pull traces, try to correlate. Fifteen to twenty minutes, every single time. We wanted that first pass to happen automatically and show up in the same Slack thread.
HolmesGPT: Letting the LLM decide what to investigate
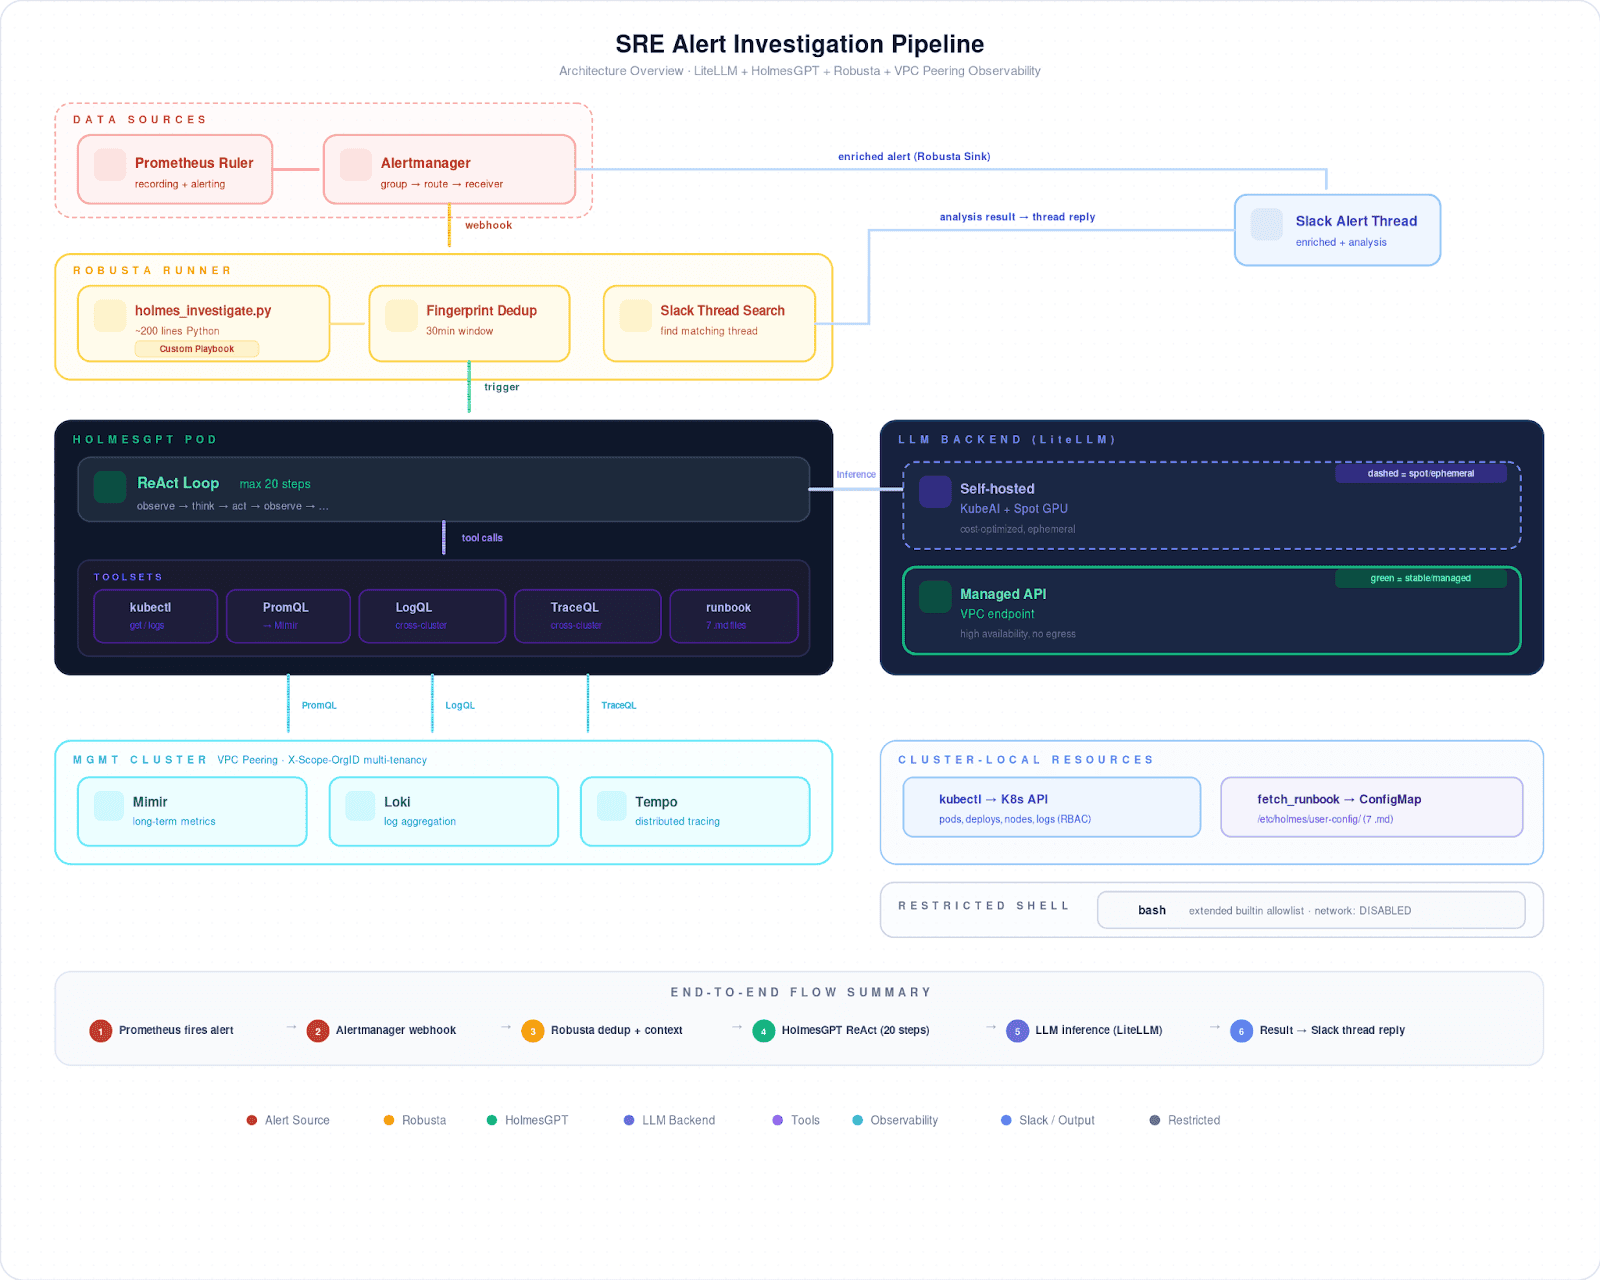
We went with HolmesGPT (CNCF Sandbox) because of how it works: the ReAct pattern. The LLM reads an alert, picks a tool, reads the result, then decides what to check next. If a pod restarts, it might start with the exit code, pull Loki logs across clusters through VPC peering, then look at CPU pressure in Prometheus. The path isn't scripted it depends on what the model actually finds.
That matters in our case, because not every namespace looks the same. Some have the full picture: centralized logs, distributed traces, the works. Multi-tenant workloads often have none of that; for those namespaces, it's kubectl and Prometheus only. We capture these differences in markdown runbooks, each with a metadata header:
## Metascope: namespace=<target> onlytools: kubectl, prometheus, loki, tempocaution: some containers excluded from log collection → use kubectl logs
Holmes calls fetch_runbook early in its investigation. The metadata tells it which tools are available and which ones to skip.
Making it work with Robusta
Our custom playbook is about 200 lines of Python. It covers what HolmesGPT doesn't.
Robusta posts the alert to Slack before Holmes is done investigating, so our playbook has to find the right thread after the fact and post results as a reply. When Prometheus fires one alert per pod during a rollout, the playbook fingerprints at the workload level and suppresses repeats for 30 minutes. And since Robusta routes to different Slack channels by namespace, the playbook replicates that mapping to find where to post.
Runbooks changed everything
We started by focusing on model selection. What actually determined investigation quality was the runbooks.
Without runbooks, the model just guesses. It might check Istio metrics in namespaces that have no sidecars, or query Loki where nothing is being collected. Eventually it loops, burns through its step budget, and comes back with "I need more information."
What fixed this wasn't a better model. It was telling the model what not to do. Once we added exclusion rules to our runbooks ("no Loki, no Tempo, no Istio here; use kubectl and PromQL only"), wasted tool calls dropped from 16 to 2 per investigation.
We ran a controlled comparison to confirm this: the same ClickHouse handshake alert, tested four ways. With runbooks, Holmes matched the known error pattern in 3 to 4 tool calls and used the rest of its budget to verify. Without runbooks, it chased three entirely different hypotheses (proxy scaling, schema mismatch, port misconfiguration) and burned through 20+ steps before reaching a conclusion. Same model, same alert. The runbook didn't hand it the answer. It just narrowed the search space enough that a 12-step budget was plenty.
We now maintain seven runbooks, organized by namespace and alert type. When an investigation comes back wrong, the first question we ask is "does the runbook cover this?" Not "do we need a better model?"
The model journey
We tested seven models across self-hosted and managed hosting.
Self-hosted came first, running on Spot GPUs managed by KubeAI (CNCF). The 7B model couldn't produce valid tool calls. The 9B model's thinking mode clashed with the ReAct loop and returned empty responses. A 14B looked promising, but Spot evictions kept killing our runs, and cold starts took 5 to 8 minutes while Karpenter spun up nodes.
Then we tried managed APIs through VPC endpoints, which keeps cluster data inside our infrastructure. Most models didn't work; several choked on HolmesGPT's prompt caching markers. Only one model family passed everything we needed: Korean output, Slack formatting, runbook retrieval, and cross-cluster log correlation. We also contributed a three-line upstream fix for pod identity authentication (PR #1850, merged).
Today we run a hybrid setup: self-hosted in staging, managed API in production. Switching between them is one YAML block:
modelList:
  primary:
    model: "provider/model-name"   # swap provider and model ID
    api_base: "https://endpoint"   # managed API or self-hosted
    temperature: 0
Cost comes out to about $0.04 per investigation, roughly $12 a month. Pipeline, playbook, runbooks, all unchanged regardless of backend.
What actually mattered
Some numbers. Workload-level deduplication takes around 40 raw daily alerts down to about 12 unique investigations. Engineers read a threaded summary in under two minutes instead of spending 15 to 20 on manual triage. Roughly 40% of investigations resolve on their own: OOMKilled, ImagePullBackOff, and other known patterns where Holmes matches a runbook and the root cause is obvious.
Here's what we'd tell another team starting this.
Runbooks over models. We ran a controlled test where the same model scored 4.6 out of 5 with runbooks and 3.6 without, on the exact same alert. The exclusion rules we wrote into our runbooks moved the needle more than any model swap ever did.
Glue code is real work. That 200-line playbook handles timing, dedup, routing, and thread matching. HolmesGPT handles reasoning. You need both.
Design for model migration. We've swapped backends three times now without touching the pipeline. The playbook is the stable core. The model is the part you replace.
What's next: we're looking at Inspektor Gadget (CNCF) to feed eBPF-level network metrics, TCP retransmits, connection latency, into the same pipeline through Prometheus. The architecture stays the same. Holmes just gets better data to work with.