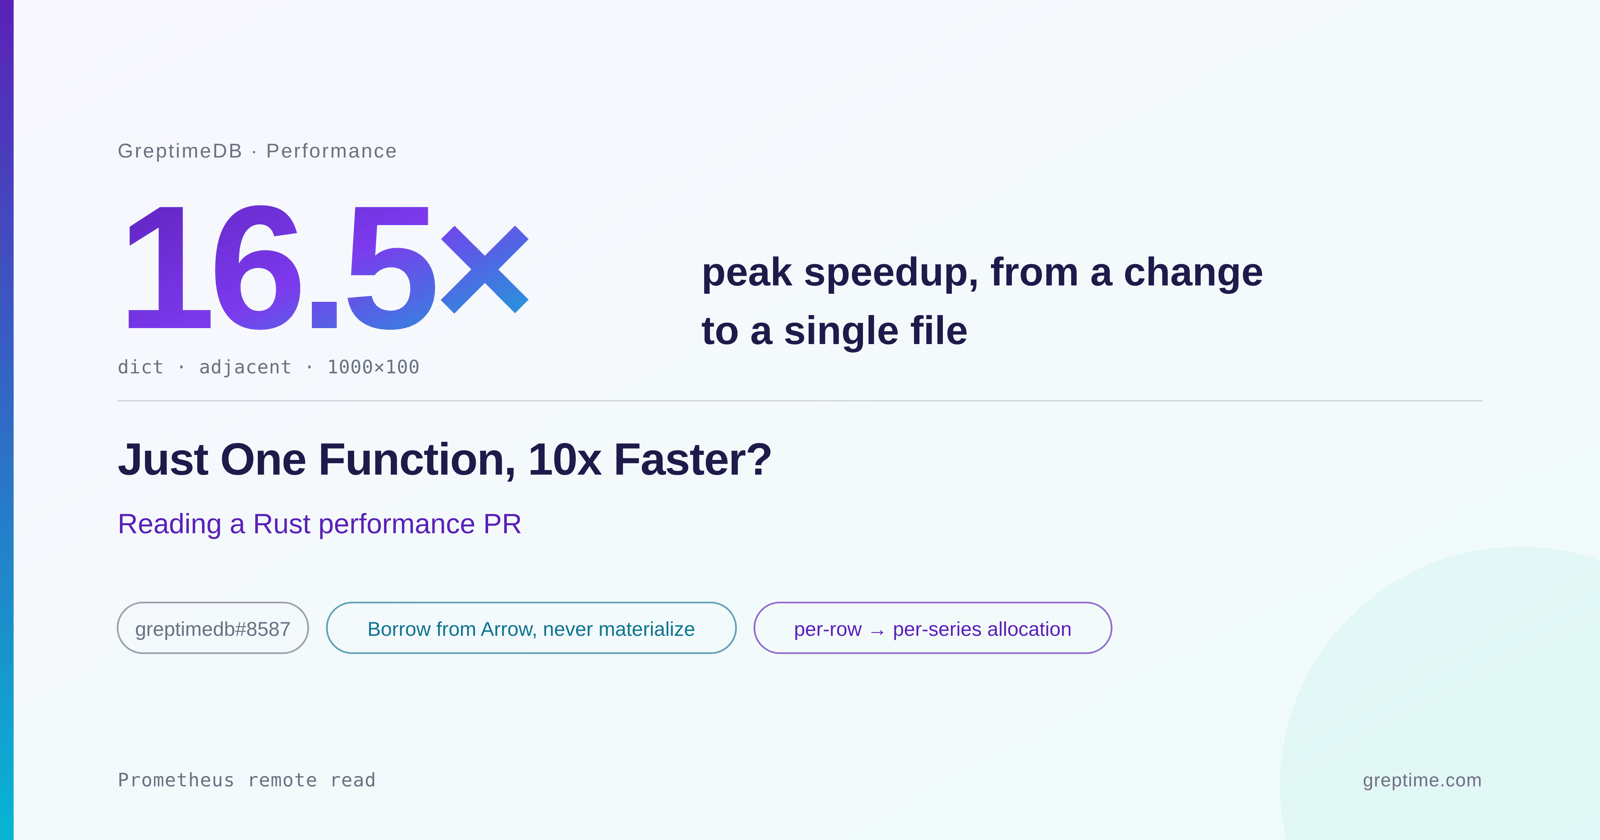
Just One Function, 10x Faster? Reading a Rust Performance PR
GreptimeDB accelerated Prometheus remote-read conversion by up to 16x by borrowing strings directly from Arrow arrays instead of performing redundant heap allocations.
Deep dive
- Benchmark Reproduction: The author created a
criterionbenchmark to pin down throughput at 2M rows/sec. - The Bottleneck: The previous
collect_timeseries_idsfunction built an owned label vector for every single row, causing excessive heap allocations. - Dictionary Issue: Dictionary-encoded columns were accidentally expanded row-by-row into strings by
iter_column_as_string, making them slower than plain strings. - Borrowing Strategy: The new
LabelValuesenum allows borrowing fromStringArray,LargeStringArray, and dictionary-encoded columns without copying data. - Fast-Path Optimization: A caching mechanism checks if the current row matches the series index of the previous row, skipping the hash-map lookup entirely.
- Correctness: The fix preserves NULL semantics and ensures the final output is sorted to maintain protocol compatibility.
- Performance Gains: Throughput increased from 1.8M–3.2M to 9.6M–34.8M rows/second.
Decoder
- Prometheus remote-read: An API that allows Prometheus to fetch time-series data from long-term storage backends.
- RecordBatch: A columnar data structure used by Apache Arrow to group batches of rows.
Original article
GreptimeDB can serve as a remote read backend for Prometheus. The last step on that path converts the columnar RecordBatch produced by the query engine into the row-oriented TimeSeries of the Prometheus protocol: group rows by their label set, and collect the samples of each series together.
This function (recordbatches_to_timeseries) had sat untouched in the repo for a long time, until our committer @lyang24 opened PR #8587 and rewrote it. The PR changes exactly one file, src/servers/src/prom_store.rs.
Note: GreptimeDB v1.2.0-beta.1 is out and ships this optimization.
I only read this code because the PR showed up. The description includes a diagram the author drew, and its lower right corner carries a CPU profile: with 300k series and 4 concurrent reads, the RecordBatch → TimeSeries step took 36.2% of CPU, and dictionary materialization alone took 8.9%. A function that neither decompresses nor touches disk, that only moves data around in memory, burning a third of the CPU: that number is not normal.
The profile came from the author, and I did not reproduce that environment. To find out how much the change itself actually gained I needed a benchmark I could run, and the bench code did not land with the PR. So I rewrote one against the public entry point and ran it on both sides of the change. The numbers before the change were not good either: 10K rows took 3.7 ms per conversion, 100K rows took 44 ms, under 3M rows per second. After the change, the best cases run more than 10x faster.
This post is my walkthrough of the PR, taking the same route as 5x Slower than Go? Optimizing Rust Protobuf Decoding Performance: write a benchmark to reproduce first, then read the code section by section.
Step 1: Reproduce the Case
First, pin down the state before the change. The bench drives the public entry point recordbatches_to_timeseries directly, through criterion:
fn bench_prom_read_convert(c: &mut Criterion) {
    let mut group = c.benchmark_group("prom_read_convert");
    group.measurement_time(Duration::from_secs(5));

    // (series count, samples per series)
    let sizes = [(10, 1000), (100, 100), (1000, 100), (5000, 20)];

    for encoding in [Encoding::Dictionary, Encoding::Utf8] {
        for ordering in [Ordering::Adjacent, Ordering::Interleaved] {
            for (series, samples) in sizes {
                let rows = series * samples;
                let (schema, batch) = build_recordbatch(series, samples, ordering, encoding);

                group.throughput(Throughput::Elements(rows as u64));
                group.bench_with_input(
                    BenchmarkId::new(
                        format!("{}/{}", encoding.name(), ordering.name()),
                        format!("{series}x{samples}"),
                    ),
                    &(schema, batch),
                    |b, (schema, batch)| {
                        b.iter(|| {
                            let batches =
                                RecordBatches::try_new(schema.clone(), vec![batch.clone()])
                                    .unwrap();
                            black_box(
                                recordbatches_to_timeseries("bench_metric", batches).unwrap(),
                            )
                        });
                    },
                );
            }
        }
    }

    group.finish();
}
The three dimensions the loops iterate over come from real scenarios. For encoding, Utf8 is a plain string column, and Dictionary<UInt32, Utf8> is the label layout the PromQL read path actually returns. For ordering, adjacent means the samples of one series are contiguous in the result (query output is generally sorted by primary key, which produces this shape), and interleaved means the series alternate row by row. For size, it is series count times samples per series; a typical remote read request has few series with many points each. The labels are modeled on a real metric table: host differs for every series, while datacenter, env and job have only a handful of values.
The results are as follows:
prom_read_convert/utf8/adjacent/100x100
                        time:   [3.6421 ms 3.6581 ms 3.6759 ms]
                        thrpt:  [2.7204 Melem/s 2.7337 Melem/s 2.7457 Melem/s]

prom_read_convert/dict/adjacent/100x100
                        time:   [4.9186 ms 4.9330 ms 4.9482 ms]
                        thrpt:  [2.0209 Melem/s 2.0272 Melem/s 2.0331 Melem/s]

prom_read_convert/dict/adjacent/1000x100
                        time:   [55.435 ms 55.574 ms 55.719 ms]
                        thrpt:  [1.7947 Melem/s 1.7994 Melem/s 1.8039 Melem/s]
The thrpt line is the throughput reported by criterion. One element here is one row, so this is around 2M rows per second.
Something else looks off besides the absolute speed: the dictionary-encoded group is 35% slower than the plain string group (2.0272M vs 2.7337M). Dictionary encoding exists to save memory and copies, so why is it slower? We will come back to this.
Step 2: What the Function Does for Every Row
Open the old code and the first step is collect_timeseries_ids. The function had carried a self-deprecating comment from the start; whoever wrote it clearly knew it was bad and just had no better place to start:
/// Collect each row's timeseries id
/// This processing is ugly, hope <https://github.com/GreptimeTeam/greptimedb/issues/336> making some progress in future.
fn collect_timeseries_ids(table_name: &str, recordbatch: &RecordBatch) -> Vec<TimeSeriesId> {
It builds an owned label vector for every row. And columns here is every column materialized in full, up front.
The code reads clearly enough. The problem is the magnitude of the cost. Let R be the row count, S the series count, and L the average number of labels. One pass costs: R·L calls to to_string() for the full-column materialization; one Vec<Label> per row, so R heap allocations; one clone each for every label name and value, another R·L string copies; and one BTreeMap lookup per row, each on the order of log(S) comparisons. The comparison short-circuits at the first differing label, but in the worst case it has to walk the whole vector.
So all the cost scales with the row count, while the actual information in the result is only S series. A typical remote read request pulls tens or hundreds of points per series, making R tens of times S, and most of the allocation and copying goes into rebuilding the same label set over and over.
Step 3: Why Dictionary Columns Were Slower
Back to the question from Step 1. The label columns returned by the PromQL read path are Dictionary<UInt32, Utf8>. Across 1000 rows, host might have only 3 distinct values, so the dictionary stores 3 strings and each row stores a u32 index.
But iter_column_as_string does not recognize dictionary columns. It falls back to the generic path and calls to_string() row by row. The 3 strings become 1000, every allocation upstream avoided is made again here, plus one extra dictionary lookup per row. That is where the slowdown against plain string columns comes from, and it is the 8.9% listed separately in the profile at the top of this post.
At this point the direction of the PR is clear: grouping only needs to read a row's value and compare it, so do not copy; borrow straight from the Arrow array. Allocate only once you have confirmed this is a series you have never seen.
Step 4: Borrow from Arrow Arrays Instead of Materializing
Copies come first. The PR wraps label columns in a borrowed view:
enum LabelValues<'a> {
    Utf8(&'a StringArray),
    LargeUtf8(&'a LargeStringArray),
    Utf8View(&'a StringViewArray),
    DictionaryUtf8 {
        dictionary: &'a DictionaryArray<UInt32Type>,
        values: &'a StringArray,
    },
    Other(Vec<Option<String>>),
}
The four Arrow layouts a label column can actually have get one branch each. value(row) returns a &str borrowed from the array, with no copy and no allocation. Since LabelValues<'a> holds nothing but &'a references, the Rust compiler enforces that these &str cannot outlive the RecordBatch, rather than relying on convention.
The dictionary branch is what Step 3 was asking for: dictionary.key(row) gets the index, and values.value(key) borrows one of the few strings in the dictionary. That is still 1000 index lookups for 1000 rows, but they all reuse the same 3 strings and never expand into 1000 owned Strings.
Step 5: Grouping Without a BTreeMap
With copies handled, what remains is one tree lookup and one Vec allocation per row. The new loop looks like this. LabelColumn below is a column name plus the LabelValues from above.
The outer Some(index) if matches_timeseries(...) targets the shape of the data. Mito's SeqScan sorts by primary key and time within each PartitionRange, so the samples of one series are mostly contiguous. Comparing the current row against the series the previous row landed on is enough to reuse it on a hit, with no hash to compute. This only optimizes a common local ordering. It can break across partitions and across ranges, and correctness does not depend on it.
When the fast path breaks, and the first time each series appears, the hash path takes over. The map value is a candidate list rather than a single index, because hashes collide and a candidate still has to pass a full label comparison. Merging two different series for the sake of speed is a mistake this function cannot make.
Step 6: Do Not Change the Observable Behavior
This is protocol-layer code, so a change should touch externally observable behavior as little as possible and avoid leaving compatibility problems downstream. Three parts of the PR are there for exactly that.
The old implementation used a BTreeMap, so output was label-ordered for free. The new one uses a Vec, ordered by first appearance. So a sort was added at the end. One S·log(S) sort is negligible against what was saved.
NULL semantics have to match too. Since NULL labels are skipped, one series' label sequence can be a prefix of another's, so the comparison has to be careful.
Results
Throughput went from 1.8M–3.2M rows per second to 9.6M–34.8M, and no case got slower.
The adjacent groups are much faster, 10–16x, and that comes from the fast path in Step 5: only the first row of each series needs a hash, roughly S/R of them. The interleaved groups compute a hash, look it up and compare on every row, and still land at 4–5x. Real query results mostly have the adjacent shape.
Dictionary columns improved the most because they had the most extra cost to begin with.
Summary
The data structures did change: a BTreeMap became a Vec plus a hash index, a previous-series fast path was added, and the ordered output became one sort at the end. But most of the gain does not come from any of that. It comes from two plain things: do not copy what you can borrow, and do not repeat per row what you can do once.
The dictionary-column trap from Step 3 is the part worth remembering. Upstream deliberately kept the dictionary encoding to save memory, and one iter_column_as_string downstream expanded it anyway, into something slower than not using a dictionary at all. This is hard to find without a benchmark.
Fresh dev news, AI-digested daily. Never miss a trend at devoured.fyi