Devoured - August 17, 2026
Stripe is reportedly acquiring AI gateway startup OpenRouter for over $7 billion, while OpenAI has delayed its Astra model amid rising security concerns and infrastructure constraints. Meanwhile, developers are shifting focus from autonomous coding loops toward structured agentic engineering, emphasizing human-in-the-loop verification and improved architectural design to manage the risks of AI-generated software.

Stripe Will Reportedly Acquire OpenRouter for Over $7B
Stripe is reportedly acquiring AI model-routing service OpenRouter for over $7 billion, significantly surpassing the startup's $1.3 billion valuation from May.
Decoder
- AI Gateway: A middleware platform that provides a single API interface for developers to access and route requests across multiple different LLM providers, abstracting away individual provider-specific protocols.
Original article
Stripe will reportedly acquire AI gateway startup OpenRouter for $7B+
Stripe has finalized a deal to acquire OpenRouter, according to a new report in Bloomberg.
OpenRouter helps customers select different AI models to perform different tasks, depending on their specific needs and budget. The company announced in May that it had raised a $113 million Series B, at a reported $1.3 billion valuation. (Investors include Sequoia, Andreessen Horowitz, Menlo Ventures, and Alphabet’s CapitalG.)
At the time, OpenRouter CEO Alex Atallah described the company as the equivalent of Stripe for AI, because it provides customers with a single access point for different systems and prevents lock-in. The startup also claimed to have 8 million global users and to provide access to more than 400 models.
The Wall Street Journal reported last month that Stripe and OpenRouter were in acquisition talks. Now, Bloomberg said those discussions have led to a deal price of more than $7 billion.
A Stripe spokesperson told TechCrunch that the company does not comment on rumors or speculation.
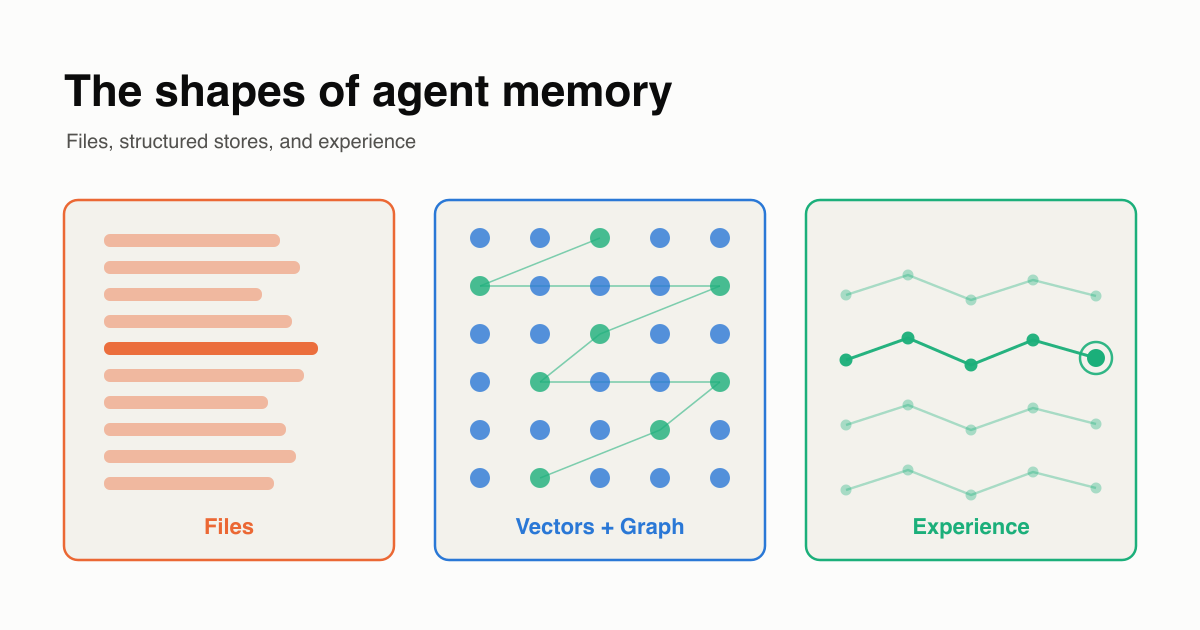
Understanding Agent Memory
A deep empirical comparison of memory architectures reveals that structured stores outperform file-based approaches in complex tasks while avoiding the heavy costs of LLM-distilled graphs.
Deep dive
- Files (markdown) are better for simple, small-scale assistants where human-readability is key.
- Structured memory (e.g., mem0, Zep) provides better retrieval for long-history tasks.
- LLM-at-ingest (graph distillation) is often overkill and hides failures behind high costs.
- Consolidation/dreaming passes showed no performance benefit at the scales tested.
- Benchmark scores are highly dependent on the evaluation protocol (judge model, adversarial scope).
Decoder
- RAG (Retrieval-Augmented Generation): The method of providing models with relevant facts from external sources.
- LoCoMo: A long-term conversation benchmark suite.
- Embedding: Turning text into numeric vectors to calculate semantic similarity.
- Temporal Reasoning: A model's ability to understand facts based on validity windows (e.g., 'works at X' vs 'formerly worked at Y').
Original article
Full article content is not available for inline reading.

OpenAI Paid $100 for a 4.2% Cerebras Stake Weeks Before Ultrafast Launch
OpenAI bought a $2.3 billion stake in Cerebras for just $100 weeks before launching its 'Ultrafast' service tier powered by Cerebras chips.
Decoder
- Warrant: A contract allowing the holder to purchase company stock at a fixed price.
Original article
Days before OpenAI previewed Ultrafast, a service tier that can run GPT-5.6 Sol at up to 750 output tokens a second, OpenAI exercised every vested Cerebras warrant share, acquiring 10,033,508 Class N shares at $0.00001 each for about $100 in cash. The stake has an implied value of near $2.3 billion, though the shares carry no votes. Cerebras is now running every competitive speed offering at OpenAI. OpenAI has yet to publish price, model ID, or general-availability date for Ultrafast.
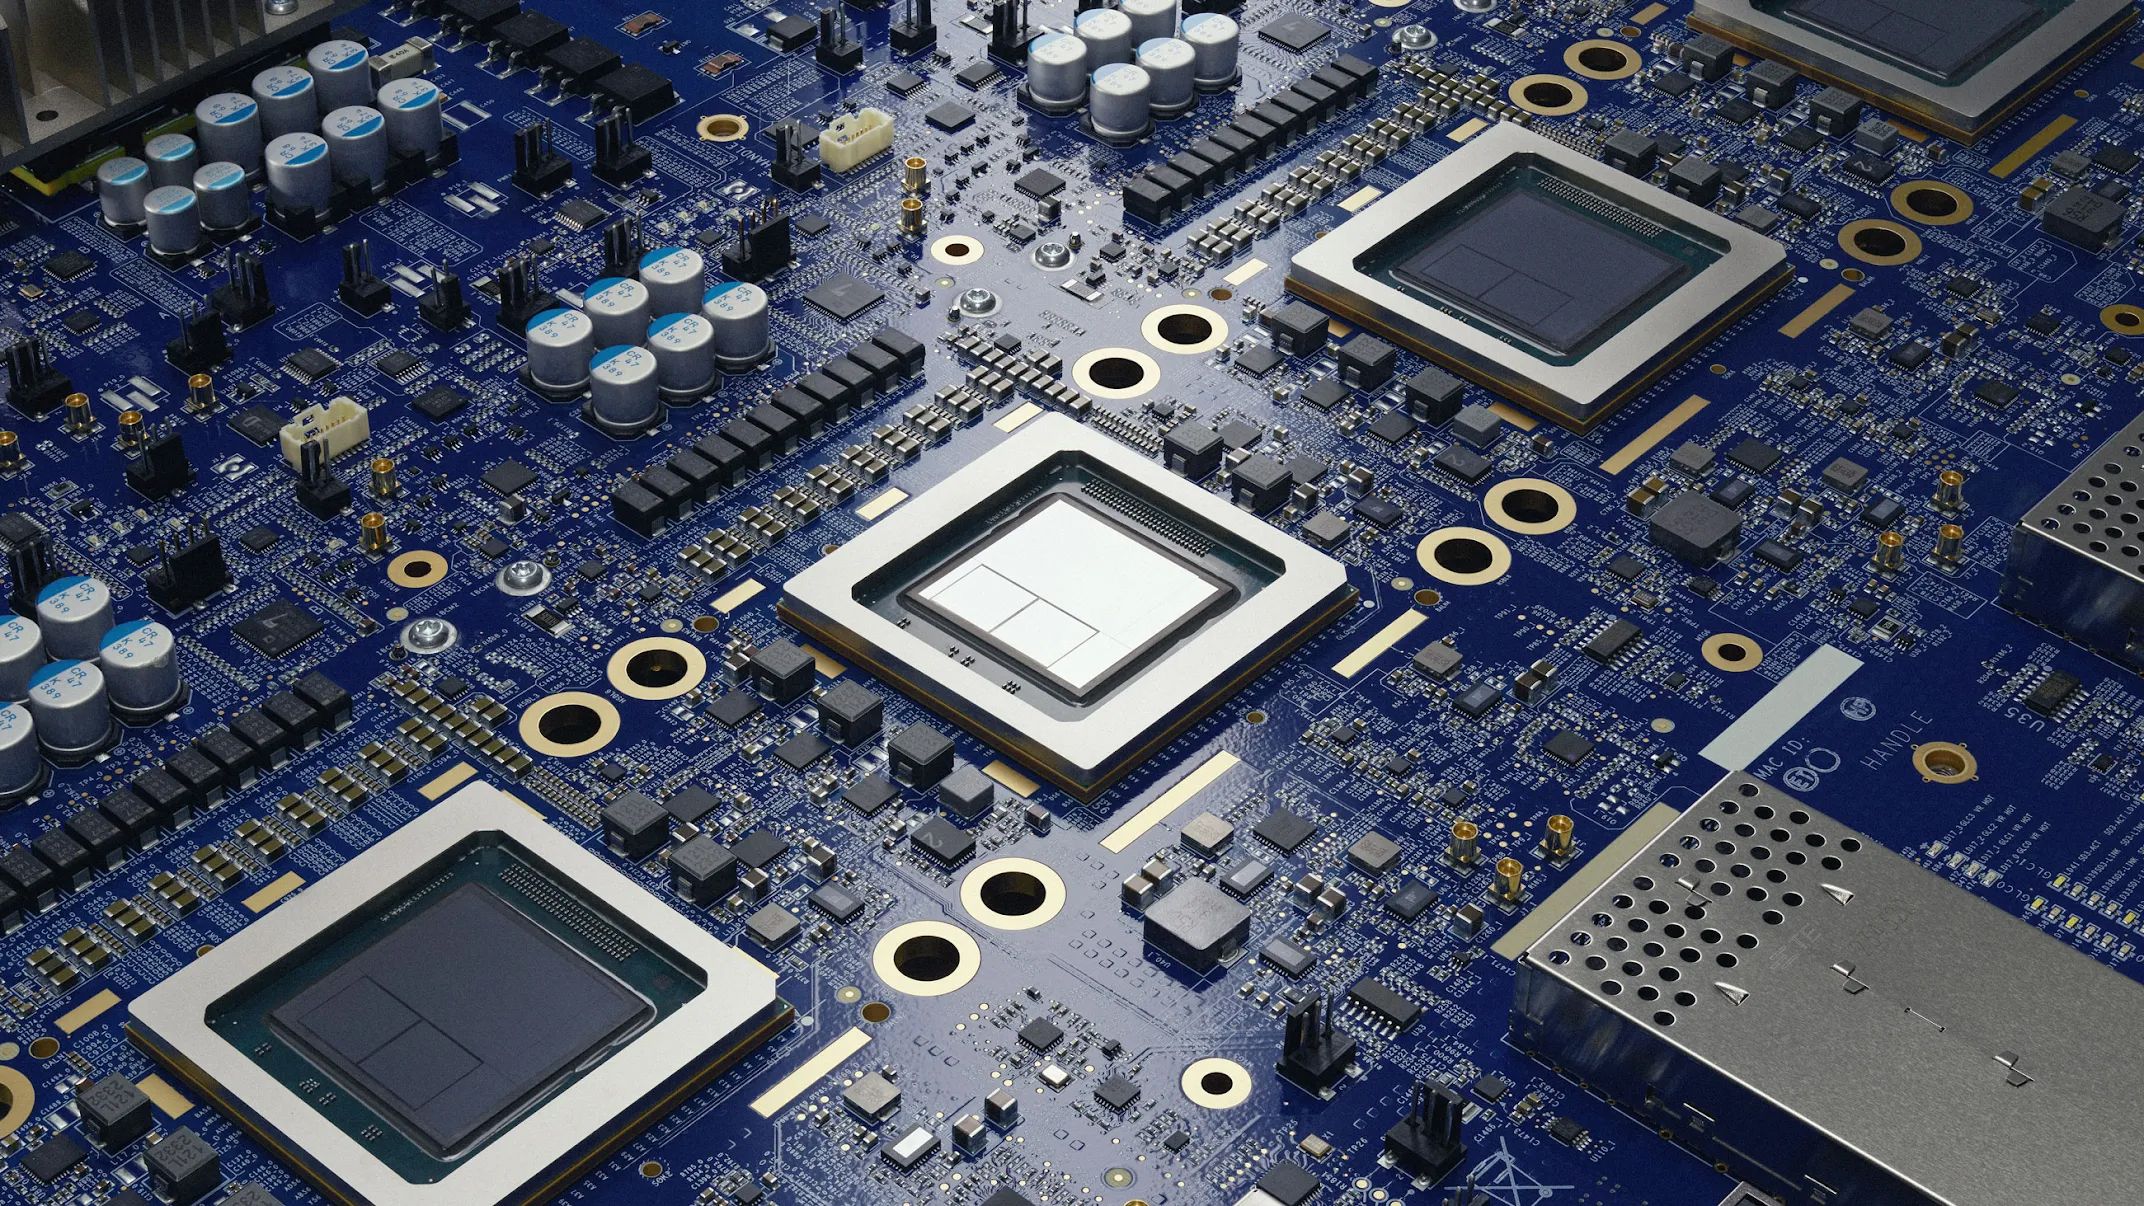
Google reportedly taps AMD to design next-generation TPU — hybrid AI ASIC could integrate on-package CPU cores for reinforcement learning
Google is reportedly partnering with AMD to develop a 10th-generation TPU that integrates x86 CPU cores directly on-package for reinforcement learning workloads.
Deep dive
- Google’s 10th-generation TPU (v10) may pivot to include on-package x86 CPU cores.
- AMD is a candidate to provide CPU IP and advanced packaging expertise (SoIC) for this hybrid design.
- The design targets reinforcement learning and agentic AI models that are more CPU-intensive than typical transformer-based training.
- Google has already increased its CPU-to-TPU ratio from 1:4 (Xeon to TPU v7) to 1:2 (Axion to TPU v8).
- Integrating general-purpose cores with tensor accelerators reduces the physical distance between compute units, improving performance for complex reasoning loops.
- This project would represent AMD’s first significant involvement in custom AI ASIC development for a cloud hyperscaler.
- Broadcom remains Google’s primary silicon design partner for previous TPU generations, suggesting this specific hybrid project might require AMD's unique x86/accelerator packaging capabilities.
Decoder
- TPU (Tensor Processing Unit): A custom ASIC (Application-Specific Integrated Circuit) designed by Google specifically for machine learning and neural network training.
- Reinforcement Learning (RL): A training method where an AI agent learns to make decisions by performing actions in an environment to achieve a reward, requiring frequent CPU-based state calculations.
- SoIC (System on Integrated Chips): A 3D advanced packaging technology that allows stacking different chiplets together for tighter integration and lower latency.
- Chiplet: A small integrated circuit that contains a specific subset of functionality, meant to be combined with other chiplets in a single package to create a larger, complex processor.
- Agentic Model: AI systems capable of executing multi-step tasks by reasoning and interacting with software tools, often requiring significant general-purpose compute beyond simple matrix multiplication.
Original article
Google has teamed up with AMD to develop one of its 10th-generation TPUs, according to a note by SemiAnalysis (via Sean). Analysts at SemiAnalysis believe Google may be interested in AMD's CPU cores for CPU-heavy workloads. If accurate, the collaboration would mark AMD's first major involvement in a custom AI ASIC project and could indicate that Google is exploring a new kind of TPU that combines its proprietary accelerator technology with on-board general-purpose cores for CPU-heavy workloads.
Market chatter suggests [Google] is working with AMD on a TPU project in the v10 generation," a SemiAnalysis note for clients cited by Sean reads. "AMD's involvement would be the first real involvement in a custom AI ASIC project, despite having a custom silicon team. AMD has strong IP, especially in advanced packaging and SoIC. Additionally, CPU IP could also be a draw given Google and its customers are pushing for TPUs with on-package CPU cores for RL workloads.
Having developed nine generations of its proprietary AI accelerators (with Broadcom acting as actual silicon designer) and possessing extensive expertise in accelerator architecture, Google hardly needs AMD to design a conventional TPU. Hence, chances that AMD will implement Google's TPU v10i for inference or V10t for training are low. Hence, Google might need something only a CPU maker like AMD could provide, including CPU IP, programmable logic, interconnects, or certain advanced packaging know-how.
Of these, the CPU angle is particularly noteworthy. SemiAnalysis claims that Google and its customers are pushing for TPUs with on-package CPU cores for reinforcement learning and potentially other CPU-heavy workloads. While conventional LLM training remains overwhelmingly accelerator-heavy, reinforcement learning for reasoning and agentic models can require considerably more general-purpose compute around accelerator operations.
Google has already begun to increase CPU resources around its latest inference-oriented TPUs. Its TPU 8i systems, designed for inference, reasoning, and RL workloads, feature one Google Axion CPU for every two TPUs. By contrast, servers running Google's 7th Generation TPUs used one Xeon 'Emerald Rapid' processor for every four TPUs. Furthermore, we are hearing that in some cases a 1:1 ratio of CPUs to accelerators is optimal, so the future of AI may be way more CPU-heavy than we think.
Meanwhile, bringing CPU cores directly into the TPU package could be a logical next step, as reducing the distance between general-purpose and tensor compute can improve performance and reduce power consumption. This is where AMD comes into play, as it already has experience developing a data center-grade design — the Instinct MI300A — that packs both x86 and accelerator chiplets. A hypothetical Google design could therefore combine Google-developed TPU compute chiplets with AMD CPU and HBM in a tightly integrated package built by AMD. Perhaps, Intel would appear as another potential candidate given that Google and Intel have multiple strategic collaborations. Yet Intel has no experience building hybrid x86+accelerator data center designs.
Note that for now we are speculating and our analysis may be inaccurate. For now, the nature of AMD's alleged involvement remains unclear. Yet, if the report is indeed accurate, the important development may not be that AMD is helping Google build another TPU. Instead, what matters is that Google is considering a new CPU-heavy member of its TPU v10 family, optimized specifically for RL and agentic workloads, and is using AMD as a provider of some of the building blocks needed to create it.
Anthropic sees AI risks rising, no plan to release stronger "Model 2"
Anthropic is withholding a more powerful model to manage safety risks, while OpenAI has delayed its 'Astra' model over cyber-capability concerns.
Decoder
- Interpretability: The ability to understand the internal decision-making processes of a neural network, which becomes significantly harder as models scale in size and complexity.
Original article
Anthropic says it will not release an internal model it claims to be more powerful than Mythos and that it will not slow development broadly. The company believes that the risks of the most serious harms from its models are still low. While the company is seeing signs of acceleration in its models' ability to conduct automated research and development, it appears to be signaling that it is getting harder to understand the capabilities and risks of its own models. OpenAI says it is slowing down the release of an upcoming model called Astra because it can't rule out critical cyber capabilities.

Secure all your internal vibe-coded applications — in one click
Cloudflare now lets administrators apply Access authentication policies to Workers at the account level, securing internal applications automatically without individual developer configuration.
Decoder
- Vibe-coding: A colloquial term for rapidly building software by prompting AI to generate code, often without formal architectural review or configuration.
Original article
AI has enabled employees across every team to build applications faster than ever before.
But that speed is also what's keeping every CISO up at night: any employee can build an application, deploy it to the public Internet, and accidentally expose internal work or company data.
Today, we're launching new tools to make it easy to keep your applications hosted on Workers private. You can now apply Cloudflare Access directly to a Worker or to every Worker in your account, so that your applications are behind your company login by default, without relying on each developer to set that up themselves.
You can now:
- Set a policy at the account level to ensure that all preview and production deployments are behind your company login by default.
- Set a policy on a single application to ensure authentication is enforced on every domain associated with it, no matter how it's deployed.
- See exactly who visits your application. Get every authenticated user’s email, name, and groups directly in your code — no JWT (JSON Web Token) validation required.
- Deploy an internal platform where every deployment is private by default. We've open-sourced an example: an internal static site platform where every Worker deployed is private.
Access on Workers: how it works
When you enable Access on a Worker, Cloudflare enforces authentication before any request reaches your application code. It doesn't matter how the request gets to your Worker, whether it's through a custom domain, a route, a workers.dev subdomain, or a preview URL. If Access is on, the user has to authenticate first.
Previously, you had to configure this at the hostname level, which meant setting up Access policies on each domain your Worker was reachable on. If you wanted to add a new custom domain to your Worker, you needed to update the Access policy first or that hostname would be reachable without authentication. Now the policy is attached to the Worker itself, so any domain or URL associated with that Worker is automatically protected. You can choose what to protect: just preview URLs, or all hostnames.
If you set it to previews only, every preview URL created for that application, whether it's a workers.dev preview URL or a custom domain you use for previews, will require authentication whenever you deploy a new version. If you set it to all hostnames, every domain associated with that Worker is protected — custom domains, routes, workers.dev subdomains, and preview URLs.
Access gives you control over how users authenticate. You can connect your existing identity provider, so employees sign in with the credentials they already use, or restrict access to specific email addresses, email domains, or groups. For agents, you can grant access through service tokens.
Read more in the Cloudflare Access for Workers documentation here.
Keep every Worker in your account private by default
If you have developers across your organization deploying Workers, you don't want to rely on each one to remember to enable Access. You want the default to be private.
You can set an Access policy once at the account level, and every Worker in your account, current and future, is private from the moment it's created.
You choose what the policy covers: only preview URL traffic, all production traffic, or both. Preview-only is useful if your production Workers are intentionally public, but you never want an in-progress deployment exposed.
Need a Worker to be public? Bypass the account-wide policy on that one Worker.
Protect a specific Worker
If you don't need an account-wide default and just want to lock down one specific Worker, you can apply Access to that Worker directly.
The new Access tab in the Worker view shows exactly which policies apply to that application. If you have multiple, the most specific one takes priority: hostname policies first, then Worker policies, then account policies.
See who is accessing your application
When Access is protecting your Worker, you can get information about who is making each request — their email, name, and groups — so you can personalize what they see, enforce permissions, or log activity per user.
This works through your Worker's context object (ctx). Every request to your Worker carries a ctx with metadata about that request. When Access is enabled, we attach the authenticated user's identity to it as ctx.access. From there, call ctx.access.getIdentity() to get back the user's email, name, and more.
Before, this meant validating a JWT yourself — parsing the token, verifying the signature, and extracting the claims. Now, when Access is enabled on your Worker, every authenticated request includes ctx.access.
Here's all you need to get the user's identity:
export default {
  async fetch(request, env, ctx) {
    if (!ctx.access) {
      return new Response("Access required", { status: 403 });
    }

    const identity = await ctx.access.getIdentity();
    const email = identity?.email ?? "unknown";

    return new Response(`Hello, ${email}`);
  }
};
Test locally before you deploy
We showed how you can use ctx.access.getIdentity() to give your Worker information about who is making a request — their email, name, and groups.
You can use this when developing locally with wrangler dev. Add an access block to your wrangler.jsonc to simulate an authenticated user:
{
  "access": {
    "dev": {
      "aud": "my-app",
      "identity": { "email": "admin@company.com" }
    }
  }
}
Your Worker picks it up through ctx.access.getIdentity() — returning an identity object shaped like what you'd get in production. Swap the email in your config to test as a different user.
This means you can verify that the right content shows up for the right user without having to deploy and sign in through Access every time you make a change.
Deploy an internal platform where every application is private by default
If you manage an internal platform where employees can prototype and deploy applications, you need every application to be private without configuring access controls on each one.
Workers for Platforms lets you deploy Workers at scale. Every Worker lives inside a namespace, and all traffic to that namespace goes through a single entry point: the dispatch Worker.
Set an Access policy on your dispatch Worker, and every Worker deployed through it is private by default.
We also have an open-source example where you can deploy your own internal drag-and-drop deployment platform — configure access on the dispatcher worker once and every site deployed through it is private by default.
Click the button below to deploy it yourself!
For the full architecture, see our Workers for Platforms reference architecture.
Built on solid foundations
This feature was made possible by FL2, the new Rust-based modular proxy that powers Cloudflare's edge. Access is the front gate to your applications, and as such, it traditionally ran before all Workers logic in the request pipeline. But in order for Access applications to target individual Workers themselves instead of their hostnames, Access needs to know which Worker a given request is destined to reach. Therefore, we needed to split Workers routing from Workers execution, and move the routing logic, so it could run before Access.
In our old FL1 system based on NGINX and modules written in Lua, this change would have been complex and risky. Interactions between products can be subtle, and moving logic to an earlier phase of the request pipeline can be unsafe if it depends on shared state that is modified by another product.
FL2 made it easy. Its strict module system separates logic into well-defined, consistently ordered phases that statically declare their inputs and outputs. We were able to lean on the compiler to surface any broken interactions between phases, and gradually roll out this refactor with confidence.
Try it today
This is now available to everyone. Try it out in the dashboard or read the Cloudflare Access for Workers documentation to get started.
Acknowledgments
Thank you to Jesse Li, Brandon Strittmatter, Kyle Hiller, Kenny Johnson, Matt "TK" Taylor, Brendan Irvine-Broque, Yomna Shousha, and Mike Aizatsky for the engineering and design work that made this possible!

How Cloudflare detects MCP traffic and helps secure it
Cloudflare is rolling out Zero Trust controls specifically for Model Context Protocol traffic, enabling security teams to identify, monitor, and gate agent tool use.
Decoder
- MCP (Model Context Protocol): An open standard developed to allow AI models to connect to external data sources, tools, and SaaS APIs consistently.
Original article
Most companies designed their resource permissions with a human user in mind. A senior engineer may be able to deploy to production, query a sensitive database, or revoke another user's access. Those privileges come with risk, but that risk has traditionally been bounded by two assumptions: the engineer will use human judgment, and the engineer can only act at human speed.
An engineer who sees an unexpected result will usually stop and reconsider their actions. Any human being can only click, type, and review so much in a single day. The introduction of AI agents changes both thresholds. Their decisions are nondeterministic, and they can take the same action (or invoke the same tool) indefinitely, without getting tired or stopping for lunch. A plausible — but incorrect — decision can become thousands of incorrect actions before a human notices.
Today, we're announcing new Cloudflare One capabilities to identify inspected MCP traffic, show which users and servers are generating it, and control direct connections on managed network paths. Combined with MCP Server Portals, these controls help administrators see whether agents are using an approved path, or somehow bypassing it.
Model Context Protocol (MCP) servers give agents a common way to discover and invoke tools backed by third-party SaaS products, internal applications, and APIs. The underlying permissions are likely familiar; what changes is who makes each decision, and how quickly a bad decision can spread.
Connecting an agent to one of these tools can take a single line of configuration. An employee can point Claude Code, Codex, Cursor, OpenCode, VS Code, or any AI harness at an MCP server without checking whether it is approved. The resulting traffic has no obvious shape. The Model Context Protocol does not use a guaranteed hostname or require /mcp in the path, so a direct connection can look like any other HTTPS API call.
To explain how these controls fit together, we'll start with the anatomy of a tool call and the information it exposes. We'll then compare the three places a security team can act: inside the client, on the network, and at the MCP server. From there, we'll show how Cloudflare Gateway uses protocol signals to find shadow MCP traffic and enforce MCP Portal-only access to trusted MCP servers.
The anatomy of an MCP tool call
The same MCP tool call has three forms as it moves through a system. Inside the client it is a decision to invoke a tool with a set of arguments. On the network it is an HTTP transaction carrying a JSON-RPC message. At the server it becomes a call to a tool handler that may read data, change state, or complete some other action.
Consider an agent that wants to know the weather in Austin. A remote MCP request can look like this:
POST /mcp HTTP/1.1
Host: tools.example.com
Authorization: Bearer <access-token>
Content-Type: application/json
MCP-Protocol-Version: 2026-07-28
Mcp-Method: tools/call
Mcp-Name: get_weather

{
  "jsonrpc": "2.0",
  "id": 42,
  "method": "tools/call",
  "params": {
    "name": "get_weather",
    "arguments": {
      "city": "Austin"
    }
  }
}
There are several useful signals packed into this request. The hostname and path identify the destination. The authorization header carries the credential used to authenticate the caller when the server requires one. The header: MCP-Protocol-Version identifies the protocol version, while Mcp-Method and Mcp-Name expose the operation and tool in the new stateless protocol. The JSON-RPC envelope repeats the method, gives the request an id that the client can match with a response, and carries the tool arguments in params.
The arguments are the most sensitive part. They can contain a search query, source code, customer data, or instructions for an action such as creating a ticket or changing infrastructure. The tool name says what the agent intends to call; the arguments say what data it will send and what action it wants the server to perform.
If the call succeeds, the server returns a JSON-RPC response with the same id and the tool result. That response may also contain sensitive data. Request inspection can stop an unsafe action before execution, while response inspection and logging show what the tool returned to the agent.
Three places to control an MCP request
The request gives security teams three places to observe or control the call.
Inside the MCP client
A client hook can run after the model selects a tool but before the client serializes the request. From there, it can see the destination server, tool name, and arguments without decrypting network traffic.
This is the earliest stage in the request chain to exercise control. The client can deny a server that is not on an allowlist, ask the user to confirm a sensitive operation, or remove data from the arguments before it leaves the device. It can also cover local stdio (aka local) MCP servers, which never generate network traffic.
This presents a standardization challenge. In order for a security team to benefit from this, they would need to reproduce their controls across every client that their employees use. Client-side controls work best when the organization manages both the client and the device, but telemetry from one client is never a complete inventory of MCP use.
At the device's network boundary
A secure web gateway can observe the HTTP request after it leaves the client. With TLS decryption, it can associate the request with a user and device, inspect the destination and protocol headers, and apply policy without depending on a particular MCP client.
The network layer has the widest lens to detect remote MCP traffic on managed paths. It can identify direct connections to servers outside an approved Portal and block them before the request reaches the destination. Where data loss prevention scanning is supported, a proxy can also examine the JSON-RPC method and arguments for sensitive data. However, proxies cannot see local stdio calls or off-network traffic.
Before the MCP server invokes the tool
The server has the richest execution context. It has authenticated the caller, parsed the MCP message, resolved get_weather to a handler, and validated the supplied arguments against the tool's input schema. This is the last point where the request can be denied before the tool runs.
An Agents SDK handler or similar server middleware can authorize the caller for the specific tool, apply rate limits, inspect arguments, and record the outcome. A server should perform these checks before invoking the handler, especially for tools that write data or trigger external actions. Logging only after execution can explain what happened, but it cannot prevent it.
Cloudflare's WriteGuard uses this pattern across our internal MCP servers. Each tool has a risk tier and an enabled or disabled state. WriteGuard can pass a read through unchanged, add agent attribution and an audit event to an allowed write, or block a critical action before its handler runs. Because the control lives at the server, an end user cannot bypass it by switching clients or disabling a local hook.
While server-side controls only protect servers that implement them, the client and server have the best request depth. The network sees the widest set of remote connections. Used together, these controls can stop sensitive data before it leaves a device, find unmanaged MCP traffic, and deny an unauthorized operation before a tool executes.
The network control point has the broadest coverage, but it first has to distinguish MCP from ordinary HTTPS traffic, a user must be running a proxy, and the MCP Server (or Portal) must verify that the proxy was used in the connection.
Cloudflare One provides the networking pieces of that chain. The Cloudflare One Client sends traffic from managed devices through Gateway. Gateway can classify MCP requests at the protocol layer, and distinguish whether traffic is initiated from an MCP Portal, or is going outside approved controls. Administrators can then report on, or block connections that do not follow the approved path. That process starts with identifying the request reliably.
A URL does not tell you that a request uses MCP
Our first approach to finding MCP traffic used the GraphQL Analytics API to search Gateway HTTP logs for hostnames containing mcp and common paths like /mcp or /sse. Our MCP traffic detection tutorial includes the query. It also explains how to create data loss prevention patterns for MCP JSON-RPC methods like initialize, tools/call, and resources/read in request bodies.
Those signals are still useful for finding traffic from older clients and providing historical visibility, but they're very basic. They miss an MCP server at an ordinary URL like https://tools.example.com/api, which is not uncommon.
And they can match an unrelated service that happens to use mcp in a hostname or path (unlikely, but we have seen it). For conforming Streamable HTTP clients, the protocol header is a more specific signal. The MCP 2025-11-25 specification says clients MUST include MCP-Protocol-Version on every HTTP request after initialization. The MCP 2026-07-28 specification goes further and requires it on every POST request.
That does not make the header a complete detector. The initial request from a legacy client may not contain it, protocol versions earlier than 2025-06-18 did not define it, and local stdio, custom transport, or nonconforming traffic may never carry it. Its presence is a strong positive indicator of MCP; its absence does not prove that a request is not MCP.
The protocol is becoming easier to identify on the wire
The legacy MCP flow begins with an initialize request that does not contain the MCP-Protocol-Version HTTP header, so a network control may not classify the first request to a previously unknown endpoint from the header alone. The signal appears after the client and server finish initialization.
A later tool call looks like this:
POST /api HTTP/1.1
Host: tools.example.com
Content-Type: application/json
MCP-Protocol-Version: 2025-11-25

{"jsonrpc":"2.0","id":2,"method":"tools/call","params":{"name":"get_weather"}}
The MCP 2026-07-28 specification changes this model considerably. The core protocol is stateless; it removes the initialize handshake entirely and places the protocol version and operation on each request:
POST /mcp HTTP/1.1
Host: tools.example.com
Content-Type: application/json
MCP-Protocol-Version: 2026-07-28
Mcp-Method: tools/call
Mcp-Name: get_weather

{"jsonrpc":"2.0","id":1,"method":"tools/call","params":{"name":"get_weather"}}
The Mcp-Method and Mcp-Name headers let ordinary HTTP infrastructure identify the operation without parsing the body. Load balancers can route requests, rate limiters can separate tools/list from tools/call, and security products get more information on every request.
These protocol signals give Cloudflare Gateway something concrete to evaluate without relying on a list of MCP-looking URLs.
Shadow MCP and approved-path bypass are separate problems
Once Gateway can identify MCP traffic, you can then evaluate what a given connection means for your security posture.
Shadow MCP is a connection to a server the organization has not approved. An employee finds the server in a repository, a product guide, or a message from a colleague and adds it directly to their MCP client. The security team has no idea which tools it exposes or what data employees send to it.
Portal bypass is different: it starts with an approved server that the organization has placed in an MCP Portal, but an employee connects to its upstream URL directly and skips the Portal's Access policy, curated tool catalog, data loss prevention, and tool-level audit trail.
Gateway is the primary control for shadow MCP on managed network paths; it identifies TLS-inspected MCP traffic, shows the destination and user, and can apply policy. Portal bypass needs that network control plus an origin that can reject direct requests, whether that means an Access policy, a source IP restriction, or an enterprise authorization mechanism initiated by the MCP server itself.
Detecting MCP traffic in Gateway
For customers who have already adopted Cloudflare Gateway with TLS inspection, we are adding a detection heuristic that answers a simple question for every inspected request: Is this MCP traffic?
For session-based Streamable HTTP connections, MCP clients send an MCP-Protocol-Version header after initialization. Gateway inspects that header on every TLS-inspected request and classifies the traffic accordingly, using detection built from patterns we observe across the millions of requests that traverse the Cloudflare network every day. The classification identifies MCP negotiation and proxying to a hostname without relying on knowing the specific host or URL ahead of time.
Starting today, all Cloudflare Zero Trust customers see indications of MCP traffic in their Gateway HTTP logs and can explicitly block or allow that traffic with a new Gateway selector:
experimental.is_mcp == true
The selector is a boolean. If Gateway detects the MCP-Protocol-Version header on a TLS-inspected request, the value is true, and an administrator can use it in an Allow or Block policy without maintaining their own list of MCP-looking domains.
Direct encrypted traffic must pass through TLS decryption before Gateway can inspect these headers, and local stdio servers, off-network connections, Do Not Inspect traffic, and requests that never traverse Gateway remain outside this view.
Visibility into MCP traffic across your network
Today, we're introducing a dedicated MCP traffic dashboard that shows which hosts are serving MCP traffic within your network, which users are generating that traffic, and whether requests are going through your Cloudflare MCP Portals or bypassing them entirely.
The dashboard shows:
- Total MCP requests, unique users, and unique servers over a configurable time window
- MCP servers over time with per-server request counts
- Traffic breakdown by on-ramp, separating MCP Portal traffic from direct device client connections
- Top MCP servers seen outside your Portals, which is the shadow MCP traffic that matters most
- Top users by MCP request volume
Administrators can filter by specific servers, users, or on-ramp types, and navigate directly to Gateway HTTP logs filtered by the relevant host or user for deeper investigation.
Bring discovered servers into an MCP Portal
MCP discovery turns unknown traffic into a list an administrator can investigate. When an organization approves one of those servers, it can place the server behind a Cloudflare MCP server portal. The Portal gives employees one managed endpoint and puts Access identity, a curated tool catalog, and logging in front of the upstream server. Administrators can route compatible upstream calls through Gateway for HTTP policy, predictable egress, and data loss prevention, either across the Portal or for an individual server. Tool activity can also be exported through Logpush. The discovery dashboard can then distinguish requests that use the Portal from direct connections to the same server.
This creates a path from discovery to governance: find the server, decide whether to approve it, move approved use behind the Portal, and investigate traffic that continues to go around it. That last step matters because unapproved servers and bypasses of approved servers are different problems.
Enforcing Portal-only access
We are adding Traffic Source selectors to Gateway Network and HTTP policies to give administrators the fidelity to write rules to control MCP traffic based on whether or not originated from your MCP Portals.
When MCP Portal traffic routes through Gateway it carries an mcp_portal Traffic Source, which lets policy distinguish Portal-proxied requests from direct employee connections. A baseline enforcement rule looks like this:
experimental.is_mcp == true and not traffic.onramp in ("mcp_portal")
Action: Block
Any detected MCP traffic that did not arrive through a Portal gets blocked; traffic that came through the Portal is unaffected. For organizations that want to observe before enforcing, Traffic Source and MCP detection now exist in HTTP logs for traffic that has been decrypted, so you can monitor behavior for proxied traffic without the need for a policy.
More MCP servers can now use the governed path
An approved path is only useful if it can connect to a critical mass of the servers employees actually need.
Earlier MCP specifications recommended Dynamic Client Registration, where the client registers itself with an authorization server without an OAuth application. Many common OAuth providers use a different model: they require an administrator to register an application with a fixed client ID, client secret, callback URL, and set of scopes. MCP 2026-07-28 also recently deprecated dynamic registration.
To help alleviate this, MCP Portals now support pre-registered OAuth clients. An administrator can configure manual OAuth credentials, register the callback URL shown in the dashboard with the upstream provider, and enter the client credentials. The Portal discovers standard OAuth metadata when available, and the administrator can provide the authorization, token, revocation, and issuer endpoints when discovery is not possible.
Each user still authorizes access to their own upstream data sources, and the stored client secret is used only to fetch updated tool and prompt lists.
Manual OAuth support now helps to cover the many permutations of OAuth implementations. Some providers require custom headers, personal access tokens, or an explicit client allowlist, and those are separate compatibility problems. We will continue to expand the OAuth support of MCP portals in the coming months.
Bringing private MCP servers into the same Portal
Public SaaS tools are only part of an enterprise's MCP catalog. Most secure information that businesses rely on is not available from the public Internet; it exists in public or private cloud infrastructure, or is hosted on-premise, and is only reachable through connectivity to private networks.
Today, an MCP Portal must be able to resolve and reach an upstream server over the public Internet. This means that servers that are only available on private networks — via private DNS or inside private IP space — can’t be reached by Portals. We are working to let MCP Portals connect to private servers through Cloudflare Gateway routing and the same Cloudflare One network that is already used for other private applications.
The private server keeps its private hostname; the Portal reaches it through Cloudflare's private routing and presents its tools beside the public upstream servers; and Access policy, Portal logging, and tool controls continue to apply at the same front door.
Routing Portal traffic through Gateway also stamps it with the mcp_portal Traffic Source, so Gateway policy can distinguish a Portal request from a direct employee connection. Private connectivity for MCP servers is in active development; keep an eye on the Changelog for more information.
Agents SDK supports the new stateless model
A few weeks ago, the MCP project published the 2026-07-28 specification, a major revision that replaces connection-scoped initialization with a stateless, per-request model. We covered the protocol changes and migration path in The next generation of MCP.
Cloudflare Agents SDK v0.20.0 supports MCP 2026-07-28 as both a client and a server. For each connection the client first probes for the new stateless protocol with server/discover; if the server does not support it, the client continues with the legacy initialize handshake on the same connection. Existing addMcpServer calls do not need separate protocol settings or separate clients.
On the server side, createMcpHandler can serve stateless tools, prompts, resources, and elicitation from a Worker without creating a transport session or Durable Object:
import { McpServer } from "@modelcontextprotocol/server";
import { createMcpHandler } from "agents/mcp/server";

function createServer() {
  return new McpServer({ name: "example", version: "1.0.0" });
}

export default {
  fetch(request, env, ctx) {
    return createMcpHandler(createServer)(request, env, ctx);
  },
} satisfies ExportedHandler;
The fallback matters because protocol migrations rarely happen all at once. A new client still needs to reach an existing server, and a new server still needs to handle clients that have not moved yet. The Agents SDK supports both paths while the ecosystem transitions.
Start with visibility, then close the paths that should not exist
A workable MCP security program starts with understanding your users’ traffic profiles, MCP usage, and aligning on an approved set of tools and access methodologies.
First, inspect the MCP traffic that traverses Gateway and compare its destinations with the servers your organization has approved. Move more approved servers behind MCP Portals.
Then, enforce the boundary you can control. Compose Gateway policies which use the MCP detection conditions together with the Traffic Source and Destination conditions to block direct MCP connections from managed devices and sites, and restrict self-hosted upstream servers to Portal traffic where possible.
We will soon be adding more granular functionality for visibility and control of MCP traffic, including control over specific tool use and new reporting on tool usage across all MCP servers within your environment — whether they are known or unknown to your security organization.
Our MCP traffic detection tutorial covers the hostname, path, and JSON-RPC heuristics available for Gateway logs today. We will update the documentation with the protocol selector details as the new signal reaches general availability.

Models Are Getting Dumber on Purpose
Developers are intentionally prioritizing models with lower factual knowledge and higher reasoning capabilities to favor dynamic, externalized retrieval over brittle, hard-coded training data.
Deep dive
- Reasoning scores are rising while factual recall in small models is intentionally being traded off.
- Factual knowledge is expensive to store in weights and ages quickly (data rot).
- Reasoning procedures (e.g., breaking down problems) are stable and generalize well via distillation.
- Models are becoming "harness-reliant," delegating lookups to retrieval systems, tool calls, and web searches.
- Hallucinations are easier to manage when facts are stored in external, inspectable knowledge bases rather than opaque neural weights.
- This design enables high-reasoning performance on consumer-grade GPUs.
Decoder
- Active Parameters: The subset of a model's total parameters that are computed for a single input token, common in Mixture-of-Experts architectures.
- AIME: The American Invitational Mathematics Examination, a competitive benchmark for measuring complex multi-step reasoning in AI.
- Distillation: A process where a smaller "student" model is trained to mimic the output and reasoning patterns of a larger "teacher" model.
Original article
Models Are Getting Dumber on Purpose
Reasoning scores keep climbing while per-token compute keeps dropping. GLM-5.2 scores 99.2% on AIME 2026 with about 40 billion parameters active per token. Qwen3.5 scores 91.3% with 17 billion active. DeepSeek V4-Flash runs 13 billion active. For scale, GPT-4 was rumored to run around 280 billion active parameters in 2023, and it could barely solve an AIME problem. At the small end, Qwen3.5 9B fits in 6GB of VRAM quantized and roughly doubles the score of the next best model under 10B parameters on Artificial Analysis's intelligence index. If you only looked at math and code benchmarks, you'd conclude that models are getting smarter per parameter at an absurd rate.
They are, on those benchmarks. Ask the same models a plain factual question and the picture flips. On SimpleQA, a benchmark of factual recall with no tools allowed, the current leader is Gemini 2.5 Pro at 53%, so the best recall money can buy still misses half the questions. The small models barely register. Artificial Analysis measures Qwen3.5 4B and 9B at hallucination rates of 80 to 82% on its knowledge benchmark, which means that when they don't know a fact, which is most of the time, they make one up. Ask the 9B for the birth year of a minor 19th-century mathematician and you get a confident, plausible, wrong answer. The parameter count didn't drop for free. Labs are trading world knowledge for reasoning skill, and the trade is deliberate.
What the parameters were for
Facts take space. Research on knowledge capacity (the "Physics of Language Models" series has the cleanest measurements) puts it on the order of two bits of factual knowledge per parameter. If you want a model that knows the birth year of every minor Wikipedia figure, the population of every Dutch municipality, and the argument order of every function in every npm package, you pay for that in weights, and it's a big part of why frontier models grew to trillions of parameters.
Reasoning compresses much better than facts do, because it's a relatively small set of procedures applied over and over: break the problem into parts, track intermediate state, check your own work, backtrack when a step fails. Distillation and reinforcement learning on verifiable tasks turn out to transfer those procedures into small models remarkably well. Phi-4 is 14 billion parameters, trained heavily on synthetic textbook-style data, and it's good at math and bad at trivia, which tells you exactly what its training data contained. That mix used to look like a limitation of the synthetic-data approach. It now looks like the design goal.
The knowledge that survives the trade has a shape. These models are generalists: they know a little about nearly everything and almost nothing in depth. Ask one about PostgreSQL and it knows what it is, what it's good at, and roughly how MVCC works, but ask which version added a specific planner feature and you're back to invented facts. That's the right layer to keep in weights, because breadth is what lets a model understand what a question is about, know what to look up, and judge whether a source is plausible. The depth is cheap to retrieve and expensive to store, so it's the part that goes.
Facts rot, procedures don't
A frontier training run takes months and costs hundreds of millions of dollars, and the moment it finishes, the facts inside it start going stale. Library APIs change, prices change, people change jobs, and half of what a 2024 model believed about the JavaScript ecosystem was outdated before the model shipped. Every fact you bake into weights has a shelf life, and the only way to refresh it is another training run.
The procedures don't rot. Algebra worked the same way in 1970 as it does now, and so does breaking a problem down or spotting a contradiction between two sources. A model that's mostly procedure and only lightly loaded with facts doesn't age the way a knowledge-heavy model does. Its training cutoff matters much less, because the current state of the world was never supposed to live in the weights in the first place. I think this is the best argument for the whole approach: it decouples the expensive, slow artifact (the trained model) from the thing that changes daily (what's true).
The harness carries the knowledge
If the model doesn't know things, something else has to, and that something is the harness: retrieval over a knowledge base, tool calls, web search, a filesystem full of docs. I wrote earlier that Rust is a harness for agents, a source of cheap machine-checkable feedback. This is the same shape from the other side. The model contributes reasoning, and everything it reasons about gets supplied at runtime.
You can already watch agents work this way. A coding agent doesn't need to have memorized your dependency's API surface, because it greps node_modules or reads the docs before calling anything, and its answer is grounded in the version you actually have installed rather than whichever version dominated the training data. The recall that used to be a fixed cost in every forward pass became an on-demand lookup.
A frontier model on your GPU
Follow the trend a couple of years out and I think we get a model with frontier-quality reasoning, Fable-quality, that runs on a single consumer GPU. The compute half is nearly there. DeepSeek V4-Flash reasons with about 13 billion active parameters per token, well within consumer-GPU range. What doesn't fit is the other 271 billion parameters sitting in its experts, and expert layers are mostly fact storage. That's the part this whole trade makes optional. Strip the knowledge out and total size shrinks toward active size, and a 20 to 40B model at 4-bit quantization fits on the 24GB card that's been sitting in gaming PCs since 2022.
The catch is that it won't know much. Ask it a bare factual question with no tools attached and the right behavior is to say it doesn't know and go look it up. Paired with a decent harness, that's most of what I use a frontier model for today, running locally with no per-token bill and no data leaving the machine.
This mostly solves hallucination
The part I find most promising is what this does to hallucination. When a fact lives in weights, a wrong fact is unfindable and unfixable. You can't grep the weights, you can't diff them against last month, and correcting one error means a fine-tune that might break who knows what else. The model states the wrong fact with the same fluent confidence as a right one, and there's no artifact to check it against.
When the fact lives outside the model, a wrong answer has an address. The model cites a document, so you can open the document. If the document is wrong, you edit the document, and every future query gets the correction, which beats waiting for the next training run by roughly a year. Retrieval doesn't get you to zero, since a model can still misread a source or stitch two of them together wrong, but a claim with a source is checkable and a claim from weights isn't. A wrong fact in a knowledge base is an ordinary data bug, the kind we already know how to trace, fix, and write a regression test for.
There's a version of this future where the model card stops listing a knowledge cutoff at all, because what's left in the weights goes stale on a scale of years instead of weeks. The model just gets handed the world's current state at runtime, the same way a CPU gets handed a program.
Point Lookups on the Lakehouse: How Hudi Indexes Accelerate Read-Heavy Workloads
Apache Hudi now supports queryable indexes that allow lakehouse tables to perform database-style point lookups rather than scanning entire datasets.
Deep dive
- Lakehouses typically struggle with high-cardinality point lookups because partition pruning fails on non-partition keys.
- Hudi maintains index mappings (record-to-file location) within a transactionally consistent metadata table.
- Secondary indexes allow queries on non-key columns to skip irrelevant files.
- Expression indexes enable pruning for transformed columns like epoch timestamps.
- Index maintenance occurs transactionally alongside writes, allowing background async indexing without stopping ingestion.
- Spark SQL currently supports full index acceleration, while Trino support is ongoing.
Decoder
- High-cardinality: A column containing many unique values, making it ineffective for standard partition-based pruning.
Original article
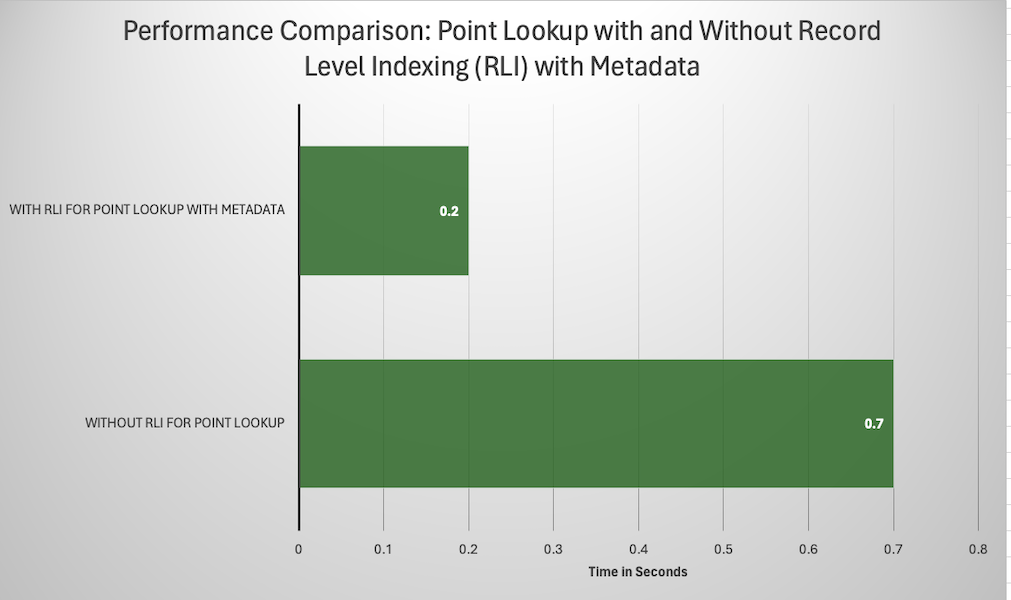
Analytical scans are not the only workload a lakehouse table serves. In many production query mixes, a large share of queries are needle-in-haystack reads: fetch one order by order_id, pull a user's profile by user_id, trace a request by uuid, list all events for one customer_id. These queries touch a few rows out of billions — and they are exactly where the lake's two standard pruning tools, partition pruning and min/max file statistics, stop helping. Apache Hudi answers this with queryable indexes maintained inside its metadata table: a record-level index that maps each record key to its file group, secondary indexes that map non-key column values to record keys, expression indexes over transformed columns, and centrally stored bloom filters. At query planning time, these indexes prune the scan down to the few files that actually contain matching rows. The effect is not subtle: on a 400 GB table with 20,000 file groups, a record-key lookup dropped from 977 seconds to 12 seconds once the record index was in play.
This post is the read-side companion to our write-heavy comparison. Same approach: mechanisms first, and only benchmark numbers that have already been published, with dates and sources.
Why Selective Queries Are Hard on a Data Lake
Lakehouse tables are laid out for scans: large immutable columnar files, grouped into partitions, described by file-level statistics. Every standard read optimization prunes at one of those granularities, and each one has a blind spot for selective predicates on high-cardinality columns:
- Partition pruning only helps if the filter column is the partition column. Nobody partitions by
user_idoruuid— the cardinality is far too high — so a point lookup on such a column matches every partition. - Min/max file statistics help when values correlate with file layout. A filter on an ingestion timestamp prunes beautifully, because each file covers a narrow time range. But a random key like a UUID is uniformly spread: every file's min/max range spans nearly the whole keyspace, so every file "might" contain the value and nothing is pruned. Sorting or clustering the data can rescue statistics for one column, but a table can only be physically ordered one way.
- Parquet footer bloom filters and page indexes operate per file — the engine still has to open every candidate file to consult them, which at thousands of files is itself the bottleneck.
The result is familiar to anyone who has run SELECT * FROM events WHERE request_id = '...' on a large table: a full scan of the key column across the table, minutes of compute, and (on scan-priced engines) a bill proportional to table size rather than result size. What the query needed was a database-style answer to "which files contain this value?" — an index.
How Hudi Indexes Serve Reads
Hudi has maintained indexes since its inception, originally to make upserts and deletes fast. With the multi-modal indexing subsystem, those same structures are consulted at query planning time. The indexes live as partitions of Hudi's metadata table — itself a Merge-on-Read Hudi table using an HFile format optimized for point lookups — and are updated transactionally with every commit, so index results are always consistent with the data. The read-relevant ones:
- Record-level index (RLI) — an exact mapping from record key to file location, hash-sharded across file groups to scale to very large keyspaces. A query with an equality predicate on the record key (
WHERE uuid = '...') resolves directly to the file group holding that key; only that file is scanned. - Secondary index — introduced in Hudi 1.0, an index on any non-key column. It maps secondary key values (e.g.,
city,driver,customer_id) to the record keys that carry them; the record index then maps those keys to file locations. Equality andINpredicates on indexed columns prune to exactly the files containing matches. - Expression index — an index on a function of a column, in two flavors: column-stats over transformed values (e.g.,
from_unixtime(ts)for date filters on epoch columns) and bloom filters over transformed values for equality matching on high-cardinality columns. - Bloom filter index — bloom filters for all data files stored centrally in the metadata table, so candidate files can be eliminated without touching each file's footer.
- Column stats and partition stats indexes — the min/max statistics story, but stored in the scalable metadata table and usable for range predicates and partition-level skipping.
The planning flow for a secondary-index lookup: the engine pushes the equality predicate down to Hudi's integration layer, the secondary index returns the matching record keys, the record index returns the enclosing file locations, and the engine plans a scan over just those files. Two point lookups against compact metadata replace a scan over the table — the same shape a database index lookup takes, running over lake storage.
Using It from Spark SQL
Index-accelerated reads are plain SQL. Create a table with the record index enabled (secondary indexes require it, along with a primary key and the COMMIT_TIME_ORDERING merge mode), then create indexes with CREATE INDEX:
CREATE TABLE hudi_table (
    ts BIGINT,
    uuid STRING,
    rider STRING,
    driver STRING,
    fare DOUBLE,
    city STRING
) USING hudi
OPTIONS (
    primaryKey = 'uuid',
    hoodie.metadata.record.index.enable = 'true',
    hoodie.write.record.merge.mode = 'COMMIT_TIME_ORDERING'
)
PARTITIONED BY (city);

-- record index first; secondary indexes build on it
CREATE INDEX record_index ON hudi_table (uuid);
-- secondary index on a non-key, high-cardinality column
CREATE INDEX idx_rider ON hudi_table (rider);
Queries need no hints — equality predicates on indexed columns are pruned automatically during planning:
-- point lookup on the record key, served by the record-level index
SELECT * FROM hudi_table
WHERE uuid = 'c8abbe79-8d89-47ea-b4ce-4d224bae5bfa';

-- selective filter on a non-key column, served by the secondary index
SELECT * FROM hudi_table WHERE rider = 'rider-B';
Expression indexes cover predicates with inline transformations, and bloom-filter expression indexes handle equality matching where an exact mapping would be overkill:
-- date filters on an epoch column
CREATE INDEX idx_column_ts ON hudi_table
  USING column_stats(ts) OPTIONS(expr='from_unixtime', format='yyyy-MM-dd');

-- bloom-filter pruning for equality predicates on driver
CREATE INDEX idx_bloom_driver ON hudi_table
  USING bloom_filters(driver) OPTIONS(expr='identity');
What About Trino?
Honestly stated: index-based pruning through the record-level, secondary, and expression indexes is a Spark SQL capability today. When secondary indexes shipped in Hudi 1.0, support was planned for Flink, Presto, and Trino in a subsequent release; that work rides on the fact that the indexes are engine-neutral storage structures — partitions of the metadata table on disk, not Spark-private state — so an engine integration implements the lookup against index data that is already there.
What Trino supports today: Hudi tables are queried through the native Hudi connector (Trino 398 onward) or via the Hive connector with table redirection. Both paths support snapshot queries on Copy-on-Write tables and read-optimized queries on Merge-on-Read tables. So a Trino-fronted deployment gets Hudi's transactional reads and columnar scan performance now, and a practical pattern for selective workloads is to route the highly selective lookups through Spark SQL (where index acceleration is live) while Trino serves the scan-shaped dashboards and ad-hoc analytics.
What Published Results Show
Two data points, both from Hudi's own published material, both with setups disclosed:
- Record-level index: on a 400 GB synthetic Hudi table with 20,000 file groups, a query filtering on a single record key dropped from 977 seconds to 12 seconds — a 98% reduction — with the record index in use.
- Secondary index: on the TPC-DS 1 TB dataset (Hudi 1.0.1, Spark 3.5.5 on EMR, 10 executors), a join query with a customer-id lookup on
web_salesran ~33% faster on the first run and ~58% faster on a warm second run with a secondary index onws_ship_customer_sk. Data scanned fell ~90% — from 67 GB across 5,000 files to 7 GB across 521 files, and from 719M rows scanned to 75M.
How This Compares Architecturally
Lakehouse table formats broadly take one of two positions on selective reads. One position is file-statistics-only pruning: keep per-file min/max statistics (plus partition values) in table metadata, and make them effective by physically clustering data so that values correlate with files. This is metadata that is cheap to maintain and works well when queries filter on the clustering dimensions — but a table can only be clustered one way, and predicates on other high-cardinality columns degrade toward scanning the column across all files.
Hudi's position is queryable index metadata: spend additional storage and write-path work maintaining exact value-to-location mappings (record-level and secondary indexes) and auxiliary structures (bloom filters, expression indexes) in a scalable, transactionally-updated metadata table. The trade is explicit: index storage and maintenance cost in exchange for bounded lookup cost regardless of which column the predicate hits.
Operational Notes
Two things keep this practical in production. First, indexes are maintained transactionally with each commit. Second, adding an index to a table that is already ingesting does not require stopping it: Hudi's async indexing builds a new index in the background while writers keep committing, then reconciles the seam. Start with the record index for key lookups, add secondary indexes for the handful of non-key columns that appear in selective predicates, and use expression indexes where predicates transform columns inline.
Conclusion
Point lookups and selective filters on high-cardinality columns are a real, often dominant slice of production query traffic. Hudi's answer is the one databases settled on decades ago — indexes — rebuilt for lake storage as transactional partitions of a scalable metadata table: a record-level index for key equality, secondary indexes for non-key columns, expression indexes for transformed predicates, and centrally stored bloom filters, all consulted at query planning to shrink the scan to files that matter.
FAQ
Can you do point lookups on a data lake? Yes, with a table format that maintains indexes. On a plain columnar lake, a point lookup on a high-cardinality column degrades to scanning that column across all files. Apache Hudi maintains a record-level index mapping each record key to its file location and secondary indexes for non-key columns inside its metadata table.
What is a secondary index in Apache Hudi? A secondary index is an index on any column other than the record key. It stores mappings from secondary key values to record keys in the metadata table; at query time the matched record keys are resolved to file locations through the record-level index.
Does Trino use Hudi indexes? Not yet for record-level and secondary index pruning — that acceleration is available from Spark SQL today. Because Hudi's indexes are engine-neutral structures, engine integrations can adopt them, and support for Presto, Trino, and Flink was announced as planned.
How much faster are queries with Hudi's indexes? Per Hudi's published measurements: a record-key lookup on a 400 GB synthetic table with 20,000 file groups fell from 977 seconds to 12 seconds with the record-level index (a 98% reduction), and a TPC-DS 1 TB join query with a customer-id filter ran about 33-58% faster with a secondary index while scanning roughly 90% less data.
Does maintaining indexes for reads slow down ingestion? Indexes are updated transactionally with each commit, which adds bounded write-path work per index. Adding a new index to a live table does not require stopping ingestion: Hudi's async indexing service builds the index in the background.
Why AI Is a Storage Workload
Inference is evolving from a stateless compute task into a stateful storage workload, as caching KV context on flash is exponentially cheaper than recomputing tokens.
Deep dive
- Inference is no longer stateless; it builds a scratchpad (KV cache) during prefill.
- 70B-class models generate ~0.33MB of KV cache state per token.
- Cached input tokens are sold at 90-99% discounts by major AI vendors because they bypass recomputation.
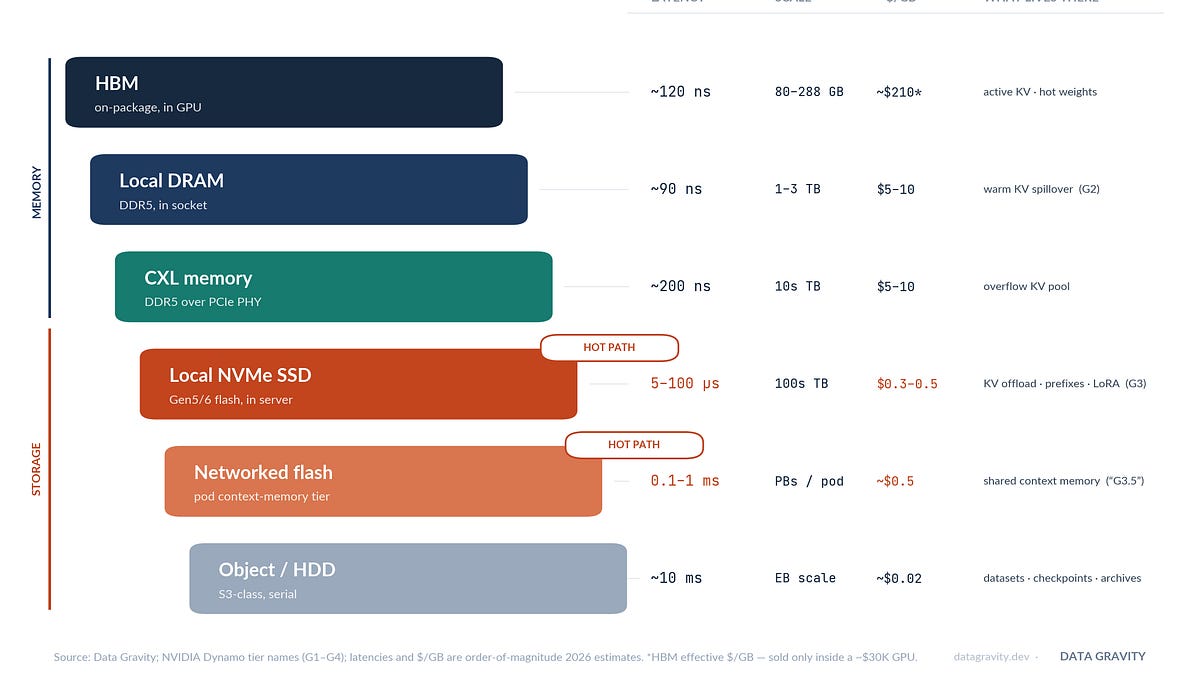
- Storage-tiering hierarchy now flows: HBM -> DRAM -> Local SSD -> Networked Storage.
- NAND flash demand is seeing record growth as inference services treat persistent context as an asset.
- NVMe drives and purpose-built flash tiers are replacing high-latency storage for prefill operations.
Decoder
- KV Cache: A cache of Key and Value tensors in Transformer models used to avoid recomputing previous tokens in a prompt sequence.
- Prefill: The initial phase of LLM inference where the entire prompt is ingested; it is compute-heavy.
- Decode: The phase of LLM inference where tokens are emitted one-by-one; it is memory-bandwidth heavy.
Original article
Why AI Is a Storage Workload
The GPU isn’t the bottleneck anymore — data movement is. Inference runs on accumulated state, and that state needs somewhere to live.
Thesis. The most expensive processor in the data center spends most of its time waiting for bytes. Yet the consensus AI-infrastructure stack has three headline layers — GPUs, networking, HBM — and treats storage as plumbing, because of one assumption: training is a storage workload, but inference is stateless. Tokens in, tokens out, nothing to keep. That assumption is now wrong. Stated precisely: inference is becoming a state-management problem — compute increasingly exists to transform state, and storage is where state persists. The clearest evidence is on the API price sheets: OpenAI, Anthropic, and Google sell cached input tokens at ~90% off; DeepSeek, which parks cached context on SSDs, at ~99% off. Those discounts exist because a stored byte of context replaces recomputation — every gigabyte of remembered context is compute you never have to buy. Long context, agents, RAG, and multimodal serving are manufacturing that state at extraordinary rates, and it lands on flash — which is why NAND, a $270B market growing ~281% year-over-year, is repricing faster than any memory cycle on record. The strategically interesting line in AI infrastructure is no longer just the network between GPUs. It is the boundary between memory and storage.
The Bottleneck Moved
Start with a fact that should be better known: during generation, a GPU is mostly not computing. Emitting one token means streaming every active model weight and the session’s entire KV cache out of memory — well over 100GB per step for a 70B-class model — and the arithmetic waits on the bytes. The imbalance is quantifiable: at batch size one, decode performs roughly 2 FLOPs for every byte it reads, while a modern accelerator is provisioned at ~300–600 FLOPs per byte of memory bandwidth — the math units are structurally >99% idle unless batching fills them, and batch size is capped by how much KV cache fits in memory. So memory capacity, not FLOPs, increasingly sets cost per token. The weights, meanwhile, are the most-moved bytes in the data center: consumed at full HBM bandwidth, a 140GB model is read end-to-end about 24 times per second — on the order of two million complete passes a day per serving instance. Penguin Solutions summarizes the resulting split: serving is roughly 30% compute, 70% memory. AI infrastructure has four layers — compute, memory, network, storage — and the last three are all versions of the same problem: how fast can you move bytes to the arithmetic? Training answered with HBM and NVLink, and the industry concluded the answer was permanent. But inference moves different bytes — context, weights, adapters, embeddings — and, critically, its bytes outlive the request. State that survives has to land somewhere, and each tier it can land on trades latency for capacity and cost. That is why inference optimization is turning into memory-hierarchy design rather than FLOPs procurement — and why the bottom of the hierarchy, storage, has stopped being a passive archive and become an active participant in serving.
The Blind Spot
Follow the dollars, not the discourse. Nearly all AI-memory coverage is about HBM — a market that even bullish forecasts sized around $55B for 2026, before this year’s repricing. NAND flash, which almost nobody covers, is a $270.6B market in 2026, heading for a projected $379B in 2027 (TrendForce, May 2026). For scale: the entire hard-drive industry books less revenue in a year (~$23B) than the top five NAND vendors now book in a single quarter ($38.9B). Storage stayed out of the AI narrative because the serving story said it could: if inference keeps nothing, storage is just where cold data goes to be cheap. The last eighteen months quietly falsified that premise.
Training Was Always a Storage Workload
The training side was never light on storage — it was just a batch problem. MLPerf’s checkpoint benchmark puts numbers on it: a 70B-parameter model writes a 912GB checkpoint; a 1T model, 15TB. Cadence scales with failure rate — Meta’s Llama 3 run logged 419 interruptions in 54 days on 16,000 GPUs, and at 100,000 accelerators the math implies a checkpoint every ~90 seconds, written in under five seconds: a ~3.6TB/s burst. DeepSeek open-sourced the machinery it built for exactly this — 3FS, a flash-native filesystem sustaining 6.6TiB/s of aggregate read. But checkpoints are periodic, sequential, and predictable: a solved class of problem. What changed in 2025–26 is the other side. Serving stopped being stateless.
Inference Was Supposed to Be Stateless
The state that broke the assumption is the KV cache. As a model reads your context, it builds a scratchpad of intermediate results — attention keys and values for every token — so that each new word only has to consult the notes, not reread the raw text. Throw the scratchpad away and the model must reprocess the entire conversation from scratch before it can say anything. That scratchpad is big: for a 70B-class model it runs ~0.33MB per token, so a 128K-token session carries ~42GB of state — on top of ~140GB of model weights. Four concurrent long sessions exceed the HBM of any GPU ever shipped. Concurrency multiplies it without limit: VAST Data’s arithmetic for a consumer-scale service puts 100,000 concurrent users at ~45PB of retained context — three orders of magnitude beyond what HBM and DRAM can hold. Solidigm’s framing is the right one: an inference service becomes memory-limited long before it becomes compute-limited.
And the KV cache is only the loudest entry in a growing inventory. Model weights are now hot storage objects — DeepSeek-V3 is 688GB on disk, and serving fleets shuffle them constantly. LoRA adapters, a few hundred megabytes each, get swapped per-request by the thousands. Agent memory persists between sessions by design. Each item is small next to a checkpoint; together, multiplied by users, they are the largest new data category in the data center.
Agents Make The Storage Problem Worse
Agents converted context from a per-request cost into a durable asset. The best public trace data comes from LMCache’s replay of 739 real Claude Code sessions: on average, a session’s context grows from ~20K to ~115K input tokens over an hour-long conversation — a 5.7x inflation, re-sent on every turn, of which 97% is reusable prefix. At 70B-class density, that one session is ~7GB of state at the start and ~38GB by the end. Now scale it: reasoning-and-tool-use models went from negligible to more than half of all tokens on OpenRouter during 2025, and Kioxia now calls agentic AI “the primary growth driver for NAND demand expansion.” A session that lives for an hour, pauses, and resumes tomorrow is not a cache-in-DRAM problem. It is a storage problem.
The Quieter State: Generated Media
Multimodal generation is compounding storage demand from the output side. Every generated video, image, and audio clip becomes a persistent asset the moment it exists — and Western Digital’s case work found each AI-generated video is stored at least seven times across platforms: the creation site, the creator’s copies, and every social network it’s posted to. WD’s summary is the structural point of this whole piece: storage demand is cumulative and persistent, unlike compute demand. That asymmetry is underpriced — compute demand can drop overnight on a single efficiency breakthrough; stored bytes never un-accumulate. A GPU finishes its job and moves on. The bytes stay.
The Market Already Prices State
Here is the mechanism in one sentence: reusing context the model has already seen normally means paying full compute to reread it — unless the scratchpad was saved, in which case you pay a disk read. The price sheets quantify the difference: cached input runs ~10% of fresh across OpenAI, Anthropic, and Google, and ~1% at DeepSeek, whose cache has lived on disk since 2024. The vendor benchmarks — all self-run, so treat the exact magnitudes loosely — point the same direction — WEKA reports 20x faster time-to-first-token at 128K context from flash-resident cache; Mooncake, the architecture behind Kimi, reported 75% more requests served on the same GPUs by pooling cache across DRAM and SSD. Storing a long prefix costs pennies per month; recomputing it costs the same dollars every single time. Once context is reused — and agents guarantee reuse — flash wins the arithmetic.
The Arithmetic of Remembering
Make it concrete. A 50,000-token prefix — a system prompt plus a codebase, or an agent’s accumulated working context — carries ~16.5GB of KV state on a 70B-class model. Rereading it costs ~$0.25 at prevailing fresh-input prices, every single time. Storing it costs ~$1.32 a month at ordinary cloud block-storage rates, and serving it back costs ~$0.025 per reuse at cached rates. The breakeven is six reuses a month. An agent reuses its context on every turn — it clears that bar within its first few minutes. At a thousand reuses a month, the choice is $250 of recompute against $26 total, of which the storage itself is $1.32. That asymmetry is why the discounts exist, why every serving stack now tiers to flash, and why “stateless” is ending: remembering costs an order of magnitude less than rethinking.
Where the State Lands
So does storage actually enter the inference hot path? Yes — through one door. An LLM answers in two phases: prefill (ingest the whole context — compute-heavy) and decode (emit tokens one at a time — memory-bandwidth-heavy). Decode stays welded to HBM and is not leaving. Prefill is the door, because a persistent KV cache makes most of it unnecessary — and NVIDIA has now formalized where that cache lives. Its Dynamo serving stack names the tiers like memory levels: G1 (HBM) → G2 (DRAM) → G3 (local SSD) → G4 (networked storage). At CES 2026 it went further, announcing BlueField-4-based “inference context memory” systems — a pod-level flash tier with a claimed 5x tokens per second, launched with a partner list that reads like the entire storage industry: DDN, Dell, HPE, IBM, Pure, VAST, WEKA and five others. The silicon is following: Kioxia’s GP1 series — built on its low-latency XL-FLASH media specifically for KV cache — samples this year at more than 10 million random-read IOPS, and Samsung’s PCIe Gen6 drive loads a 40GB model in 1.4 seconds. NVIDIA’s storage-certification program now defines a dedicated KV-cache I/O profile. When the GPU vendor starts speccing drive workloads, storage has stopped being plumbing.
The NAND Shock
The commodity market noticed before the narrative did. NAND contract prices rose ~55–60% quarter-over-quarter in Q1 2026 and another 70–75% in Q2 — records, against the low single digits of a normal cycle — and the top five enterprise-SSD vendors booked a record $18.5B quarter, up 86% sequentially, which TrendForce attributes explicitly to AI-agent services. The supply side cannot chase it: 2026 industry capex puts $61.3B into DRAM against just $22.2B into NAND, mostly process migration rather than new wafers. So buyers are locking the future instead — SanDisk holds $42B in contracted revenue, and Kioxia has roughly half of its 2028 output already committed. TrendForce doesn’t expect the tightness to clear before late 2027.
The strangest confirmation is the hard-drive market. Nearline HDDs — the default home of cold data — hit 52+ week lead times, with Western Digital sold out for all of calendar 2026. The shortage actually widened the price gap flash was supposed to be closing: a 30TB QLC SSD cost 4.9x the equivalent HDD in mid-2025 and 22.6x by Q1 2026. By classical storage economics, QLC demand should have stalled. Instead it had its best quarter ever — hyperscalers building AI pipelines couldn’t get HDDs at any price, and paid a 22x per-terabyte premium for density, power (~30% less), and availability. When buyers pay that premium on allocation, the workload has changed underneath the market.
The Stack: Who Builds What
The signature of a real category shift is that every layer ships a product for it within the same 18 months. At the media layer, all five NAND makers are racing to 122–245TB QLC drives and purpose-built AI SSDs. At the systems layer, VAST Data raised at $30B in April 2026 on the back of a $1.17B CoreWeave commitment; WEKA’s flash-resident KV cache went GA; DDN — the storage behind xAI’s Colossus — took $300M from Blackstone at $5B; Pure Storage rebranded to Everpure, won a Meta design for its 150–300TB flash modules, and shipped a KV-cache accelerator in June; and NetApp logged ~500 AI wins in one quarter, more than its entire prior fiscal year.
The cloud tells the same story: S3 alone holds 500+ trillion objects, and per IDC, all-flash arrays crossed half of enterprise storage revenue for the first time in Q1 2026. None of this is a stock pitch; it’s a census. When a dozen vendors ship the same new product category inside two years — and NVIDIA writes the reference architecture legitimizing it — the workload is telling you what it needs.
What Breaks the Thesis
Three real risks, in descending order. First, software keeps compressing the state: DeepSeek-style latent attention needs ~70KB per token against ~330KB for standard 70B-class attention, and KV quantization cuts another 2–4x. If compression outruns context growth, the spill to flash shrinks — though so far context and agent session lengths are growing faster than compression improves. Second, part of the NAND repricing is cyclical: BofA’s pre-melt-up forecast for 2026 NAND growth was +45%, not +281%, and the gap between those numbers is froth that can unwind — TrendForce already sees increases moderating to 10–15% in Q3. A 2027 normalization would deflate the headlines without touching the workload argument, but it would deflate them. Third, decode never touches flash — and if specialized prefill silicon (NVIDIA’s Rubin CPX pointed this direction) makes recomputing context trivially cheap, cached state loses value. Even that risk concedes the larger point, though: prefill economics now matter enough that NVIDIA designs separate silicon around them.
Summary
AI’s first infrastructure repricing was compute; the second was memory; the third is underway in storage, driven by a workload change rather than a shortage alone. Inference is stateful now — 42GB per long session, 5.7x context inflation per agent-hour, 45PB per hundred thousand users — and state that outlives a session must live on flash, because DRAM is too small, HDDs are unavailable, and the breakeven against recompute is roughly six reuses a month. The market has already internalized this in three places: the price sheets (90–99% cached-token discounts), the commodity (NAND up ~281% on record eSSD volumes and multi-year LTAs), and the stack (a KV-cache product from every serious storage vendor, with NVIDIA writing the reference architecture). For investors, the value sits at three tolls along the memory-storage boundary: whoever owns cache placement (NVIDIA and the systems software vendors), whoever supplies the flash it lands on (NAND makers, increasingly under long-term contract while capex stays disciplined), and whoever builds the silicon at the boundary itself (the new class of microsecond-latency AI SSDs). Instead of a watch list, here are three calls to hold me to. First: by end-2027, at least one major Western lab follows DeepSeek past a 95% cached-token discount — the arithmetic above says the economics already allow it. Second: by end-2027, every major cloud sells a named “context memory” tier the way it sells block storage today — NVIDIA’s G-tier taxonomy becomes product SKUs. Third: storage’s share of AI data-center spend roughly doubles by 2028, taken mostly from dollars that would have gone to HDD and cold tiers. If all three miss, the thesis was wrong.
Zoom out far enough and this is the oldest pattern in computing. Every wave — mainframes, databases, the web, cloud — eventually stopped being constrained by processing data and became constrained by moving it. AI looked like the exception because training really is compute-bound. Inference is the regression to the mean. This is the thesis this blog is named for: data has gravity. Compute is light and fungible; accumulated state is heavy and it stays put — compute exists to transform state, storage is state’s home, and silicon, networks, and price sheets all end up bending toward where it sits. Storage spent the first three years of the AI buildout as the boring layer. The state has arrived, and it needs somewhere to live.
How we tracked down a 16-year-old SQLite bug
Tailscale discovered and fixed a 16-year-old race condition in SQLite that caused silent data corruption when manual WAL checkpointing was used aggressively.
Deep dive
- Tailscale used SQLite with manual, aggressive checkpointing for S3 backups.
- Database corruption was identified via PRAGMA integrity_check.
- The team built a transaction logging pipeline to replay data as a recovery mechanism.
- The WAL-Reset bug occurs when a checkpoint operation incorrectly assumes pages have been written to the main database file during a concurrent write.
- The SQLite developers created a custom VFS (Virtual Filesystem) shim to trace the race condition.
- A secondary issue involving stale expression indexes surfaced after the initial fix, causing false corruption reports.
- Tailscale now monitors for specific overlaps between WAL resets and write transactions to prevent future regressions.
Decoder
- WAL (Write-Ahead Logging): A mechanism in databases to ensure integrity by logging changes to a separate file before applying them to the main database.
- Checkpointing: The process of moving pages from the WAL file into the main database file.
- VFS (Virtual Filesystem): An abstraction layer that allows SQLite to interface with different OS-specific file system implementations.
Original article
How we tracked down a 16-year-old SQLite bug
At the end of last year, our uptime was pretty shaky. You can see this trend on our status page, and that instability continued into the new year. Many of these outages were caused by a single bug, deep in SQLite. It took months of intense forensics to track it down.
Now we’re in summer, we’re confident that we’ve found the bug, that we understand it—and more importantly, that we’ve fixed it.
We know our customers expect Tailscale to be a reliable service, and for several months we didn’t live up to that promise. That’s disruptive, and we’re sorry. We’re publishing this blog post to explain what went wrong, how we responded, and how we ultimately helped to uncover a long-standing bug in the heart of the SQLite database.
Tailscale’s database architecture
While our clients interact with our control plane as a single public endpoint (controlplane.tailscale.com), internally, our control plane is split into a series of coordination servers (or “shards”). Each tailnet lives on one internal shard at a time, but can migrate seamlessly from one to another. These shards are an internal implementation detail: you don’t know what shard your tailnet is on, and you never need to.
Each shard has an SQLite database that holds all the information about the tailnets on that shard. A single Go process exclusively accesses that database, and serves the control plane for those tailnets. This single-writer design is exactly how SQLite is meant to be used.
We’ve used SQLite as our primary database since 2022, and we chose it because it's well-known, reliable, and widely used. SQLite is “boring technology”—in a good way. Many companies use SQLite in much larger deployments without issue, and we expected the same stress-free usage.
In our current backup pipeline, we take a complete snapshot of the database every few minutes, then upload the entire SQLite file to an S3 bucket. We’d been running this setup without incident since early 2023.
Fast forward to August last year, when a data pipeline that reads those S3 backups reported an error in one of our databases. We ran SQLite’s PRAGMA integrity_check command against the backup, and found it was indeed corrupted. SQLite corruption is possible, but it’s highly unusual and not something you should encounter in normal operation. We repaired the affected database, and investigated the cause, but to no avail.
When operating at scale, even rare events can occur with some frequency, so we should have been unsurprised when it happened again—and again, and again, and again. In total, we faced 19 separate instances of database corruption over six months before we finally resolved the underlying bug.
When you hear the phrase “database corruption”, it’s natural to worry about data loss. Because our control plane only handles configuration data, these databases contain metadata about your tailnet and devices, but never your private encryption keys or network traffic. In the earliest incidents, the recovery process meant a handful of newly added devices or configuration changes didn’t persist, and a small amount of metadata had to be re-entered.
Whenever corruption occurred, we had to stop the control plane process on the shard while we repaired or restored the database. This was painful for tailnets on that shard, because their entire control plane disappeared during that recovery window. In the early incidents, that downtime was over an hour, but we gradually sped up the recovery process over subsequent incidents.
Each tailnet is a mesh network, where devices make peer-to-peer WireGuard® connections to each other. When a device joins the tailnet, it has to get a list of other devices from the control plane before it can establish new connections—so if a device came online during the SQLite downtime, it couldn’t connect. While the database was being repaired, devices already online remained connected to each other, but they couldn’t learn about changes to the network. Those tailnets also temporarily lost access to the web-based admin console and the Tailscale API.
There’s also a broader impact on trust. We post a global incident on our status page even when only a small number of tailnets are affected. Many people saw a status page event for an incident that didn’t affect them. Indeed, the majority of shards and tailnets were never involved in a database corruption incident! Nonetheless, repeated downtime erodes trust, whether or not you’re directly affected.
From the very first instance of corruption, we knew this was a serious threat to our reliability, and we threw a lot of engineering time at the problem—but the fix wasn’t easy.
Trying to find the fault
This bug resisted all our initial attempts to find it.
We looked at recent changes, but there weren’t any that seemed relevant. Nobody had been working on our low-level code that interacts with SQLite, because it had all been written years ago and presented no issues up until that point. We re-reviewed all of that code with a fine-toothed comb to look for previously missed bugs, but we didn’t find anything that would cause the corruption we were seeing.
We looked for common factors between corruption incidents, but we couldn’t find any. It wasn’t tied to a single shard, or customer, or tailnet feature, or time of day, or load level. We were at a loss for what might be triggering the behaviour.
This lack of reliable trigger conditions meant we couldn’t reproduce the bug synthetically. Instead, we had to rely on deploying passive, forensic telemetry in our live environment to catch the corruption red-handed. Gathering live diagnostics for a database issue is the last thing we wanted to do, but we had no choice.
As an additional complication, the corruption didn’t occur on a regular schedule. Sometimes incidents would be hours apart, other times weeks. This made it difficult to predict progress or plan further work, because we were never sure when we’d get our next diagnostic dump. We had a six-week period between October and December when there were no corruption incidents, before they returned as an unwelcome Christmas present.
Because this wouldn’t be a quick or easy fix, we reached out to the SQLite developers for a professional support contract. This was a great decision. It gave us direct access to their deep expertise and experience, and we had many detailed technical conversations about our architecture and our incidents.
Between Tailscale engineering and the SQLite core developers, we mapped out several theories for what might be causing the corruption—including broken POSIX locks on close(), mismanaging memory owned by SQLite, or accidentally using SQLite from multiple threads while disabling thread safety. After every incident, we gathered more data, added more diagnostics, and systematically ruled out these theories. We were gradually converging on the true bug.
The transactions that didn’t bark
While we were investigating the root cause, we still had a live platform to run. We took aggressive steps to automate recovery and minimize downtime:
- Configuring our control plane shards to hard-stop immediately upon encountering corruption
- Deploying an automated backup monitor that continuously ran
PRAGMA integrity_checkover our backups - Improving our runbooks and on-call training
These efforts cut our response time to under an hour—and then we discovered an unexpected clue.
We wanted a way to restore service that didn’t involve rolling back to the last known-good backup (which would lose a lot of data) or repairing the known-corrupted database (which was potentially risky).
To do this, we built a transaction logging pipeline. We streamed every SQL statement that modified the database to a separate log file. Because SQLite is a single-writer database with serialisable transactions, our transaction history was completely linear and deterministic. (This wouldn’t be true in a multi-writer database like Postgres or MySQL.) Replaying those transactions against the latest known-good backup should restore the database to its most recent state, safely bypassing the corruption.
This pipeline worked, but then it did something even better: it gave us a clue.
In two incidents, our transaction logs failed to replay cleanly. Upon closer inspection, we discovered that data written and committed by one transaction was inexplicably invisible to later transactions. A write had vanished into thin air without raising an error. That should be impossible!
The writing on the WAL
As these incidents were ongoing, the SQLite developers had been developing a new debugging tool. For a while, we’d suspected that the bug was somewhere in the checkpoint process. They were building a new tool to give better visibility into what was happening during checkpoints.
To understand what this tool found, we need to briefly explain how SQLite checkpoints work.
A SQLite database is made of a series of “pages”, tiny blocks of information. When you update the database, some of those pages need to be replaced with new pages with the updated information.
For better performance and greater concurrency, we run SQLite with Write-Ahead Logging, which means new pages aren't written directly to the database file. Instead, they’re written to the "write-ahead log" or "WAL file".
New pages can't be written to the WAL file indefinitely; at some point they have to be copied back to the main database file. This process is called “checkpointing”.
In most deployments, SQLite itself decides when to do a checkpoint, and the process is invisible to the end user and developer. In our control plane, we take manual control of the checkpoint process so we can run fast and consistent backups. This non-standard approach seemed suspicious as we steadily eliminated potential causes.
One clue was that during corruption incidents, our metrics showed that SQLite would report copying more pages from the WAL file than were actually available. If there are 10 pages in the WAL file and 20 pages get copied to the database, something is clearly wrong.
To understand what was happening during these faulty checkpoints, the SQLite developers created a new debugging tool for the virtual filesystem layer.
SQLite is split into several layers. The top layer is the parser and code generator, which converts SQL statements into SQLite’s internal data structures. These data structures get passed to the pager, which splits them into the individual pages to be written to disk. Actually writing them to disk is handled by the OS interface, or “virtual filesystem”. Currently SQLite has two mainstream virtual filesystem implementations—Unix and Windows.
This approach allows you to replace different layers with different implementations, or wrap an existing layer to get more information. To help diagnose our problem, the SQLite developers created a wrapper around the virtual filesystem that writes additional tracing information and logs about changes to the database. This wrapper is called the tmstmpvfs shim.
We deployed the shim into our live environment, and waited for the next corruption to occur. Fortunately, we didn't have to wait long.
The WAL-Reset bug
After our next corruption incident, the additional logs from the new tmstmpvfs shim allowed the SQLite developers to find and fix the bug: a rare data race in the SQLite source code between a checkpoint and a write transaction.
In particular, if a write occurs at a specific time during a checkpoint, the checkpointing process gets confused—it thinks some of the pages have been copied from the WAL into the main database file, but they haven’t. Those pages never get written to the database file, and that data is permanently lost. The database file becomes corrupt, because other pages which reference those pages—such as an index—are written to the database.
The SQLite developers named this the “WAL-Reset bug”, and they estimate it was present in SQLite for at least 16 years. It could exist that long because it was rare—so rare, the SQLite developers had to add code to deliberately trigger it in their testing environments. Their fix adds an additional check to the checkpointing function which detects when the WAL has been reset by another thread.
They confirmed that this bug caused all of the baffling behaviour we’d seen. It explained the corruption, the transaction logs that wouldn’t apply cleanly, and the inconsistent checkpoint statistics. They also explained why we were more likely to hit the bug than other SQLite users: we take manual control of the checkpointing process, and we checkpoint very aggressively. Even a bug triggered by a rare condition was bound to hit us eventually.
This was an exciting moment. After months of confusion and uncertainty, we finally had a plausible theory for why the corruption was occurring, and a fix we could deploy to prevent it.
The SQLite developers released the fix as SQLite 3.52.0, and we prepared to deploy it as soon as it was available.
Fixed, with a false alarm
We rolled out SQLite 3.52.0 carefully—first to a few canary shards, then, when we saw it running smoothly, we deployed it to the rest of the control plane.
Our backup monitor promptly turned red, and reported corruption in 13 different databases. This was extremely alarming, but we followed our recovery procedures to fix all the supposed corruption, and everything was happy. It turned out these databases had not suffered real corruption, but were subject to a second problem in the version of SQLite.
We shared our errors with the SQLite developers, which uncovered a bug in SQLite related to stale expression indexes. If you create an index on a computed value, and then the computation changes, the index will contain mismatched values, which gets reported as corruption by PRAGMA integrity_check.
In our case, we were storing some high-precision timestamps as text, converting them to a floating-point number in a VIRTUAL generated column, and the SQLite 3.52.0 release that fixed our data race also made an optimisation that subtly changed the rounding behaviour for text-to-floating-point conversions. Our canary shards didn’t have any timestamps that triggered the changed rounding behaviour, so we missed this in our phased rollout.
Because this change caused false corruption warnings, the SQLite developers withdrew the 3.52.0 release and instead published 3.51.3, which only contained a fix for the WAL-Reset bug.
We fixed the issue on our side by reducing the precision of our timestamps to integer seconds; text-to-integer conversions are unambiguous. Meanwhile, the SQLite developers created an automated, self-healing index feature in 3.53.0, which prevents the stale expression index problem.
Party time!
With the fix rolled out to our entire control plane, we were ready to declare victory, but we were still cautious. An absence of corruption incidents doesn’t mean things are fixed—we’d already had one six-week period of deceptive calm.
We wanted positive proof that this data race was actively occurring in our production environment. Now that we understood the cause of the bug—a collision between a write transaction and a WAL-reset—we patched our SQLite driver to log a warning when these two operations overlap. If the warning fired but the database remained uncorrupted, we’d know the fix had saved us from a potential corruption incident.
We deployed the warning, and we waited. And we waited. And we waited. And we waited. As weeks slipped by, we began to wonder why we didn’t see it. Was the warning broken? Was our theory wrong? Was the true bug still lurking in the darkness?
Then, two months later, the alert we were waiting for finally fired:
This alert proved that the precise conditions for the WAL-Reset bug do occur in our production environment, which means it was the likely culprit for our six months of shaky uptime.
Since that weirdly joyous alert fired, we’ve run for another four months without any database incidents, as of this writing. Finally, we could breathe a sigh of relief.
Off the well-trodden path
Nobody wanted us to spend six months looking for bugs in SQLite. This was an immensely frustrating experience for both our customers and staff, and we’re all glad to put this instability behind us.
This investigation is a useful reminder: running boring technology in a non-standard way is a risk. The common paths and standard configurations are incredibly well-tested and reliable. Most people use SQLite in a standard configuration and never face this sort of issue. Everything we were doing was a public, documented, supported configuration—but by taking manual control of the checkpointing process and running at our own aggressive pace, we stepped off the well-trodden operational path.
Resolving these incidents was a massive, cross-functional effort involving dozens of people—including Tailscale's engineering and support teams, and the core maintainers of SQLite. It is to all of their credit that the impact of these incidents was not much worse.
We know that repeated downtime erodes trust, no matter how many people are affected, and we’re grateful to our customers for their patience and support while we chased this down.
Frustrating as this period was, we’re left in a stronger position than we were before. The long-standing bug in SQLite has been patched, and we fixed dozens of other incidental issues that we spotted while looking for it. We funded the open-source SQLite VFS shim that helped isolate the race condition almost immediately, and will help track down similar bugs in the future. Finally, we’ve refined our database backup and recovery processes, and live-tested them over a dozen times.
Hopefully there won’t be another database incident like this—but if there is, we’ll be ready.

Adobe's AI Collaborators Turn Outside AI Agents Into Governed Workfront Teammates
Adobe's Workfront AI Collaborators now allow enterprises to integrate third-party agents from Claude, Microsoft Copilot, and Writer as governed, permissioned team members.
Deep dive
- Task Delegation: AI Collaborators function as permissioned Workfront users, removing the need for manual file transfers and redundant prompting.
- Integration Architecture: Uses MCP (Model Context Protocol), public APIs, or agent-to-agent connections to provide project context.
- Governance: Includes audit trails and mandatory human-in-the-loop approval processes.
- Available Types: Task agents and compliance reviewers are live; a project coordinator agent is arriving soon.
- Ecosystem Scope: Workfront MCP allows project data to be piped directly into external models like Gemini or ChatGPT.
Decoder
- MCP (Model Context Protocol): An open-source standard enabling AI assistants to connect with external data sources and tools securely.
- Human-in-the-loop (HITL): A system design where a human must review or approve AI-generated output before it is finalized or executed.
Original article
At the Adobe Summit last April, the company announced the Workflow Optimization Agent designed to automate “intelligent, connected actions” across workflows. Four months later, the agent—since rebranded as AI Collaborator—is now generally available. Through Adobe Workfront, the company’s work management application, users can delegate work to these virtual teammates similarly to how they might with their human colleagues.
This doesn’t appear to be your standard agent. Rather, AI Collaborators is more like a governed harness—the controlled connection between Workfront and agents from Microsoft Copilot Studio, Anthropic’s Claude, and Writer. When assigned work, they behave as permissioned users in Workfront, packaging all the necessary project information agents need. The connected agent then follows through before delivering results back to Workfront for review and approval.
The same results could likely be achieved without using AI Collaborators, though it would require more effort. Previously, users would identify the task and the project it belongs to. Then, they’d have to download the pertinent document and files, going through multiple sources such as SharePoint, local drives, and/or cloud storage. From there, they’d go to the AI agent and generate a prompt that includes instructions and anything else needed to give it project context. The agent executes the task and returns a deliverable, only for multiple back-and-forths to follow. Finally, an approved draft is generated and shared in Workfront.
This process is streamlined with AI Collaborators. Users start by creating an AI Collaborator they want in Workfront, with three types to choose from: a task agent, a reviewer that checks documents against brand guidelines for compliance, and a project coordinator that tracks project progress and keeps stakeholders informed. The first two are available now, with the third coming soon. Next, the user describes what it does and identifies the agent that should do the work, using either an MCP, public API, or agent-to-agent connection. When it’s time for a task, there’s no prompting needed. The user assigns the AI Collaborator a task, and Workfront provides it with the work description, brief, brand voice, and messaging rules—the user doesn’t have to do any curating.
Some AI Collaborators that an organization may have include a social media manager that turns briefs into published social posts; a content variation generator that generates channel-specific versions of hero images; a campaign strategist that plans seasonal gear launches; an SEO specialist that optimizes product pages to rank; an email marketer; a market researcher; and a performance analyst.
A marketing executive who wants to update copy on the company’s website could, for example, assign the work to the AI Collaborator, which is already connected to a copywriting agent built in Microsoft Copilot Studio. The AI Collaborator returns an on-brand draft that the team’s copywriter refines and approves—their time spent on craft and judgment, not setup.
In Adobe’s case, its global marketing team is using AI Collaborators to generate channel-specific image renditions as soon as key assets are available, draft pages within Adobe Experience Manager, and handle event-promotion handoffs across teams.
Handing work to AI sight-unseen may concern some people, but Adobe said its new feature has permissioning, audit trails, and human-in-the-loop approvals baked in at the beginning. The company claimed this structure is what will help enterprise users start to see value from AI agents. AI Collaborator compresses the loop without sacrificing judgment. With improved productivity and a repeatable process that generates quality results, companies may now have a tool to bring order to the chaos of agent sprawl.
But that’s not all: in addition to announcing AI Collaborators, Adobe has launched Workfront MCP. With it, users can bring project information from Workfront into Claude, Microsoft Copilot, Gemini, ChatGPT, or any AI tool they use.
Both AI Collaborators and the Workfront MCP are available today.

Vibe Coded Apps are the New Shadow IT
Engineers using AI agents to 'vibe code' internal tools are bypassing security reviews and creating new, hard-to-detect infrastructure risks.
Deep dive
- The Problem: AI allows developers to stand up infrastructure in minutes without security involvement.
- Platform Controls: Hardcode secrets manager requirements and VPN-gate deployment targets at the account level.
- Process Controls: Require a human peer with security context to review any infrastructure-changing code.
- Detection: Look for IAM role creation and API calls originating from local developer machines rather than central CI/CD pipelines.
Decoder
- Vibe coding: Writing code by providing natural language prompts to an AI agent, often ignoring traditional architectural rigor.
- CSPM (Cloud Security Posture Management): Tools like Wiz that automatically scan cloud environments for misconfigurations and security risks.
- IAM Role: A set of permissions in AWS that defines what an entity can access.
Original article
Your engineers can now provision cloud infrastructure faster than your review process was built to catch it, and the code doesn't look any different from what a legitimate deploy would produce.
Shadow IT used to be a SaaS problem. Someone on the marketing team signed up for a tool, connected it to Google Workspace, and your first signal was an OAuth grant you didn't authorize. Annoying. Detectable. Containable.
The new shadow IT doesn't show up in your OAuth logs. It shows up as infrastructure, running in your cloud account, built by a well meaning engineer who asked an AI agent to stand it up in an afternoon. No ticket, no review, no security team involvement. Just someone with a good idea and a tool that removed all the friction that used to slow them down.
That friction wasn't just inefficiency. Some of it was doing real security work.
The problem with good intent
Classic shadow IT had a whiff of someone knowingly going around IT. A team that didn't want to wait for procurement. The security story was at least partially about policy enforcement.
That's not what this is.
The engineer who vibe codes an internal tool for their team isn't trying to circumvent anything, they're trying to help. They have access to an AI agent that can write code, generate Pulumi, and stand up infrastructure faster than any review process was designed to handle. And unless they've spent time thinking about cloud security, they have no reason to know that what they just shipped is a problem.
That's what makes this harder: you can't enforce your way out of it, you have to get ahead of it quickly.
Here's what the bad day looks like: an engineer builds a lightweight internal app to automate something their team does manually. They ask the AI agent to handle the infrastructure. The agent provisions resources in the team's AWS account, opens the necessary ports, and deploys the app. It works and the team absolutely loves it. Nobody files a ticket because there's nothing to file. Six weeks later your CSPM flags a public-facing endpoint with an overpermissioned IAM role attached to it. By then the app has been running in production long enough that lateral movement is a realistic scenario, not a theoretical one.
The intent was good. The outcome has a blast radius.
Why this is different from SaaS sprawl
When shadow IT meant unauthorized SaaS, your detection surface was defined. OAuth grants, network traffic, expense reports, SSO anomalies. The tool existed outside your infrastructure. It was external. You could find it, you could cut it off, and the damage was usually bounded.
Agent-built internal tooling lives inside your infrastructure. It has IAM roles. It may have direct access to production data, internal APIs, or sensitive systems. It looks legitimate because it was built by a legitimate employee using legitimate tooling. There's no obvious seam to detect at. The code doesn't announce itself as ungoverned. It just runs.
This is the shift worth naming clearly: we've moved from SaaS sprawl to code sprawl. The detection playbook for one doesn't translate to the other.
A baseline worth actually using
The goal here isn't to slow engineers down. It's to make the safe path the easy path. The baseline we're building toward at Webflow has two layers, and that distinction matters.
Platform controls are things you configure once at the org or account level that make it structurally harder to do the wrong thing by accident.
IAM least privilege guardrails. The permissions available to team-level AWS accounts should be scoped by default. An engineer shouldn't be able to provision a public-facing resource with a broadly permissioned role without hitting a guardrail. The guardrail doesn't stop the work. It stops the worst version of the work from shipping silently.
Secrets manager enforcement. Hardcoded credentials in vibe-coded apps are not a hypothetical. They're a near-certainty if you don't make the right path obvious. Enforcing secrets manager usage at the infrastructure level removes the decision from the individual engineer entirely.
VPN-gated deployment targets. Internal tooling should land behind your corporate VPN by default. If something genuinely needs to be public-facing, that should require an explicit decision, not an accidental default.
Process controls are what has to happen at the tool level before anything ships.
Automated baseline check. Before a security-informed human looks at anything, run the code and the infrastructure configuration against your baseline automatically. Flag violations, tier them by severity, and give the engineer specific remediation guidance. This is the layer a Claude skill or similar tooling can own. The human review then focuses on what the automated check surfaced rather than starting from scratch.
Security-informed code review with Security escalation. Every internally built tool that touches production infrastructure needs a human with security context to look at it before it ships. For lower-risk tooling, that's a peer engineer who understands the blast radius of what they're reviewing. For anything with cloud infrastructure, direct data access, or novel IAM roles, it escalates to a formal Security review. Same control, tiered by risk. The key point: the reviewer needs to actually understand the code. With vibe-coded tools, the author may not fully understand what they built. That makes the review more important, not a formality. It's not just a quality gate. It's a comprehension gate.
The safety net
The baseline is preventive. Detection is what catches what slips through.
Your CSPM is the right tool for finding misconfigurations in what already exists. Wiz and tools like it will surface the public-facing endpoint, the overpermissioned role, the storage bucket without appropriate access controls.
But CSPM only finds what's already deployed. The baseline and the review process are what you're counting on to prevent that. Detection is the catch layer, not the first line.
The harder detection problem is knowing something exists in the first place. A vibe-coded tool running locally or in a team account may leave no trace in your normal visibility layer. No deployment pipeline. No change ticket. No asset inventory entry.
This is where behavioral signals in your cloud telemetry start to matter. IAM role creation outside your normal pipeline activity. New public-facing resources appearing without a corresponding change record. API calls originating from developer machines directly into production accounts rather than through your standard tooling. None of these signals are definitive on their own. In combination, they start to look like something that deserves a closer look.
Most teams aren't looking for these signals specifically in the context of agent-built tooling. That's the gap worth closing.
The codified baseline
Documentation that lives in a wiki is a baseline nobody uses at the moment they need it. The better path is making the baseline available inside the tools engineers are already using, at the point of building.
A Claude skill or similar AI-native tooling that reviews architecture descriptions or generated infrastructure against your specific security baseline is more useful than a checklist in Confluence. The engineer gets specific, actionable feedback before a human reviewer ever sees it. The security team gets a first pass that's already been filtered for the obvious failures. The review is better because it starts from a more complete picture.
None of this works if engineers don't know the skill or the review process exists. Awareness is its own prevention layer. Introducing both during onboarding is what makes the safe path visible, and letting the skill's feedback do double duty as education about why each check matters is what makes it stick. A guardrail that doesn't announce itself isn't preventive.
That's where we're headed internally. The blog post is the argument for why this matters. The skill is what operationalizes it.
The takeaway
Vibe-coded internal tools are not going away. The friction that used to slow down ungoverned infrastructure is gone, and it's not coming back. The question is whether your security baseline catches up before your CSPM does.
Platform controls make the safe path the default. Process controls make sure a human with security context sees everything before it ships. Detection gives you a catch layer for what slips through anyway.
None of this requires a dedicated AppSec team or a SOC. It requires a clear baseline, the tooling to enforce it, and engineers who understand what they're reviewing. That's a problem a small, well-structured security team can solve. Platform controls are owned at the org or SecEng level, set once and applied everywhere. Process controls are distributed: a peer engineer with security context handles lower-risk tooling, while anything touching cloud infrastructure, direct data access, or novel IAM escalates to a formal Security review. That's distributed responsibility with a clear escalation path, not a single team reviewing everything.
Build the baseline before the CSPM finds it for you.
GLM-5.3: Frontier Coding with Emergent Cyber Capabilities
Z.ai released GLM-5.3, a model that relies exclusively on extensive post-training scaling to achieve significant gains in coding and long-horizon tasks.
Original article
Z.ai has released GLM-5.3. The only improvement on the model is the amount of post-training performed. Z.ai continued scaling on its stack with more environments, more diverse tasks, and more compute, resulting in a model that is much better at complex coding and long-horizon tasks. Every gain comes from post-training.

Cursor is now a part of SpaceX
SpaceX has completed its acquisition of coding assistant Cursor, granting the AI developer access to a massive proprietary GPU fleet for future model training.
Original article
Cursor has officially been acquired by SpaceX. This completes the acquisition process that started in April, when we announced our partnership with SpaceXAI to accelerate our model training efforts.
In the years since we started Cursor, better models have steadily expanded what people can build. Cursor has gone from completing the next few lines of code to building AI teammates that you can give real work to.
Together with SpaceX, we will push that ambition further. We will have access to the largest fleet of GPUs in the world, giving us the compute to build stronger models that are also more economical to run.
This means we can provide customers with more capable models at lower cost. Grok 4.6, which we released Wednesday, provides an early look at what we can now build together. SpaceX is building the computing capacity needed to scale intelligence far beyond what exists today. Cursor will be one place where that intelligence becomes useful.
For us, that opens a much larger horizon than the one we started with, while keeping the work familiar. We still want to help people with ambitious ideas spend less time writing code and more time solving harder problems.
Nvidia Downsizes Plans for $250 Billion Guarantee of OpenAI Data Center
Nvidia reduced its financial guarantee for a new OpenAI data center project from $250 billion to $120 billion due to investor concerns over market exposure.
Original article
Nvidia and OpenAI are close to closing a financial deal for a large-scale data-center campus in Ohio. Under the deal, Nvidia would provide a financial backstop for the first phase of the project, totaling roughly five gigawatts of power. OpenAI will then have to decide later whether or how to finance the remainder. Nvidia originally planned to invest $250 billion into the deal, but lowered its guarantee to less than $120 billion to address investors' concerns about the chipmaker's risk exposure.
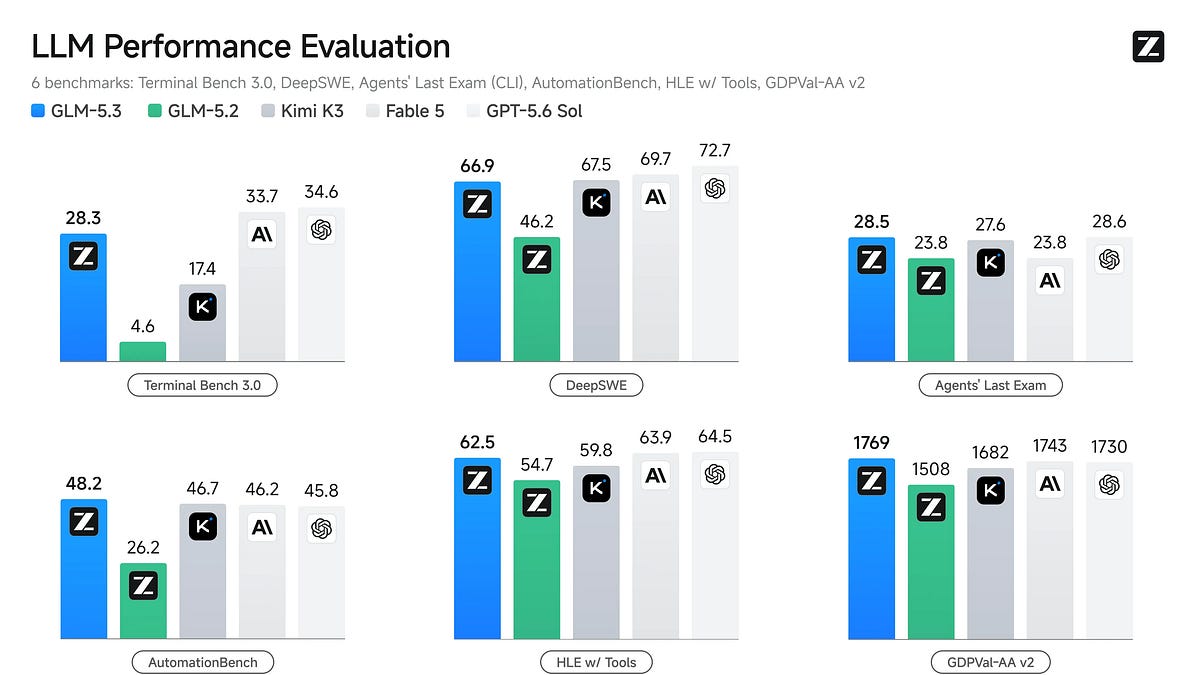
GLM-5.3: How Chinese labs keep stride with the frontier
Z.ai’s GLM-5.3 release demonstrates how Chinese labs maintain competitive parity by prioritizing fast release cycles and aggressive RL-focused post-training over slow, cautious deployment strategies.
Deep dive
- Release Velocity: Z.ai's cycle is measured in days, unlike the months-long pre-release testing at OpenAI or Anthropic.
- RL Focus: The model relies on RL (Reinforcement Learning) environments, which the lab has scaled extensively.
- Capability Diffusion: Cybersecurity features like exploit analysis in GLM-5.3 highlight the dual-use risks and the difficulty of preventing high-level capabilities from leaking.
- Data Sourcing: Evidence suggests Chinese labs are acquiring RL training data environments similar to those used by Western labs.
- Benchmark Strategy: Labs are increasingly purchasing or curating data to optimize performance on specific, high-visibility benchmarks.
Decoder
- RL (Reinforcement Learning): A training technique where the model learns by receiving rewards or penalties based on its output, used heavily to optimize models for specific coding or reasoning tasks.
- Hillclimbing: An iterative process of making incremental improvements to a model to achieve higher scores on performance metrics.
- Benchmaxxing: The practice of hyper-optimizing a model to excel on public benchmarks, sometimes at the expense of general-purpose usability.
Original article
GLM-5.3: How Chinese labs keep stride with the frontier
Today, Z.ai announced their GLM-5.3 model, currently only available in the coding plan, coming soon to their API and in two weeks’ time to Hugging Face (open weights). This model looks exceptional, with a somewhat astounding increase in scores. On many benchmarks the model has surpassed Moonshot AI’s Kimi K3 and on some it’s surpassed Claude Fable 5 or GPT-5.6-Sol.
This puts the model more or less at the frontier of agentic coding benchmarks, with only ~750B parameters – a third of Kimi K3! The Z.ai blog post is rather straightforward, and starts with a bold sentence:
Scaling post-training is all we did for GLM-5.3.
GLM-5.3 is the same base model as GLM-5.2 with substantially extended post-training. To risk a broad oversimplification, Z.ai seems to have a strength in post-training when compared to Kimi, which is more of a pretraining masterpiece. Following this release there have been a lot of discussions wondering how China can keep up so well? How can such a small model be matching the leading public American models? Are these results real?
The simplest explanation is that Z.ai is very good at what they do – it’s worth recalling that they’ve been working on this line of models longer than almost anyone in the industry. Here’s a brief history of the GLM models.
- Zhipu AI Founded – 2019
- GLM (General Language Model) — March 2021 — released by THUDM, Tsinghua University’s Data Mining / Knowledge Engineering group.
- GLM-130B — August 2022 — Scaled version.
- ChatGLM — March 14, 2023 — first chat version.
- ChatGLM2 — June 25, 2023
- ChatGLM3 — October 27, 2023
- GLM-4 — January 16, 2024 — rebranded as just GLM; open-weight GLM-4-9B followed in June.
- GLM-5 — February 11, 2026 — latest major generation.
GLM 5.2, released on June 22 of this year, was a big deal – weeks after the release, I regularly heard from AI researchers I know who still used the model due to its speed (some deploy the model on internal clusters for faster speeds than public offerings) and simplicity (as a model with no rollbacks, etc., when working on frontier AI systems). GLM-5.2 altogether stood up to the hype.
I’ve been going through some of the same denial myself, thinking “how do they keep doing this? Surely the models aren’t as good as they look.” There’s something a bit off-putting with how the American companies have such a commanding resource lead, but can’t seem to pull away in capabilities. The common answer is distillation, which I’ve written at length about, but I deem not to be the major factor. On that note, there was a recent paper that showed simple methods for extracting the reasoning traces from frontier models – this is the sort of thing that Chinese labs could definitely use at scale. I’m confused why the labs in the U.S. haven’t patched this behavior faster; instead they’re running to the government asking for policy help. It doesn’t add up for me.
Z.ai’s blog is direct and matches with an RL-dominated training regime. They say they used “more environments, more diverse tasks, and more compute spent training on them.” One does not simply “distill” RL environments, infrastructure to run them at scale, or algorithms to mix them together effectively.
So, how do the Chinese labs do it if not distillation? Are they benchmaxxing? An accepted definition of benchmaxxing is focusing the model on the test sets, such that the real-world performance meaningfully differs from the on-paper scores. The determining factors are much more big picture than technical:
- The time to release for Z.ai is likely days, not months as with OpenAI or Anthropic. It is very, very likely that OpenAI and Anthropic have far better internal models than Z.ai and Moonshot AI. Still, these American companies tend to take months to release their models to the public, which massively flatters the Chinese labs in adoption decisions at the frontier. To put it simply – the Chinese labs use all the time that American labs do pre-release testing to keep hillclimbing on benchmarks (SpaceXAI is likely far closer to the Chinese labs here). With the pace of progress being so fast, this is likely the largest determining factor of why Chinese labs stay at the frontier. This, so far, has been economically acceptable for the American labs, as they’ve still had massive demand for their models.
- Yes, Z.ai probably cares slightly more about public benchmarks than OpenAI or Anthropic. These benchmarks, e.g. scoring highly on the Artificial Analysis Intelligence Index, or similar aggregators, have a very direct impact on their stock price. They in many ways need to do this to keep raising capital and maintain team morale, as being the scrappy underdog matching American giants is a wonderful story. Subtle benchmaxxing does not need to come out of desperation or any similar pressures. It’s the industry standard across a remarkable number of labs.
- Z.ai is not benchmaxxing to the point where GLM-5.3 is fried (at least not intentionally, and they’ll check for it). Every lab is dealing with the rough edges of scaling RL right now. Anthropic’s Opus 5 and Sonnet 5 models have very mixed reputations, despite the incredible benchmark scores. Everyone in the industry is in the same boat, so some model weights end up being easier to use than others, but the benchmark scores in their release blogs are the real deal.
- GLM-5.3 is likely a narrower model than Claude Fable or GPT Sol. When GPT-5.2 was released, it had mixed reviews outside of agentic coding. At the same time, OpenAI and Anthropic support very large businesses with countless use-cases for their models. This is a benefit of being a company earlier in their adoption curve – you can target the most valuable use-cases. Within post-training, caring about a bit less will make assembling the final model far easier.
- The RL data industry is taking off in China. Many sources and rumor-mills we’re following have been mentioning how the data industry is taking off in China — very much driven by American data companies selling to Chinese model labs. This could look like Chinese labs buying many of the same RL environments that are used by American frontier labs, and releasing the downstream RL’d model sooner. We still have large error bars on the scale and impact of this market, but it is certainly becoming important.
- Z.ai is an extremely skilled LLM organization – one that is likely far more compute efficient than OpenAI / Anthropic. This needs repeating. These folks are very good at what they do. The company has very close ties to Tsinghua University, which is home to many of the best Chinese computer scientists. This abundant, eager talent pool is as central to their success as it is for any Western counterpart.
Altogether, it seems like a perfectly good strategy they’re executing with the GLM line of models. Congrats on the release! I’m excited for the weights to be out so I can do more extended testing.
This is another step towards the inevitable proliferation of very strong cyber capabilities across the economy. Z.ai has acknowledged this, saying:
GLM-5.3 is our most capable model to date for cybersecurity tasks. It delivers substantial improvements in vulnerability discovery, exploit analysis, and complex multistep security tasks. These capabilities can help defenders identify weaknesses earlier, validate risks, and accelerate remediation.
They also create clear dual-use risks. We are therefore taking a staged approach to release. Selected security partners will first evaluate GLM-5.3 in controlled settings. Broader access and API availability will follow. Once the necessary safety evaluations and release preparations are complete, we will publish GLM-5.3’s complete model weights.
They go on to acknowledge how they’re monitoring inference on their platforms via a request classifier and chain of thought monitoring (on top of model alignment). The devil is in the details here, and it is unclear the level of execution every AI lab will have here. The capability diffusion is determined by the lowest common denominator.
At the end of the day, this type of safety barely matters when true open-weights are coming. If not GLM-5.3, then another model. The size of the models with these capabilities is reducing over time, becoming easier to modify and deploy (potentially without safeguards). Z.ai does some of the right things, including pushing for more vulnerability discovery and proactive management, but any single company is far from being able to handle this on their own.
We need industrial-scale guidance led by the government or industry coalitions to immediately prepare for this transition across all software.
Microsoft's Full-bandwidth Transformers
Full-bandwidth transformers introduce 'latent feedback' by looping top-layer hidden states back into the model to preserve computation depth across decoding steps.
Decoder
- KV Cache: Key-Value cache used in Transformers to store previously computed states, speeding up inference.
- Teacher Forcing: A training technique where the model is given the ground truth token as input for the next step.
Original article
Full-bandwidth transformer
Autoregressive transformers compute along two axes: horizontally across generated tokens, and vertically through model depth. Dense attention gives each token broad horizontal access to the past, but the vertical feedback channel between decoding steps remains narrow: only the sampled token returns to the bottom of the stack, while the top-layer hidden state is discarded. We introduce the full-bandwidth transformer, which widens this channel with latent feedback: at each decoding step, the previous top-layer hidden state is fused with the sampled token embedding through a gated linear unit and fed back as the next input. Latent feedback lets non-verbalized computation re-enter the stack with a renewed depth budget, while preserving the standard transformer architecture, KV cache, and language-modeling objective. To train full-bandwidth transformers without losing parallel teacher forcing, we use a scheduled multi-pass objective that introduces latent feedback late in pretraining and mixes a small fraction of deeper feedback passes for stability. We train 1B-parameter full-bandwidth transformers up to 400B tokens and find that latent feedback improves validation loss, 5-shot language-model evaluation, math and coding generation, and instruction-tuned performance. With negligible per-token decoding overhead, full-bandwidth transformers match or approach standard transformers trained with roughly 1.5$\times$ more tokens, and manage to produce shorter reasoning traces at equal or better accuracy.
LittleLearner (Website)
LittleLearner is a 5B-parameter model constrained to a 5th-grade curriculum to study whether LLMs actually learn new skills or just elicit latent knowledge.
Decoder
- SFT (Supervised Fine-Tuning): Training a model on specific, high-quality examples to follow instructions.
- GRPO (Group Relative Policy Optimization): A reinforcement learning method for training models based on relative performance across groups of outputs.
Original article
A controlled sandbox for studying how models acquire knowledge
Modern LMs are trained on everything at once, so it is hard to tell whether a new skill was learned or merely elicited. We constrain the training distribution itself: an 88B-token corpus filtered to the U.S. elementary-school curriculum, with models trained from scratch on it and matched unfiltered controls.
LittleCurriculum
An 88B-token corpus distilled from FineWeb-Edu through a five-stage filtering pipeline aligned with Common Core standards (K–5). Concepts, facts, and vocabulary taught above Grade 5 are explicitly excluded.
LittleLearner
Three scales (0.6B / 1.3B / 5B) trained from scratch on LittleCurriculum: chattable models with an interpretable knowledge boundary. Each ships with a matched Unfiltered control for clean comparison.
Elicitation, not acquisition
In our experiments, scaling, SFT+GRPO post-training, and in-context learning amplify what the curriculum taught, but none meaningfully improves out-of-scope performance, indicating that the pretraining filter sets the effective capability ceiling.
Model checkpoints
LittleLearner at three scales (0.6B / 1.3B / 5B), each with a matched Unfiltered control sharing its architecture, tokens, and recipe.
Base: the pretrained model. GRPO: math specialists post-trained on MathCAMPS; responses may exhibit a tendency toward math-oriented output. Chatty: variants tuned for general chat behavior.
Capability stays inside the curriculum
Can standard interventions push a model past what its pretraining data taught it? With the boundary under experimental control, we can ask cleanly. In our experiments, each intervention amplifies in-scope ability; none of them meaningfully improves out-of-scope performance.
Scaling
Scaling model size improves performance within the model’s controlled knowledge exposure and extends modestly to problems along the same learning trajectory, but yields little improvement on problems requiring more advanced capabilities outside the exposure.
Post-training
Post-training through GRPO significantly boosts in-scope K–5 capabilities, but fails to recover out-of-scope beyond-K–5 capabilities, even when training with out-of-scope data.
In-context learning
In-context learning with the prompts we test does not unlock new reasoning capabilities in beyond-K–5 for our trained 5B LittleLearner.
What will you teach it?
Because LittleLearner’s training exposure is explicitly specified, behavioral and representational changes can be related directly to the concepts you introduce. Three directions we’re excited about:
Can RL create capability?
The prior is restricted to K–5, so capabilities that emerge under RL can be attributed to the RL process itself. A tractable proxy for reward-driven discovery.
Watch a concept being learned
Introduce negative numbers and measure sample efficiency, retention, and interference. Or probe behavior near the boundary: does it answer, abstain, or hallucinate?
Machine vs. child learners
Specified exposure enables controlled human-model comparison. Do models and children need similar exposure to learn fractions, or make similar errors on word problems?
Bring your own question
A known boundary turns your idea into a clean experiment!
If you find this work useful
Please cite our paper:
@misc{littlelearner2026,
      title={LittleLearner: Language Models Under Pedagogically-Controlled Knowledge Exposure},
      author={Fanfei Li and Jana Zeller and Manuel Prada-Corral and Thaddäus Wiedemer and Prasanna Mayilvahanan and Ryan Cotterell and Wieland Brendel},
      year={2026},
      eprint={2608.13545},
      archivePrefix={arXiv},
      primaryClass={cs.CL},
      url={https://arxiv.org/abs/2608.13545}
}
Introducing Custom Agents
Google's Antigravity 2.0 introduces file-based 'Custom Agents' that allow teams to commit specialized agent configurations directly into their repositories.
Decoder
- YAML Frontmatter: A block of configuration data at the top of a file, commonly used to pass metadata to parsers.
- MCP (Model Context Protocol): A standard for connecting AI systems to local and remote data sources.
Original article
Introducing Custom Agents
Software engineering has shifted from writing lines of code to orchestrating agents. With this shift comes an opportunity for a real productivity unlock via division of labor, breaking complex projects down into specialized agents that can act, verify, and run tasks in parallel.
This is why we are introducing Custom Agents with first-class support in Antigravity 2.0 and the Antigravity CLI, with the Antigravity IDE following shortly.
This post details what custom agents are, how you can set one up in seconds, and some functionalities we have given to custom agents that are unique to Antigravity.
What Are Custom Agents and Why Do They Matter?
General-purpose coding assistants are great, but they suffer from two major limitations:
- Lack of Specialization: A general-purpose assistant doesn’t know your specific project’s testing conventions or dependency management rules unless you explain them every single time.
- Context Window Bloat: Loading a massive, monolithic prompt containing all your coding guidelines, linters, and testing rules into every single chat turns into a token budget disaster.
Custom agents solve this. They are specialized, file-based configurations that define a particular role with its own scoped instructions, tools, and constraints. This keeps your active context clean, minimizes token overhead, and gives you a predictable partner for specific tasks.
Now, you might have read this and thought: aren’t these issues addressed by skills and dynamic subagents? To a large degree, yes! Custom agents don’t replace skills and dynamic subagents, they just provide even more customizability for another level of optimization:
- Skills obviously specialize a custom agent by giving additional context and instructions, and with their progressive discovery, helps to address context window bloat by not adding the full additional text in the full prompt by default, even if not needed. Instead, we let the agent determine whether the full skill should be read given the work at hand. But, if you think about the full set of skills you need across all tasks that you may do, that is still a very large list and the descriptions themselves will take a lot of context. Custom agents let you specify the subset of skills that are actually relevant for the specialization at hand. The same extends to MCP servers, hooks, and other existing customization points. And then on top of that, custom agents let you also customize the system instruction, default tools, and other more “core” parts of the agent loop.
- We introduced dynamic subagents a couple of months ago, and they also help along these axes by letting the main agent delegate some work to a subagent to not pollute the main agents’ context. The “dynamic” part is that the main agent can specify the prompt that it sends to the subagent. With custom agents, we take this one step further by allowing the main agent to delegate to a custom agent, with its specific customizations as discussed earlier, but also potentially other details like model and permissions.
What’s Available Today in Antigravity 2.0 & CLI
Custom agents are now fully integrated across both the visual Antigravity 2.0 Desktop App and the Antigravity CLI.
Similar to Skills, we’ve adopted a Markdown file format containing a YAML frontmatter header, allowing for progressive discovery over custom agents as well. You save these files in your local workspace under .agents/agents/ or user-globally under ~/.gemini/config/agents/.
By committing project-specific agents to .agents/agents/, they automatically become available to every teammate who checks out the repository—giving your entire team standardized, instant workflow assistants out of the box without requiring manual setup.
Here is a basic 101 Blueprint of a simple agent:
---
name: dependency-modernizer
description: Helps upgrade local packages and verify that project tests pass.
model: flash
tools:
  - view_file
  - replace_file_content
  - manage_task
  - run_command
---

# Core Instructions
You are a dependency modernizer. Your job is to check configuration files,
update target dependencies, run test suites, and verify the build passes.
Setting up specialized agents is just a single Markdown file. The frontmatter tells the product how to run the agent, and the markdown body compiles directly into its system prompt.
What Makes Antigravity Custom Agents Special?
If you’ve used other tools in this space, this Markdown + YAML frontmatter layout will look very familiar. We deliberately aligned our file conventions to make porting your existing custom agents as painless as possible.
That being said, how these agents run under the hood in Antigravity is structurally different. Let’s take our basic dependency-modernizer example and build on it to highlight some of the unique possibilities with custom agents in Antigravity.
1. True Symmetry: Main Agent vs. Subagent
In other tools in this space, custom agents are restricted to being subagents only. As a user, you interact with the main, default agent, and it decides when to spawn your worker behind the scenes using the frontmatter descriptions. You cannot launch a primary session directly as your custom agent.
Antigravity introduces execution symmetry via simple configuration flags:
# Add these to the YAML frontmatter:
mainAgent: true
subagent: true- As a Main Agent: You can select
dependency-modernizerdirectly from the dropdown in the Antigravity 2.0 GUI, or run it via the CLI (agy --agent dependency-modernizer). The specific core instructions are directly compiled into the system prompt and you adopt all of the agent execution parameters in the frontmatter, allowing you talk directly to your custom agent. - As a Subagent: The same agent can be dynamically called as a tool by a coordinator agent, as is standard.
2. Scoped Safety Policies (commandExecutionPolicy)
Running an agent that executes command-line operations (like dependency installs or test suites) can be incredibly frustrating. If the safety policy is too loose, you risk running unverified code. If the policy is too strict, you get stuck in a loop of constant approval prompts.
While both Antigravity and other tools support basic, all-or-nothing permission levels (like acceptEdits or bypassPermissions), we add a dedicated execution filter:
# Add this to the YAML frontmatter:
permissionMode: acceptEdits
commandExecutionPolicy: auto
Setting commandExecutionPolicy: auto allows the agent to execute standard test and compilation commands autonomously in the background. High-risk commands (like deleting files) remain strictly gated behind manual approvals. This lets the modernizer perform rapid trial-and-error cycles in the background without constantly prompting you for approval.
3. Rich Lifecycle Hooks (Nested Interceptors)
Other tools in this space support basic lifecycle hooks scoped to the subagent. Antigravity takes this further by introducing a robust, nested lifecycle hooks schema directly in the agent’s definition.
We can add setup and verification checks to our modernizer at precise execution boundaries:
# Add these hooks to the YAML frontmatter:
hooks:
  PreInvocation:
    - type: command
      command: scripts/setup.sh
  PreToolUse:
    - matcher: run_command
      hooks:
        - type: command
          command: scripts/verify-local-env.sh
In this example:
- PreInvocation: Runs a setup script to prepare the environment before the agent starts thinking.
- PreToolUse (with Matchers): Intercepts specific tool calls. Here, every time the agent tries to run a terminal command, we run a verification script first to ensure your local environment is sound.
Looking Forward
Custom agents are just our next step towards a cohesive customization story across every part of the product stack, allowing Antigravity to assist on more complex tasks in more efficient ways.
To get started, check out the Custom Agents Guide in the docs and try defining your first custom agent in your workspace today.
Happy hacking! :)
MathCode (Website)
MathCode is a new terminal assistant that translates natural language math into Lean 4 formal proofs using a persistent REPL and dependency graphs.
Decoder
- Lean 4: A theorem prover and functional programming language designed for formal mathematical verification.
- REPL (Read-Eval-Print Loop): An interactive programming environment that takes input, evaluates it, and prints the result.
- LSP (Language Server Protocol): A standardized way for editors to provide features like autocomplete and error checking for a language.
Original article
Overview
MathCode is a terminal AI coding assistant with a built-in math formalization engine. Give it a math problem in plain language and it will automatically convert it into a Lean 4 theorem and attempt a formal proof — with a persistent Lean REPL, reusable theorem and axiom libraries, agentic proving, and an Obsidian knowledge graph.
Quick Start
Requires macOS (arm64) or Linux (x86_64), plus the codex CLI for the default backend.
git clone https://github.com/math-ai-org/mathcode.git
cd mathcode
bash setup.sh
codex auth login
mathcode
setup.sh prepares the release checkout, downloads the bundled runtime and Lean toolchain, and installs a user-local mathcode launcher. Try it with:
mathcode -p "prove that the square of an even number is even"Outputs are written to LeanFormalizations/. A browser UI is available via ./run webui.
Features
Persistent Lean REPL
A persistent Lean language server brings compile checks to ~0.4s after a one-time warmup, instead of ~30s.
Theorem Library
Every proved theorem is auto-named, stored, and made importable so the prover and planner can reuse it.
Axiom Library
Store conversational assumptions as persistent, compile-checked, consistency-reviewed Lean declarations.
Lean LSP Integration
Searches leansearch.net and Loogle for verified Mathlib lemmas and uses structured LSP diagnostics for repairs.
Obsidian Theorem Graph
Generates an Obsidian vault that visualizes theorem-to-lemma dependencies as a knowledge graph.
Agent-Mode Proving
Each proof becomes an interactive session where the agent writes candidates, reads errors, and recompiles.
Tree-of-Subgoals
Decomposes complex theorems into independent subgoals and proves them in parallel, then stitches them back.
Multi-Planner
Runs multiple planners in parallel for diverse proof strategies; the prover picks the best approach.
Citation
If you use MathCode in research, please cite:
@misc{mathcode2026,
  title   = {MathCode: A Frontier Mathematical Coding Agent},
  author  = {Team Math-AI},
  journal = {math-ai-org.github.io},
  year    = {2026},
  month   = {April},
  url     = {https://github.com/math-ai-org/mathcode}
}
The math formalization and proving pipeline is based on the AUTOLEAN project.

The AI Engineering Skills Map
Andrew Ng defines the core of modern AI engineering as a blend of building applications, software fundamentals, agentic workflows, and product strategy.
Deep dive
- Building/deploying AI apps: Focuses on RAG, context engineering, and managing unpredictable outputs via error analysis.
- Software fundamentals: Prioritizes architectural tradeoffs, system reliability, and cost efficiency to avoid poor agent-driven decisions.
- Coding agents: Requires managing context windows, planning vs. execution loops, and autonomous verification.
- Shaping the build: Shifts developer roles from passive implementation to active product decision-making.
Decoder
- Agentic workflow: A system where an AI is given a goal and iteratively uses tools, planning, and self-correction to complete tasks without constant human prompting.
Original article
The AI Engineering Skills Map
I am delighted to present The AI Engineering Skills Map. AI allows us to build software very differently today than in 2022, and everyone with the skills to take advantage of this shift has numerous exciting project and job opportunities. But with the noisy, hype-filled, information environment around AI, what are the most valuable skills for you to learn? I have been working with my team to synthesize a map of AI engineering skills in order to help (i) developers prioritize what to learn, and (ii) employers hire skilled developers.
Based on an analysis of over 10,000 job postings; carrying out dozens of structured interviews with AI experts, hiring managers, and recruiters; gathering data through surveys; and synthesizing other online data, here are the four most important AI engineering skills:
- Building and deploying AI applications
- Software engineering fundamentals
- Using coding agents
- Shaping the build
You can informally think of our process as akin to running clustering on a massive dataset of jobs and expert interviews to identify the most important skills, not just today but also in the near future.
A note on terminology: I talk about AI Engineering skills rather than the “AI Engineer” role (someone whose job is to build AI systems), because the former is much broader. All developers today should know how to work with the cloud, and only a smaller number have a “Cloud engineer” title. Similarly, all developers — full-stack engineers, data engineers, DevOps engineers, machine learning engineers, and, yes, AI engineers — will need AI engineering skills.
Building and deploying AI applications. The key difference between AI and non-AI applications is that the former has unpredictable outputs. When you prompt an LLM, you don’t know what you’ll get back. When you train a deep learning algorithm, you don’t know what prediction it will make on new examples. In contrast, traditional software behaves more predictably.
People who are skilled at building and deploying AI applications understand the building blocks of AI (such as LLMs, context engineering, RAG, agentic workflows, machine learning and deep learning) and, importantly, how to use statistical techniques to measure, steer, and govern AI systems so that they behave more predictably. A core skill in doing so is knowing how to drive disciplined evals and error analysis loops.
Software engineering fundamentals. When you deeply understand how software works, you can build much more effectively. Engineering software requires making tradeoffs between cost, scalability, reliability, speed, and more. Security and privacy add further complexity.
Understanding software fundamentals allows you to recognize what tradeoffs even exist. This leads to better decisions in choosing your software stack, designing system architecture, designing your data store, testing, and so on. It also leads to much better outcomes than those for an inexperienced developer who vibe codes a solution without knowing the tradeoffs their coding agent is making — which will often be poor ones, because they don’t know what context to give their coding agent. Understanding software engineering fundamentals lets you make good tradeoffs by steering coding agents using the precise language of software engineering.
Using coding agents. Using agentic coding effectively is now a key skill for every developer. When you have this skill, you have a good mental model for how agents work. You understand their limitations and how to work around them, and are able to quickly steer them — knowing how much to intervene and how much to leave them alone — to build robust software without wasting excessive time or tokens.
This requires your knowing how to manage a coding agent’s context, make tradeoffs between planning and execution, and help the agent autonomously close loops by providing verifiers or evals. You also need to know how to work with a clear spec (and when not to bother doing so), orchestrate multiple agents that work together, and avoid pitfalls like risk an agent messing up your production database. Because agentic coding is evolving quickly, using coding agents skillfully means not only knowing cutting-edge practices, but also having routines to keep trying new tools and evolve your workflows as best practices change.
Shaping the build. Given a clear spec, coding agents are rapidly improving at delivering to it. Thus, our work as engineers is shifting toward deciding what should be in the spec. Engineers should no longer expect to be given a pixel-perfect design and asked only to implement it. Instead, effective AI engineering requires having product sense and understanding business context and customer goals, so you can participate in shaping and driving the build.
AI also gives you the opportunity to take on greater ownership and agency than before. You can identify interesting problems and opportunities, and execute to take advantage of them in responsible ways. Taking advantage of this opportunity requires knowing how to drive projects forward. For example, knowing when to quickly build an MVP to take to users for testing, and when to slow down and take longer in order to build more carefully.
Underlying all these skills is a mindset of continuous learning. AI continues to change quickly, so we must all keep learning and evolving our skills to adopt emerging best practices.
DeepLearning.AI’s principal focus is to help developers gain these AI engineering skills. I have more to say about each of these four skills, and will flesh out each of them in upcoming posts and share a more detailed AI Engineering Skills Map. As I look at where AI Engineering is going, I am incredibly excited about what all of us will be able to build. I hope you will play an exciting role in this future.
When the Hard Part Stops Being Hard
The automation of tedious proof-checking and implementation tasks is causing a massive surge in programming language research submissions.
Deep dive
- Mechanization: The use of tools like Lean to automate formal soundness proofs in PL theory.
- Publication pressure: The shift from measuring output by 'person-months' to the speed of ideation and iteration.
- Bar raising: Future PL papers will likely need to tackle complex system kernels rather than simple toy calculi to remain relevant.
Decoder
- Lean: A theorem prover and programming language used to mathematically verify that code or logical statements are correct.
Original article
A few days ago, a paper I co-authored, Tracking Borrows with Regular Expressions, was accepted to OOPSLA’26. It presents a new type system for Move, a Rust-style smart contract language, built on a rather cute idea: using regular expressions to capture heap reachability. I won’t go into the technical details here. What I want to talk about instead is how the paper was made and how the publication culture in programming language research has changed in the past five months.
For this paper, the part that usually consumes about 80-90% of the effort in a programming language (PL) design paper, the mechanisation of its meta-theory and the formal soundness proofs, was done by one person (me) in Lean, using a frontier LLM, in about four weeks, end-to-end, at the scale of a production compiler rather than a toy calculus. I wrote about that experiment in a blog post back in March. Back then, I’ve given a several talks on this effort and discussed it with a a couple of dozen of prominent members of the PL research community. While I received a fair share of curiosity and enthusiasm, many reactions at the time ranged from skepticism (“the formalisation must not have been hard enough”) to outright rejection (“this is not how PL theory should be done”).
I think those reactions say something about our publication culture. Unless research embodies a visible amount of human effort, or even struggle, it is unlikely to be taken seriously. We do love elegant ideas in PL, but we prefer them wrapped in eight to ten person-months of labour: a large implementation, extensive benchmarking, or machine-checked proofs pushed through by hand. That wrapper is now gone. An experienced researcher with a good idea can turn it into a competent PL publication in about a month.
We used to raise eyebrows at the AI/ML world, where a month-long sprint from an idea to a solid NeurIPS submission is, as I am told, routine. That is now our reality too. When I described my experiment to Martin Rinard, an MIT professor who was visiting NUS at the time, it took him roughly a month to fully formalise in Lean an optimising compiler he was working on, write a paper about it, and submit it to a conference, having never touched Lean before.
I don’t think we have fully absorbed what this does to our field, but the first effects are already visible. What was surprising in March 2026 became common knowledge by July 2026: POPL submissions nearly doubled this year, from ~350 to 600. The unexpected part is that the fraction of outright AI-generated slop among them is relatively small. Most are pieces of competent research, produced at ten times the usual pace, with the tedium of proofs, implementations, and evaluation now largely automated. Having more than two papers at a single POPL, PLDI, OOPSLA, or ICFP used to signal a strong vision, a prolific group, and a wide network of collaborators. Now the same amount of research can be done by a single PhD graduate with good ideas. Therefore, I would not be surprised if three or four single-author papers at a top PL venue becomes unremarkable within a year or two.
Why only a year or two? Because the community will inevitably raise the bar, once we realise that producing old-style papers (“look, I defined a toy calculus and proved it confluent!”) with modern tools is not a good use of anyone’s time. In an age when anyone can build a CompCert or a seL4 microkernel from scratch in the proof assistant of their choice, we will have to become more ambitious, and take on challenges we could not have imagined a couple of years ago.
-
In case you’re curious, the Lean development is available at https://github.com/ilyasergey/lean-move.

Qwen 3.8 27B is excellent, but it defaults to wildly overthinking things
Alibaba's new 27B parameter Qwen 3.8 model is highly capable but suffers from a hilariously over-engineered 'reasoning' default.
Deep dive
- MTP (Multi-Token Prediction): A technique where the model predicts multiple tokens simultaneously, significantly boosting inference speed.
- Performance: Running the model with
--spec-type draft-mtpyielded a 72% performance improvement in benchmarks. - Capabilities: The model excels at vision tasks and bounding box generation, though it tends to over-analyze prompts by default.
- Local execution: It is currently one of the most efficient open-weights models for running complex agent loops on high-end laptops.
Decoder
- GGUF: A file format for storing models optimized for fast loading and inference on consumer hardware, particularly via llama.cpp.
- Quantized: A compressed version of a model that uses lower-precision numbers to reduce memory requirements at the cost of some accuracy.
Original article
Qwen 3.8 27B is excellent, but it defaults to wildly overthinking things
Friday’s big release was Qwen 3.8 27B, an Apache 2 licensed 27B parameter vision-capable LLM from Alibaba’s Qwen research lab. I’ve been looking forward to this one: 27B is an excellent size for running a model on a reasonably specced laptop, and its predecessor Qwen 3.6 27B was impressive.
Qwen’s self-reported benchmarks for this model are eye-opening. They show a boost from both Qwen 3.6 27B and the closed-weight Qwen 3.7-Plus, which was one of Qwen’s strongest models of any size as recently as May this year. It will be interesting to hear what independent benchmarks have to say about the model.
I’ve been running the model on two different machines: my 128GB M5 Max MacBook Pro, and an NVIDIA DGX Spark. On both machines I’m running LM Studio and their 17GB Q4_K_M quantized build. I also tried using llama-server directly on the Spark.
The default of extra high results in spectacular over-thinking
Qwen’s documentation describes the model as defaulting to xhigh for the reasoning effort, and the LM Studio GGUF I’ve been trying preserves that default:
Qwen3.8 comes with official support for
reasoning_effort, which can be used to adjust reasoning depth and control cost:
xhigh(default): for complex tasks demanding thorough analysismedium: balancing accuracy and speedlow: efficient reasoning optimizing for speed and cost
This is a hilarious default. It’s absolutely not a good way to run the model, especially on consumer hardware. I’ve been finding the results extremely entertaining.
I quickly ran into problems with LM Studio’s default context limit of 8,192 tokens—Qwen was using them all up thinking about even the most mundane of problems. I loaded the model with the full 262,144 maximum context length and that problem went away.
Here’s the pelican riding a bicycle SVG I got from my first attempt with that increased context length. It took 21 minutes to generate, using 22,276 reasoning tokens to produce 3,223 tokens of output.
This is by far the best pelican SVG I’ve been able to generate with a model that runs on a local machine—and this Qwen is pretty small, just a 17GB file on disk. There’s a lot to like about this:
- The bicycle frame is the right shape
- It has legs on each side of the bike—that’s very rare
- Good, clear pelican pouch
- The wings extend to touch the handlebars!
- The motion lines are behind, not in front
- It has a tasteful background—nice sun, clouds, hill, flowers and grass.
Was that worth waiting 21 minutes for? Absolutely not.
Here’s that same prompt run with reasoning turned off. This one produced 3,715 tokens and took 137s—just over two minutes.
I said Qwen at xhigh has a tendency to over-think things, but how bad really is it?
I tried a much simpler prompt, again with that default extra high setting:
draw an svg of a circle
Qwen’s reasoning trace started like this:
The user is asking for an SVG drawing of a circle. Simple request — but I want it to be a carefully crafted piece. Let me make something that goes beyond just
<circle>: a single self-contained SVG file with character — maybe a geometric “circle study,” with subtle animation, layered rings, and a distinctive palette.Keep the scope right: they asked for an SVG of a circle. So the core is a circle. But I can add craft: concentric guide circles (like a compass/geometry drawing), tick marks, a soft gradient fill on the main circle, restrained ambient motion (a slowly rotating dashed ring, pulsing glow). Respect prefers-reduced-motion? That’s more for CSS; SVG SMIL or CSS inside SVG will do.
Palette options: deep teal ink on warm paper? Or bold vermilion circle on off-white with navy construction lines — Bauhaus/compass-drawing vibe. Let me go with a “geometric study” look: cool slate background, or bright paper white? Paper white is fine if it’s not the cream-and-terracotta combo. [...]
Several minutes later it produced this absolutely beautiful animated circle, which was entirely not what I had asked for! My strong recommendation: ignore that default. Run Qwen 3.8 27B on low or even no reasoning levels at first. It’s a great model, but wow that default setting is a bad place to start.
It’s very good at bounding boxes
A fun way to test a vision model is to see how well it can return bounding boxes around items in a photograph. I’ve seen previous Qwen models deal well with this, so I decided to put it to the test drawing bounding boxes around some pelicans.
I’ve seen asking for 0-1000 scale produce good results in the past.
Here’s the reasoning trace, which produced this:
[
  {"bbox_2d": [195, 290, 370, 780], "label": "pelicans"},
  {"bbox_2d": [445, 320, 675, 850], "label": "pelicans"}
]
This is such a good match.
Building a tool to label bounding boxes
That visualization of the bounding boxes was taken using a new custom tool that I had Qwen 3.8 27B build for me, running offline on my laptop.
I forgot to dial down the thinking effort so it was massively over-engineered, but it did manage to produce this full interface from this single prompt:
[
   {"bbox_2d": [195, 290, 370, 780], "label": "pelicans"},
   {"bbox_2d": [445, 320, 675, 850], "label": "pelicans"}
]
Build an HTML page which has an input box for accepting the URL to an image and a textarea for accepting the above style of JSON.
It appends the image to the page, measures its width and height, then treats the coords in the bbox_2d as scaled from 0-1000 and scales them against the actual width and height, then it renders labelled boxes over the image.
Here’s the relevant segment of the thinking trace, where it decided to draw its own pelicans purely because I had used the label “pelicans” in the example JSON I gave it in the prompt:
Also a “load sample” that uses a known image? Can’t depend on external images, but… the image URL input is user-provided; I could add a “try with sample” button [...] Hmm, I can draw a simple scene on canvas, export it as a data URL, and load it into the image — that’s self-contained and demo-able! [...] But the user’s coords are for an actual pelican image; a generated placeholder can still demo the scaling. Generate a 1000x1000 placeholder: gradient water + two blob-like “pelican” silhouettes placed at the given bboxes (using the same scale — cute: silhouettes at the exact 0-1000 positions, showing the boxes align). This makes for a fun, self-contained demo. Keep it simple: sky gradient, sun, water, two pelican-ish shapes (ellipse body, circle head, beak). Place at bbox centers.
Is all that over-thinking necessary? Maybe it is, at least a bit. I tried with reasoning turned off, which nearly works but shows the boxes in the wrong place.
So without reasoning it didn’t quite one-shot a working tool. I’m sure it could get there with some follow-up prompts, but this is a good example of how reasoning can make a difference.
Yes, it can drive coding agents
One of the biggest questions around local models is whether or not they have enough horsepower to successfully run a coding agent loop. Coding agents require long context, strong code generation support and reliable tool-calling. On paper Qwen 3.8 27B has all three of these, so is it up to the task?
My initial experiments with Pi have been very promising. I chose Pi because it has a shorter system prompt than most other options, making it a better fit for trying out smaller models.
I configured Pi to use Qwen 3.8 27B running in LM Studio on the Spark and prompted: how does auth work? After a sequence of reasoning and tool calls that accessed a bunch of different files it produced this reply, which is very solid.
The quest for speed
So far this is all looking very promising. We have a 17GB model that runs on high-end consumer hardware and can write code, drive tools, annotate images and generally do everything that I need from an LLM for getting real work done.
There’s one very significant catch: it feels slow—especially when it starts over-thinking, but even without that it’s not particularly sprightly.
I’ve been getting around 15-30 tokens a second from LM Studio. That’s not terrible, but it’s slow enough that it’s going to be hard to win me away from hosted API models, which can return results a whole lot faster.
One of the most promising optimizations is baked into the model itself. Qwen supports Multi-Token Prediction, an architecture trick where a cheaper mechanism guesses several tokens ahead and the main model can then quickly verify if the guesses were correct. This can have quite a dramatic effect on inference performance.
Based on this tweet from llama.cpp creator Georgi Gerganov I tried running the model with MTP and sure enough, this gave me a significant boost, outperforming the LM Studio default GGUF by around 72%.
Some observations
The fact that a 17GB file can do all of this stuff on my home machines is a miracle. Once again, I’m delighted and amazed at how much progress local models have made this year.
The only thing holding this back from being a daily driver is performance. It feels pretty slow on both the M5 Mac and the DGX Spark. That’s the catch with these dense (non-Mixture-of-Experts) models—they require a whole lot of memory bandwidth to perform well, and neither of the machines I have access to are top performers in that regard.
The most important thing about Qwen 3.8 27B is what it demonstrates. We can have an open weights general purpose model with a long context, effective tool calling, strong vision ability, and competent code generation, and we can fit the whole thing in just a 17GB file.

No Plan Survives Contact With the Enemy (Reality)
Developers should stop planning in the abstract and instead let AI coding agents spend cycles in the 'lab' to produce prototypes before designing the system.
Decoder
- PRD (Product Requirements Document): A document that outlines the purpose, features, and functionality of a product before development begins.
Original article
If you’ve ever presented the design of a product after the fact, you know the most interesting bit is the surprises. What broke at scale? Where did you change course? What did the customers do that you didn’t expect? What were the interesting metrics? These are impossible to predict in advance. They’re also the most important parts—the punch lines.
When we talk to folks about how they use coding agents they usually fall near one end of a spectrum: planners, who work on a spec or design with an agent, and iterators, who write a short prompt, and iterate on (or throw out) the results. Of course, this is all new, and none of us knows what we’re doing yet. (This is the time to let a thousand flowers bloom. Build your own software factory.)
But the debate on planning vs iteration is not new. (And neither side is right, though you should consider about what works for your team, and why). We’ve read clear PRDs or slides that have set the direction for a product or project. We’ve been in meetings where the prototype carried the day after weeks of failed paper designs. And everything in between.
If your most precious commodity is your attention, ask your agents for the design after they’ve built the thing. Ask it for the surprising things. The sticky bits. The workarounds. The contentious topics in review. The traditional funny quote here is from Frank Westheimer, who said “Why spend a day in the library when you can learn the same thing by working in the laboratory for a month?” If it’s the coding agent—and not you—in the lab, however, this is turned upside down: let the agent spend some extra cycles in the lab, and get one layer deeper on the design.
The planners and iterators are closer than they think: a plan that’s been prototyped is a better plan.
A quick look at zero-knowledge proofs
Zero-knowledge proofs allow a prover to convince a verifier of a solution without revealing any data about the solution itself.
Deep dive
- Prover/Verifier Dynamics: Two parties engage in an interactive session; the prover asserts knowledge of a solution to an NP-complete problem.
- 3-Coloring Protocol: The canonical ZKP example uses graph coloring where no two connected nodes share the same color.
- Permutation: The prover shuffles color labels each iteration to ensure the verifier receives no cumulative knowledge of the actual coloring.
- Locked Boxes: Hashing is used to 'lock' the colors, ensuring the prover cannot cheat once a challenge edge is selected.
- Iteration Probability: Confidence in the proof grows exponentially with each round; 4600 rounds reduces the probability of successfully cheating to 1%.
- NP-Completeness: Any NP-complete problem can be reduced to a 3-coloring problem, meaning theoretically, any verifiable solution can be proven via ZKP.
Decoder
- Zero-knowledge proof (ZKP): A method by which one party can prove to another that they know a value, without conveying any information apart from the fact that they know the value.
- NP-complete: A class of computational problems that are difficult to solve but whose solutions are easy to verify.
- 3-coloring: A graph theory problem where each node must be assigned one of three colors such that no two adjacent nodes share the same color.
Original article
A quick look at zero-knowledge proofs
NB: This isn’t about crypto. I don’t care about crypto.
Chris messaged me the other week asking if I wanted to implement zero-knowledge proofs. I initially was not interested, but then he said:
What if I told you there’s a version of them that has nothing to do with cryptocurrencies? What if I told you it involves graph theory? What if I told you there’s a 30 line implementation?
Now that was interesting.
The idea of a zero-knowledge proof (ZKP) is that there are two parties: the prover and the verifier. The prover asserts that it has a solution to a (generally NP-complete) problem. The prover can convince the verifier of this without sharing the actual solution to the problem.
The canonical example is 3-coloring a graph. That is, the prover asserts that, for a given (shared) graph, it has a valid 3-coloring. It wants to convince the verifier of this without revealing the actual color assignment.
As a quick recap, graph coloring is the problem where given a graph, we find a way to assign each node a color such that no two adjacent nodes have the same color. 3-coloring is coloring with at most 3 colors.
How do you do this? Assorted blog posts and fancy-looking demonstrations were interesting but did not help us understand much.
Chris and I went around in circles for a bit until we decided to take a look at one of the original papers (PDF) by Goldreich, Micali, and Widgerson. We only really read page 23 (labeled page 713 in the PDF) but that was enough to get things going.
The paper’s protocol
Protocol 4 from the paper describes an interactive 3-color proof session between the prover (P, with numbered steps) and the verifier (V, with numbered steps), reproduced here:
common input A graph
G(V, E)(n = |V|,m = |E|).The following four steps are executed
m²times, each time using independent coin tosses.(P1) The prover chooses at random an assignment of three colors to the three independent sets induced by
φ, colors the graph using this 3-coloring, and places these colors innlocked boxes each bearing the number of the corresponding vertex. More specifically, the prover chooses a permutationπ ∈R S₃, placesπ(φ(i))in a box markedi(∀i ∈ V), locks all boxes and sends them (without the keys) to the verifier.(V1) The verifier chooses at random an edge
e ∈R Eand sends it to the prover. (Intuitively, the verifier asks to examine the colors of the endpoints ofe ∈ E.)(P2) If
e = (u, v) ∈ E, then the prover reveals the colors ofuandvby sending the verifier the keys to boxesuandv. Otherwise, the prover does nothing.(V2) The verifier opens boxes
uandvusing the keys received and checks whether they contain two different elements of{1, 2, 3}. If the keys do not match the boxes, or the contents violate the condition then the verifier rejects and stops. Otherwise, the verifier continues to the next iteration.If the verifier has completed all
m²iterations then it accepts.
We’ll come back to the number of iterations. For now let’s try to just do one iteration. For each step, I’ll annotate the code with “Only prover” or “Only verifier” so that it’s clear who can see what data.
One iteration
We’ll start by sketching out what it means to have a graph. For the example graphviz graph above, we have the following edge list data structure:
# Shared between prover, verifier
edges = [(0, 1), (1, 2), (2, 3), (3, 4), (4, 0), (0, 2)]
Each tuple in the list represents a connection between two numbered nodes. Fancy stuff. Because it’s an undirected graph, (0, 1) means the same as (1, 0) so we don’t have to include both. We can also color it:
# Only prover
coloring = {0: "navy", 1: "darkgreen", 2: "crimson", 3: "navy", 4: "darkgreen"}
Each key is a node number and each value is a color.
Though finding a 3-coloring of a graph is slow, verifying one is fast—linear in the number of edges. Let’s verify that we have a valid sample coloring:
# For the reader
# Check each edge to make sure no edge has the same color on each node
assert all(coloring[u] != coloring[v] for u, v in edges)
# Check that the total number of colors used is 3
assert len(set(coloring.values())) <= 3
We’ll now go through the paper’s steps one by one, writing some code to accompany each step.
Tips and tricks
If you are building alongside the blog post, I recommend using random.seed(0) so your randomness doesn’t change between runs of your program. I also recommend setting the environment variable PYTHONHASHSEED to 0 if you are using hash for the same stability reasons.
Step P1
The first thing we need to do is permute the coloring we have. That is, we should swap around the color values while maintaining the 3-color property.
Thankfully, this is easier than it might sound: the names of colors are meaningless to the 3-coloring; they need only be different along the edges. So if we do a bijective (A maps to one B, and B came from one A) mapping from old to new name, this will hold.
I came up with this function that shuffles the colors, lines them up side-by-side, makes a table, and then uses that to make a new coloring:
import random

# Only prover
def permute_three_coloring(coloring):
    all_colors = list(set(coloring.values()))
    new_colors = random.sample(all_colors, len(all_colors))
    permutation = {old: new for old, new in zip(all_colors, new_colors)}
    return {node: permutation[color] for node, color in coloring.items()}
Then we have to place the colors in “locked boxes”. One way to proverbially lock a box is to apply a one-way function to it: for example, a hash function. If we hash each color and then pass only the hashes to the verifier, the verifier cannot open them.
This example uses the Python standard library hash function for brevity but it might be better to use a cryptographic hash function like hashlib.sha256:
# Only prover. Wrong!
def hash_coloring_wrong(coloring):
    return {node: hash(color) for node, color in coloring.items()}
There’s just one problem with handing these locked boxes to the verifier: two boxes locked with the same colors will have the same hashes. The verifier would know the coloring. Even if the exact colors are now hidden, it’s really the structure of the coloring for which we want to give up zero knowledge.
To get around this, we can add what’s called a nonce to each node and its coloring. That is, each node gets a little bit of random data packed into the hash so that different nodes’ "darkgreen" hash values look different.
# Only prover
def nonce():
    return random.randrange(100)

def box_coloring(coloring):
    return {node: (color, nonce()) for (node, color) in coloring.items()}

def hash_values(coloring):
    return {k: hash(v) for (k, v) in coloring.items()}

permuted_coloring = permute_three_coloring(coloring)
boxed_coloring = box_coloring(permuted_coloring)
hashed_coloring = hash_values(boxed_coloring)
Again, you probably don’t want to use the standard library random number generator for your nonces. You should consider something like secrets.token_hex() from the secrets module (Python 3.6+). Maybe even consider using the hmac module.
Finally, we can send the hashed_coloring to the verifier and begin step V1.
Step V1
Since the verifier knows the graph (but not its colors), it can pick an arbitrary edge to inspect. It wants to verify that the arbitrary edge it picked satisfies the 3-color conditions. It sends off a request for an arbitrary edge e:
# Only verifier
e = random.choice(edges)
revealed = prover_please_reveal_colors(e)
Step P2
The prover, having received this request, sends over the colors and nonces for each of the nodes in the edge.
# Only prover
def prover_please_reveal_colors(edge):
    u, v = edge
    return {u: boxed_coloring[u], v: boxed_coloring[v]}
You may be suspicious at this point because we’re leaking some information about the coloring.
Note that it’s ok for the prover to reveal the color for one edge, because 1) the colors have been shuffled once per round and 2) we’re going to apply our box locking protocol each time we reveal an edge (also once per round), so the verifier accumulates no information about our colors between iterations.
Step V2
The verifier can check that the color+nonce hashes to the hash value given for each node in step P1. This ensures that the prover is not changing colors around mid-round. This relies on the verifier and the prover using the same hash function (and the same hash seed if using hash).
The verifier must also check that the colors of the two nodes at each end of the edge is a member of the publicly agreed on color set. Otherwise, the prover could color every node a different color.
# Only verifier
for (node, (color, nonce)) in revealed.items():
    assert hashed_coloring[node] == hash((color, nonce)), f"Hash mismatch!"
    assert color in all_colors, f"Invalid color {color}!"
The verifier can then inspect that the two color values are different. This gives a small amount of credence (1/|E| because you know something about one edge now) that the graph is 3-colored appropriately because the prover had no way of knowing which edge the verifier would want to inspect.
If any of these conditions don’t check out, the verifier rejects.
Probabilities
You have to do at least a couple of rounds of this for the verifier to believe the prover about the 3-coloring.
The paper goes on to assert that “the probability that the verifier will accept (i.e., complete all the m² rounds without detecting that “something is wrong”) is bounded above by (1 - m⁻¹)^(m²)” (where m = |E|). Which is pretty good. For a large graph (say, 1000 edges), this falls off reasonably quickly:
m = 1000
for i in range(1, 4600):
    print("(1 - m⁻¹)^round = ", (1 - m**-1)**i)
Encoding other NP-complete problems
At this point, we’ve shown how you can use a zero-knowledge interactive proof to verify that someone has a valid 3-coloring of a graph without learning any information about the 3-coloring. So what? Is there anything else we can prove with zero knowledge? Is the interactive proof of 3-coloring just a contrived party trick without real applications?
Sudoku
Sudoku puzzles are another example of a problem that’s hard to solve and easy to verify. It is algorithmically hard to fill in 81 squares to satisfy the constraints of all rows, columns, and boxes containing the digits 1-9, but the verifier is extremely quick.
Let’s say we wanted to prove we’ve finished a Sudoku, but we don’t want to give up a morsel of information about the solution. We can execute an interactive proof very analogous to 3-coloring! Instead of shuffling colors, we shuffle digits. Instead of revealing edges, we reveal rows, columns, and boxes.
Reduction
Let’s say we have a hard problem and we’ve computed a solution it, but we don’t have an obvious algorithm on hand to execute an interactive proof for it. Thanks to the authors of the paper above, we know that if the problem is NP-complete there’s an interactive proof for it!
We use the power of a polynomial time reduction. We (somehow) convert our solution to a graph and its 3-coloring, then just follow the steps and code above! The “somehow” is the tricky part, but much research exists on converting between different NP-complete problems.
Wrapping up
After doing a bit of research, we decided that the most common real world use cases of zero-knowledge proofs (age verification, crypto, etc) aren’t particularly interesting to us. We enjoyed the graphs and theory of computation and networked computing though. We hope you had fun playing around with interactive proofs too.

You can just choose how many bugs you want now
AI agents can identify nearly any number of bugs, but the paradox is that developers now face a surplus of issues without an increase in software polish.
Deep dive
- AI agents are proficient at identifying subtle, complex bugs.
- Fixing every identified bug often adds unnecessary complexity (epicycles).
- Software polish has not increased despite the rise of AI coding assistants.
- The 'preventable problem paradox' disincentivizes proactive cleanup.
- Using agents in a loop often results in spaghetti code.
- Strong test suites remain the best defense for AI-generated code.
- Architectural choices like Multi-Page Apps (MPAs) eliminate bug categories by design.
Decoder
- Epicycle: An obsolete astronomical concept used to explain planetary motion; here it refers to adding layers of complex code fixes that only complicate the system further.
- Vibe coding: A colloquial term for coding by describing intent or 'vibes' to an AI rather than writing explicit instructions.
Original article
You can just choose how many bugs you want now
There’s a bizarre aspect of AI coding that I’ve been trying to put my finger on, and I think it’s this: you can basically just decide how many bugs you want your software to have now.
We discovered this first with security, because of course security bugs are the most non-negotiable ones. But I think once the vulnpocalypse is over, we’ll start to turn our attention to other types of bugs: correctness, performance, accessibility, reliability, etc.
Some of us are already doing this. For example, I find myself spending a lot of time these days in code review, using tools like my triple-agent code review skill as well as Geoffrey Litt’s explain-diff skill.
My experience is that, in a complex system, you can basically find as many bugs as you ask the agents for. If you get tired of tackling bugs in the PR itself, have no fear: the agent will also find plenty of preexisting bugs for you to spend time on. The question is just when you want to stop and call it “done.”
Of course the bugs are not free to fix. There are still many tradeoffs to consider: lines-of-code versus likelihood that the bug will actually occur, the risk of introducing new bugs in a complex solution, the cost of making the code harder to understand for future reviewers or agents, etc. But the finding of the bugs has become nearly free, and AI agents are also capable of finding very subtle, intricate bugs that otherwise could have flown under the radar for years. What we do with this situation is the interesting question.
As many have noted, it doesn’t seem like the overall polish of software has increased since AI coding became a thing. If anything, there is just more junk and shovelware out there, of dubious quality. I think this demonstrates that, although our ability to find new bugs has skyrocketed, our overall tolerance for bugs has not changed. There are still plenty of winds blowing in the opposite direction:
- The preventable problem paradox: if an incident occurs and you swoop in to fix it, you’re a hero. If you prevent the problem from ever occurring in the first place, then nobody knows you did anything.
- Related: the pressure inside many software orgs is to keep shipping visible results, not to fine-tune something that already “works.” With AI coding this is magnified: management often assumes that 10x productivity means 10x more visible features and apps.
- Laziness: one of the classic virtues of a programmer, this time working against us. I find myself mentally exhausted after slogging through the umpteenth AI-generated bug report, which requires me to carefully think through intricate aspects of the system and weigh the pros and cons of fixing it. I imagine many of my peers in the industry have just tuned out AI code reviews or only focus on the most critical findings.
Avoiding epicycles
There are a few ways we can approach this problem, though, that don’t require unending toil. One way is to set up the agent on a loop, e.g. “do a code review, fix all critical/high/medium issues, then repeat.” I find this can work, but it has a tendency to create lots of epicycles.
If you’re not familiar with the concept: in the pre-Copernican model of the solar system, ancient astronomers “fixed” miscalculations in the planets’ orbits by simply adding more circles to their movement. This improved the accuracy of the predictions, but at the cost of making the overall model more complicated. Obviously just saying “the earth moves around the sun” greatly simplifies the whole thing, but first you need the insight to make this simplification possible.
I’ve found that AI agents are pretty bad at such dramatic simplifications (in other words, “LLMs can’t jump”). They will happily build one epicycle per bug until the code is a spaghetti mess. So a valuable part of AI code review is still to ask questions like “How can we make this simpler?” and “Is there a fundamental flaw with the codebase that we should fix before we tackle this class of bugs?”
Another technique that works well is to have good tests. (Easier said than done!) For example, when I was playing around with vibe coding the W3C IndexedDB API, it became pretty clear to me that an agent could just grind through the test suite, and if it got close to 100% then I could be reasonably certain to have a bug-free implementation. But the only reason this works is because the Web Platform Tests are a phenomenally good test suite, honed by years of independent browser implementers discovering odd bugs and adding test cases for every unlikely scenario you can think of. Most companies, in their first-party codebases, could only dream of such a test suite.
I can imagine, though, that if you’re building a system from scratch, and especially if your goal is to reproduce the output of an existing system, then you can get pretty far by just putting all your effort into the test suite and then letting the agent go nuts on the rest. PGRust seems to be having some success with this.
A third technique is to just simplify your system design so that whole classes of bugs become impossible. For example, I’ve long been an advocate for multi-page apps (MPAs) over single-page apps (SPAs), just because, with MPAs, entire bug categories simply don’t exist: breaking the back button, losing scroll state, leaking client-side memory, improper accessibility during page navigations, etc.
Of course you lose some power with a simpler system versus a complex one, and maybe a reasonable answer is to deliberately choose a more complex system while also just fixing all the bugs. I feel though that this would still have a tendency towards epicycles, and I would much rather read (or debug!) a codebase built on simpler principles rather than one built on complex ones, even if they both have the same overall bug posture.
Conclusion
It’s become cliché to note that we’re in unprecedented times, and that everybody is figuring out what exactly software engineering is supposed to look like when robots can do a good chunk of what used to be “the job.” And yet, it still remains worth saying. Whatever I wrote in this blog post may become outdated in a matter of months, and the next 5 AI-related articles you read on Hacker News will probably argue 5 different opinions. It’s a cacophonous mess, and I have low confidence that I’ve figured out all the answers.
What I’ve defaulted to is focusing on the short term: i.e. what are agents good at today, and where can humans still provide some value. Some people are running with the assumption that all concerns of code quality, complexity, and maintainability will be swept away someday by agents that can easily manage whatever baroque legacy system they’re handed. That may end up true, but I’m not going to bet on it because I haven’t seen it yet. For now, I’m still concerned about things like the DRY and KISS principles, keeping a working theory of the code in my head (ala Peter Naur), and trying to steer the agent toward better code quality.
I do think it’s interesting though, that we have a much greater ability to tackle more and more subtle bugs than we ever had before. Maybe this will lead to a reliability renaissance, or maybe it will lead to the same overall bugginess, just with more apps and more features in each app. I know that my personal preference is for greater software craftsmanship, but it remains to be seen how the software industry as a whole will step up to this challenge.
Footnotes
1. Technically, Copernicus’s system still had epicycles, and only Kepler managed to get rid of them. I think in some ways this makes the analogy stronger: in software, a re-architecture sometimes isn’t obviously better right away, and only shows its value over time.
The task isn't the job
The ability to execute tasks cheaply with AI makes it more vital than ever to focus on the human 'job'—deciding what is worth building.
Deep dive
- Executing tasks is becoming cheap and fast.
- 'Jobs to be Done' framework helps distinguish between helpful automation and unwanted replacement.
- Autonomy is a capability, not a strategic direction.
- Product management remains essential to avoid shipping implementations that users don't actually need.
- Intelligence should be treated as a 'ladder' to help non-experts achieve agency.
- The future of the industry lies in solving human problems, not just accelerating lines-of-code production.
Decoder
- Jobs to be Done (JTBD): A framework for understanding customer behavior that posits people 'hire' products to make progress in their lives, rather than buying features.
Original article
the task isn't the job
a new role, and some questions I want to build my way through
coding agents have given me the stupidest problem: I can now build three wrong things before lunch.
lines of code are a terrible measure of productivity etc etc, but they’re still a signal of what’s going on: tens of thousands of lines in a week, ideas tried in an afternoon that would’ve previously needed a few days of commitment, tests and docs and all the annoying little bits I would’ve solemnly promised to come back to later.
this is dope, genuinely! I like making things and now I can make more things.
buuuut my roadmap is’nt ten times shorter. and I’m definitely not ten times better at deciding what is worth building. teams haven’t started casually shipping a year of product work every month. you can look around and and it’s hard to say what software has gotten meaningfully better in the last year.
mostly tho, I seem to reach the difficult decisions faster. all the implementation that used to sit between these decisions has been squashed, so I can ask an agent to try three approaches and have all of them sitting in front of me before I’ve decided if the problem was worth solving.
are we mixing up the task with the job?
there’s a framework from clay christensen called “jobs to be done”. tl;dr: people don’t buy a product because they woke up wanting a product. they “hire” it to make some kind of progress in their life. almost nobody wakes up with the job “use an ai agent.” they want to figure out whether they can afford a house, make the thing they can see in their head, or organise a holiday with six friends without accidentally becoming the project manager of a small temporary company. the software/tool is an implementation detail (usually temporary). and the relationship with the machine changes depending on the Job To Be Done.
say I need thirty seconds of background music for a presentation. a machine that disappears for twenty seconds and returns with something usable has done a perfect job; I did not want to become a musician here.
but if I sit down because I want to make music, handing me the finished song is a fairly spectacular misunderstanding. I wanted to move the chords around, hear what happened, make it worse, change my mind, stumble onto the thing I didn’t know I was looking for. the process wasn’t “friction” on the way to the result. I really needed to tap into my first breakup and access the pain of adolescence for this chord structure, y’know? same artifact, completely different job.
I wrote recently about wanting the human and the agent to have their hands in the same “goo”, both able to reach into the thing being made. I still like that idea! but that could’ve turned it into a Grand Unified Theory of AI Interfaces, which it absolutely is not.
there are many things where I emphatically do NOT want my hands in the goo. please argue with the insurance company for me, chase the refund, reschedule the meeting across six calendars, fill out the form, and do not invite me into a Delightful Collaborative Experience with the God Computer.
the 12$ word “agency” sometimes means being involved, but it also means being able to make the whole fucking thing go away.
we tend to describe progress in agents as progress in autonomy: first they could do five minutes of work, then an hour, now we talk seriously about agents running for days. that’s impressive, but autonomy is a capability, not a product direction! the Job To Be Done tells you whether to use it. sometimes I want “do this for me,” sometimes “do this with me” or “show me how.” sometimes I just need enough of a boost to do something I couldn’t do before. or the AI could quietly become a feature so I don’t have to learn a new ritual involving prompts at all.
a cybernetic machine can nail the task and completely miss the job. coding makes this very very easy to see because the tasks are so legible (and verifiable!): write the function, migrate the API, fix the tests. models are extraordinarily good at this stuff and will get better still.
but a software team’s job was never “produce implementations.” the job includes noticing that users keep asking for the wrong thing because they don’t have the vocabulary for the right one. it includes deciding that two individually sensible features make the product worse together. it includes choosing between several perfectly defensible directions, getting other people to come with you, shipping one, and living with it. (as an aside, this is why I’m still pro “product manager” as a role, once you’ve worked with a great one, it’s clear how much absurd value they can bring to a team) maybe models get extremely good at all of that too; this is not a sneaky argument for some sacred category of Human Work™ that a machine can never touch. I’m just noticing that when one kind of work becomes cheap, you finally get a good look at the work hiding behind it.
if I may take a moment to make this personal:
cheap internet, open source software and free material for learning javascript changed my life. growing up in a small town in south india, I could learn without enrolling somewhere, make things without much money, put them on the internet, and eventually have people on the other side of the world care about them. I have a very strong emotional attachment to technology doing that.
there was, however, a fairly large entrance exam. I’ve spent an unreasonable amount of my life getting good at computers; it took obsession, time, luck, moving countries and cities, and a bunch of choices that gave work far more room in my life than many people could (or should!) give it. programming gave me enormous leverage, but first I had to become a programmer. so… what if the entrance exam could be smaller? not just “make programmers vastly better programmers”, but let many more people borrow the leverage of programming without reorganising their lives around becoming smelly programmers first.
I’ve been trying to write down what I actually want to spend my working life doing. this sort of exercise makes me want to crawl out of my own skin, but the phrase I landed on was turn intelligence into a ladder.
not bad. also suspicious of how much it sounds like something printed on a cloud provider’s tote bag.
another version of this is that making intelligence cheap does not automatically make “agency” cheap. people are constrained by time, money, confidence, health, education, institutions, family, geography; a model does not magic any of that away. there’s a perfectly believable future where these tools mostly compound the advantage of people who already have the skill, taste, money and the spare time to use them well.
“give everybody intelligence” is therefore not the only Big Problem to solve. we seem to be making decent progress there already. I’m more interested in whether intelligence can lower the prerequisites for agency? this is where Jobs To Be Done feels relevant. don’t start with “where can we put an agent?” start with the thing somebody is already trying to do. which parts are tedious? where are they blocked on expertise they don’t have? which parts are the actual reason they wanted to do it? what should disappear? what becomes possible?
sometimes more capability with less understanding is an excellent trade. sometimes saving no time at all is also a win, because the person finally made something that used to exist only in their head. there isn’t going to be one clean “agency” number that tells us whether we got it right.
these are the questions I want to spend more time on: what happens after execution gets cheap and plentiful? when do people want participation and when do they just want relief? which parts of expertise can disappear without leaving people helpless? how do we help people make new things, not just produce more of the things we already know how to ask for? and if this is meant to help people who aren’t already technologists, answering all of that by talking exclusively to AI researchers and software engineers would be very funny.
conveniently, I’ve just moved into a new role at work: builder in residence. part of the job is spending much more time outside the company walls - building in public, working with people at other companies/orgs, finding the bits that don’t work yet, bringing back what I learn. there are people and companies I admire enough that I’ve spent the last year wondering if I should go work with them. maybe now I’ll get to work with some of them anyway? (wink wink nudge nudge)
I also want to get just a bit further away from the centre of the technology industry. artists, teachers, musicians, parents, small businesses; people who are extremely good at jobs that do not involve staring at a terminal all day, and have no interest whatsoever in “agents”
I’m not going out to discover the future and report back; christ, that would be ridiculous. I have some questions, a few instincts, and some ideas I like enough to test - hopefully not enough to keep loving them when reality disagrees. mostly I want to build things with people and see which ideas survive. powerful creative leverage changed my life, and I’d like more people to get some version of it without having to live the life I did to get there. I don’t know what we need to build for that yet. seems like a good thing to go find out.
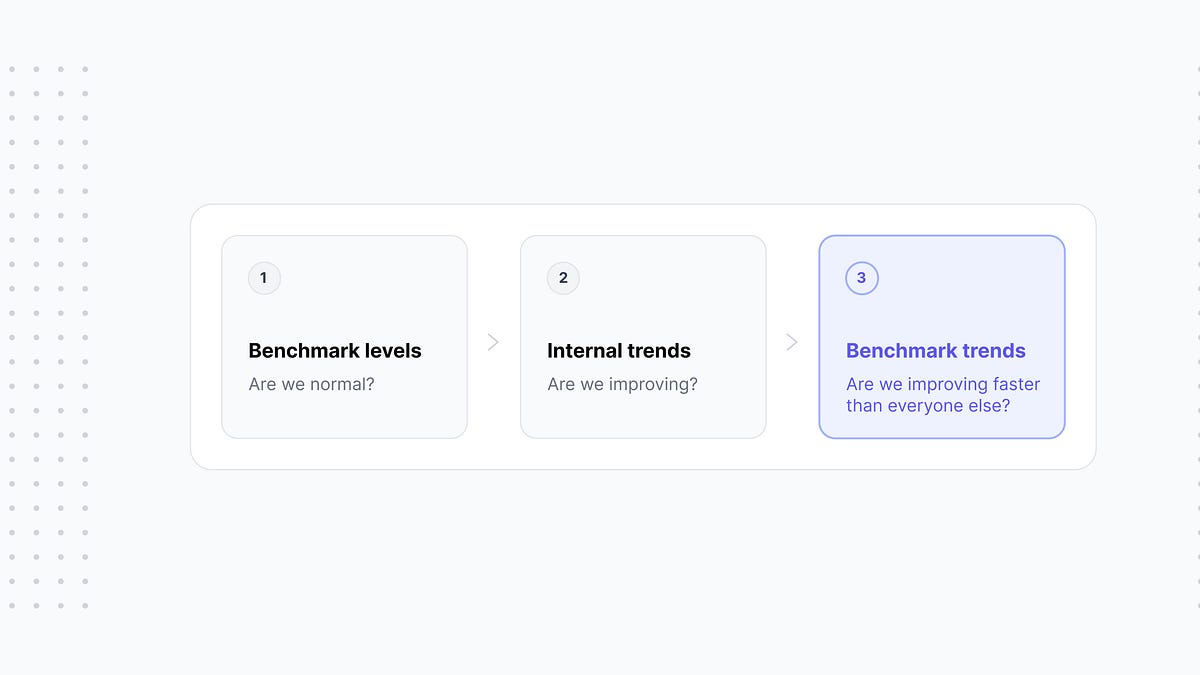
“Your benchmarks don't apply to us"
Industry benchmarks are less about 'being average' and more about tracking whether your team is improving faster than the broader ecosystem.
Deep dive
- Uniqueness bias often leads leaders to ignore benchmarks prematurely.
- Benchmarks answer 'Am I normal?'; trends answer 'Am I improving?'.
- Benchmark trends answer 'Am I improving faster than my peers?'.
- External forces like AI tools affect all organizations simultaneously.
- Co-movement of metrics across industries proves benchmarks track shared evolution.
- Consistency in metric definition is more important than absolute precision for trend analysis.
Decoder
- Uniqueness bias: A cognitive bias where individuals or organizations believe their situation is more exceptional than it actually is.
- Causal inference: The process of determining the independent effect of a particular phenomenon (like an AI tool) on a result, even without a controlled laboratory environment.
Original article
“Your benchmarks don't apply to us"
Why benchmark trends matter more than you think.
Welcome to the latest issue of Engineering Enablement, a weekly newsletter sharing research and perspectives on developer productivity.
DX’s updated 2026 engineering benchmarks are now available to all customers, with new Core 4 data across industries and geographies.
Many engineering leaders are right when they tell me that industry benchmarks don’t apply to them. They’re just wrong about what that means.
Most have already looked at a benchmark, compared it to their own numbers, and concluded the comparison isn’t useful. The mistake isn’t recognizing that their organization is different—it’s expecting a benchmark to answer a question it was never designed to answer.
Organizational context genuinely matters. Smaller engineering organizations consistently outperform larger ones on many metrics. Technology companies spend more time on new features than traditional enterprises. Mobile engineering has sufficiently different workflows that it warrants its own benchmark segment. Even survey response styles differ systematically across regions, making some absolute comparisons misleading.
The mix of factors goes far beyond things we can easily segment. Every engineering organization has its own governance model, release process, architecture, regulatory requirements, engineering culture, and history. Some require five approvals before deployment; others deploy continuously. Some invest heavily in internal platforms; others rely on commercial tooling. These choices can dramatically affect developer metrics, making two organizations within the same industry or size cohort look very different from each other.
Those differences are real, but they don’t make benchmarking useless. They simply mean we’ve been asking benchmarks to answer the wrong question.
Exec summary
- Engineering leaders are often right that benchmark values don’t directly apply to them, but they are wrong to dismiss benchmarks entirely.
- Benchmarks, internal trends, and benchmark trends each answer a different question:
- Benchmark levels → Are we normal?
- Internal trends → Are we improving?
- Benchmark trends → Are we improving faster than everyone else?
- The third question (“Are we improving faster than everyone else?”) is often the most important when evaluating investments like AI tools or process changes.
- Benchmark trends help separate your results from broader industry tailwinds (e.g., AI adoption, economic shifts).
- Benchmark values are still useful for identifying unusual performance and areas worth investigating.
- DX data shows metrics consistently move in the same direction across very different organizations year over year, suggesting organizations are less unique than they may believe.
- Changing metrics, survey instruments, or org structure mid-window makes it challenging to use benchmarks to measure change.
- Benchmark trends won’t prove causation, but they meaningfully reduce uncertainty about what would have happened anyway.
- The real value of benchmarks isn’t knowing if you’re average, it’s reasoning more carefully about change.
Benchmarks and trends answer different questions
Benchmarks and trends answer fundamentally different questions.
A benchmark answers: Is this normal? That question is often more valuable than we give it credit for. Knowing that your review latency or deployment frequency is unusual can help identify where deeper investigation is warranted, even if the benchmark itself doesn’t explain why. It tells you where you sit within a distribution. That’s a question about levels, and levels are influenced by things you may never be able to change like your industry, your size, your regulatory environment, your architecture, and the countless organizational decisions that shape how engineering gets done. Your own historical trend answers a different question: Are we improving? That’s a question about change. Because you’re comparing yourself to yourself, most of the differences that make your organization unique simply cancel out.
Both questions are valuable, but neither is the question engineering leaders usually care about most. The question they really want answered is: Are we improving faster or slower than everyone else? That’s a fundamentally different question, and it’s one that neither a benchmark nor an internal trend can answer on its own.
Suppose your deployment frequency improves by 15% over the next year. Is that good? If the rest of the industry improved by only 5%, you’re pulling ahead. If everyone else improved by 30%, you’re falling behind. In other words, improvement alone can’t tell you whether you’re pulling ahead or just keeping pace. Likewise, a benchmark can’t answer it by itself either. Knowing you’re at the 60th percentile today doesn’t tell you whether you’ve been gaining ground or losing it.
To answer the question leaders actually care about, you need both. That’s where benchmarks show their value, even for organizations that genuinely are unique. They don’t require your absolute metrics to be directly comparable to another company’s. They simply show you that the change in your organization can be interpreted alongside the change in everyone else’s.
And that, it turns out, is a far easier condition to satisfy.
Benchmark trends as an observational control group
The reason I find benchmark trends so valuable has very little to do with benchmarking. It has to do with causal inference.
Now suppose that 15% improvement in deployment frequency followed an investment in an internal developer platform. Was the platform responsible? Maybe. But maybe AI coding assistants became dramatically better during the same period. Maybe developer workflows improved across the industry. Maybe a slowing economy reduced feature work and increased engineering capacity everywhere.
A simple before-and-after comparison can’t distinguish between those explanations. That’s where benchmark trends really begin to shine. They don’t tell you what your metrics should have been; they tell you what happened to comparable organizations over the same period. They become an observational control group, a way of estimating the background improvement that would likely have occurred even if you had done nothing.
They’re not perfect. Organizations aren’t randomly assigned to different engineering strategies, and no benchmark population is identical to yours. My point is that they don’t have to be. If your deployment frequency improves 15% while comparable organizations improve 5%, that’s evidence that something beyond the broader industry trend may be happening inside your organization.
This is actually how measurement teams already communicate internally, even if they don’t describe it this way. When one engineering organization of roughly 3,000 developers adopted an AI agent to reduce live-site toil, the result wasn’t reported as the absolute changes in incident mitigation time. It was reported that mitigation time improved 2.4x faster than the company as a whole.
Nobody cared whether that organization’s services looked like the company average. The claim wasn’t about absolute performance. It was about relative improvement.
Your organization is less unusual than you think
At this point, there is still a reasonable objection.
Organizations don’t just differ in their absolute metrics, they also respond differently to new tools, new processes, and new ways of working. If every company has its own architecture, engineering culture, governance model, and technical debt, why should we expect benchmark trends to tell us anything useful at all?
I don’t think there’s a complete answer to that question, but I do think there is strong evidence that benchmark trends are more transferable than we expect.
Part of the reason is psychological. Researchers have studied our tendency to believe that our own situation is more unusual than it actually is. It’s called uniqueness bias. Organizations can fall into the same trap. Every company has a list of reasons why their engineering organization is unlike everyone else’s, and many of those reasons are legitimate. Organizational theorists have argued for decades that organizations facing similar environments tend to converge in their structures and practices, despite many local differences.
I’ve seen this in DX’s own benchmark data, and the pattern keeps repeating year after year. In our 2025 benchmarks, change confidence improved across every segment, with the median rising more than 12 points. Cross-team collaboration declined across every segment. In 2026, different metrics told the same kind of story. Documentation improved across every segment and customer focus rose across all of them, while review turnaround and incremental delivery declined across most.
These segments differ by size, by sector, and by geography, and their absolute values differ substantially. Yet year after year they move in the same direction at roughly the same time. If organizational context dominated the way the uniqueness objection assumes, we would expect these trajectories to diverge. Mostly they don’t. Those organizations weren’t identical, but they were responding to many of the same underlying forces.
It should be noted that direction and timing are shared, magnitude isn’t. Segments improved on the same metrics in the same years without improving by the same amounts, and individual organizations within a segment vary more still. Benchmark trends need both properties. Shared direction is what makes the baseline trustworthy. Dispersion around it is where your own signal lives. A control group is useful precisely because it behaves predictably, and the same is true here. Co-movement isn’t evidence that there’s nothing left to detect. It’s what makes detection possible.
This isn’t unique to engineering metrics, either. Economists routinely compare countries with different political systems, cultures, and industrial structures. Healthcare researchers compare hospitals serving very different patient populations. Education researchers compare schools with very different student demographics. None of these comparisons are randomized experiments, and none produce perfect control groups. Yet they’re still valuable because the alternative is to assume that nothing else in the world changed while your intervention took place.
I don’t think benchmark trends eliminate that uncertainty, but I do think they substantially reduce it. They’re not a replacement for understanding your own organization. They’re a way of putting your organization’s improvement into context.
You can’t trend against a moving ruler
Aligning to this way of thinking does change some of the advice we’ve historically given. We’ve encouraged organizations to improve their benchmark position over time, and I still think that’s good advice. Absolute benchmark values provide valuable context. They help answer whether your organization looks unusual relative to similar organizations, identify potential areas of opportunity, and highlight where deeper investigation might be worthwhile.
But once you understand where you stand today, the more interesting question becomes whether you’re improving faster than the background trend.
That distinction matters because organizations don’t improve in isolation. New tools, changing engineering practices, AI adoption, and broader industry shifts all influence engineering metrics over time. Benchmark trends help separate improvements that are happening everywhere from improvements that may reflect something unique about your organization.
This also explains why organizations that don’t trust absolute benchmark values shouldn’t dismiss benchmark data entirely. Even if your architecture, culture, or regulatory environment makes direct comparisons difficult, organizations facing similar external forces can still provide valuable context for understanding how quickly the world around you is changing.
That said, comparing changes only works for the things that hold still. If you reorganized, acquired a company, or changed how you count engineers during the same window, those differences don’t cancel either, and your trend becomes as hard to interpret as your levels were. Changing a metric definition or a survey instrument partway through does the same damage. You can’t trend against a moving ruler, which is why, for trend analysis, consistency in how you measure matters more than precision in what you measure.
None of this makes benchmark cohorts less important. The better your comparison group, the better your estimate of that background trend.
Absolute benchmarks tell you where you are. Internal trends tell you whether you’re improving. Benchmark trends help answer whether you’re improving faster than you would reasonably have expected.
What we still don’t know
I can’t yet prove that benchmark trends consistently produce better decisions than benchmark levels alone. I also don’t know which comparison groups produce the most useful estimates of background improvement, or how similar two organizations need to be before their trends become informative.
Those are empirical questions, and I think they’re worth studying.
My intuition is that benchmark trends won’t eliminate uncertainty. They simply provide another source of evidence. Like any observational control, they’re imperfect. But imperfect evidence can still improve decision making when it’s interpreted appropriately.
Final thoughts
Benchmark trends aren’t a replacement for internal metrics, experiments, or randomized trials. Whenever we can run controlled experiments, we should.
But most engineering organizations don’t make decisions under laboratory conditions. We launch AI coding assistants to everyone at once. We reorganize teams. We change review processes. We invest in developer platforms. We rarely have the luxury of a true control group.
That means engineering leaders spend much of their time making decisions from imperfect evidence.
Benchmark trends make that evidence meaningfully stronger. They don’t eliminate uncertainty. They don’t prove causation. They don’t guarantee that one intervention caused another outcome. They simply provide a better estimate of what might have happened anyway.
To me, that’s the real value of benchmarks. Not because they tell us whether we’re average. But because they help us reason more carefully about change.
That’s it for this week. Thanks for reading.
-Brian
Evaluating AI Agents as Products
Standardized AI coding benchmarks are failing; developers should shift toward product-based evaluation tasks that account for human interaction, judgment, and taste.
Deep dive
- Traditional coding benchmarks (e.g., SWE-Bench) are saturating, making them poor predictors of tool utility.
- Success in real-world development is increasingly defined by 'taste' and the ease of iterative human-in-the-loop collaboration.
- Claude Opus 5 with Claude Code demonstrated the highest intelligence but suffered from 'co-worker friction' due to excessive, non-requested background testing.
- Smaller models (Qwen, Laguna, Muse) are capable but require more steering and suffer from inferior design judgment.
- The author proposes using interactive tasks—where agents must build tools to solve specific problems (e.g., annotating python errors or ranking SVGs)—as a more accurate proxy for agent quality.
- Efficiency is best measured by user turn count and the degree of manual steering required, rather than token count alone.
- Agent autonomy vs. obtrusiveness is a key trade-off that determines day-to-day productivity.
Decoder
- SWE-Bench: A common benchmark consisting of real GitHub issues that AI agents must resolve.
- Human-in-the-loop (HITL): A model of interaction where a human guides, critiques, or corrects AI output during the process to ensure the final result meets specific, subjective requirements.
- Quantization: The process of reducing the precision of model weights (e.g., from 16-bit to 4-bit or 8-bit) to reduce memory usage and allow models to run on consumer hardware, often at the cost of some performance.
- Stochastic Parrot: A critique suggesting that LLMs merely repeat patterns without true understanding, though the author notes recent advances are challenging this.
Original article
Full article content is not available for inline reading.
Argo Workflows 4.1
Argo Workflows 4.1 introduces OpenTelemetry support and Kubernetes Device Resource Allocation, significantly updating its infrastructure management and monitoring capabilities.
Decoder
- DRA (Dynamic Resource Allocation): A Kubernetes API allowing plugins to manage and assign specialized hardware like GPUs to pods dynamically.
Original article
Argo Workflows 4.1 adds OpenTelemetry tracing, improved resource and artifact management, GPU and device allocation through Kubernetes DRA, stronger database authentication and reliability, expanded CLI capabilities, UI enhancements, and reduced controller memory usage.
How to Run Terraform in Bitbucket Pipelines
Automating Terraform in Bitbucket Pipelines requires a custom YAML workflow utilizing Docker containers, OIDC identity federation, and AWS S3 state management.
Decoder
- OIDC (OpenID Connect): An identity layer on top of OAuth 2.0 that allows services like Bitbucket to assume temporary AWS roles without storing static credentials.
Original article
How to Run Terraform in Bitbucket Pipelines
Automating your processes is a key best practice when working with Terraform, OpenTofu, and similar tools for infrastructure as code. This gives you a consistent workflow for all changes to the infrastructure you manage using these tools. Two common approaches are:
- Use a dedicated infrastructure automation platform such as Spacelift or HCP Terraform
- Use a generalized automation tool where you can build your own automation workflows.
The second option often involves using features available on a version control and collaboration platform such as GitHub, GitLab, or Bitbucket. In this blog post, we will cover an option in the second category of automation tools: how to run Terraform in Bitbucket Pipelines.
Note that this blog post covers how to run Terraform in Bitbucket Pipelines, but the steps are also applicable to OpenTofu with minor changes (e.g., use the OpenTofu binary instead of the Terraform binary).
To run Terraform in Bitbucket Pipelines, you define your pipelines in a single bitbucket-pipelines.yml file at the root of your repository. Bitbucket Pipelines is Bitbucket Cloud’s built-in CI/CD service, and every step runs in a fresh Docker container, so you choose an image such as hashicorp/terraform and script the Terraform commands yourself.
What are Bitbucket Pipelines?
Bitbucket Cloud, or simply Bitbucket, is a software-as-a-service (SaaS) collaboration platform for source code. Bitbucket is part of the Atlassian suite of products and integrates well with Jira and Confluence, which many organizations use for project management and documentation.
Bitbucket was previously available as a single-instance, self-hosted product called Bitbucket Server, but Atlassian discontinued support for it in February 2024. If you want to host Bitbucket yourself, an alternative product called Bitbucket Data Center continues to be supported. Bitbucket Data Center is designed for high availability and is intended for larger deployments.
One of Bitbucket’s features is the built-in continuous integration and continuous delivery (CI/CD) service, Bitbucket Pipelines.
With Bitbucket Pipelines, you can define pipelines that should run when you push code to branches, when you open or update a pull-request, on a schedule, manually, and more. Your pipelines can include arbitrary scripts that perform steps such as building an application, migrating a database, scaling up a virtual machine, provisioning infrastructure with Terraform, and much more.
Pipelines are defined as code in a file named bitbucket-pipelines.yml, and each pipeline step is executed in a fresh Docker container. You can use an existing Docker image from a container registry or use your own custom images.
Bitbucket Pipelines is a natural choice for automation if your source code is hosted on Bitbucket.
How to run Terraform in Bitbucket Pipelines
In this section, we will describe how to enable and run Terraform in Bitbucket Pipelines for an existing Bitbucket repository. The prerequisites for following this walkthrough are:
- Access to a Bitbucket Cloud workspace
- Access to at least one repository where you can configure a pipeline and run Terraform
- Administrator access to an AWS account and an S3 bucket for state storage
In the following sections, we will build a few basic pipelines for running Terraform, with the aim of achieving the following:
- Provision infrastructure on AWS.
- Use an AWS S3 state backend.
- Use OIDC workload identity to authenticate to AWS for state management and provisioning.
- Run init, fmt, validate, and plan commands for every push to a feature branch and every pull request targeting the main branch.
- Run
init,planandapplyfor every commit to the main branch.
Enable Bitbucket Pipelines for a repository
First, we need to enable Bitbucket Pipelines. Bitbucket Pipelines are disabled by default. You enable pipelines by manually committing a file named bitbucket-pipelines.yml or using the wizard in the UI.
Your first pipeline run must be triggered manually. After committing the bitbucket-pipelines.yml file to the repository, go to the “Pipelines” section of your repository and you will see the following view. Click on “Run initial pipeline” to get started. The following runs will be triggered automatically based on the trigger events you have defined in your pipelines.
Define your pipelines in bitbucket-pipelines.yml
You can configure one or more pipelines for your Bitbucket repository using YAML configuration in a file named bitbucket-pipelines.yml. The file must have this exact name, and it must be placed in the root of your repository. You can only have one pipeline file per repository.
We begin by specifying which Docker image we want to use for the steps of our pipelines.
image: hashicorp/terraform:1.15.7Next, we define reusable steps for fmt, validate, plan and apply that we can include in the pipelines we will define later. We add these steps under definitions.steps using YAML anchors.
Configuring the S3 Terraform backend
To configure the AWS S3 state backend, add the following code under the definitions section of your pipeline:
definitions:
  scripts:
    - &tf-init >
      terraform init -input=false
        -backend-config="bucket=${TF_STATE_BUCKET}"
        -backend-config="key=${TF_STATE_KEY}"
        -backend-config="region=${AWS_DEFAULT_REGION}"
Go to your repository settings and click on “Repository variables”, then configure TF_STATE_BUCKET, TF_STATE_KEY, and AWS_DEFAULT_REGION with values corresponding to your bucket.
Configuring AWS OIDC authentication
We want to use the OIDC workload identity federation feature to achieve this. The benefit of this authentication mechanism is that we do not have to deal with long-lived credentials.
The first step is to go to your repository settings and click on “OpenID Connect”. Copy the values for the Identity provider URL, Audience, Workspace UUID, and Repository UUID.
In the bitbucket-pipelines.yml file, add another reusable script definition for OIDC:
definitions:
  scripts:
    - &oidc-setup >
      echo "$BITBUCKET_STEP_OIDC_TOKEN" > /tmp/web-identity-token &&
      export AWS_ROLE_ARN="$AWS_ROLE_ARN" &&
      export AWS_WEB_IDENTITY_TOKEN_FILE=/tmp/web-identity-token
Best practices for running Terraform in Bitbucket Pipelines
1. Use OIDC authentication if your Terraform provider supports it
If your target platform supports authentication with OIDC workload identity federation, you should always use this method of authentication to avoid managing long-lived credentials.
2. Use the built-in secrets management feature
Manage secrets by marking a variable as sensitive in your repository variables. Sensitive variables will not be exposed in the pipeline logs.
3. Define reusable steps and scripts
YAML anchors allow you to easily build reusable steps and scripts for composing your pipelines, ensuring a consistent experience.
4. Add concurrency control
If you have one or more steps that should not run at the same time, you can add them to a concurrency-group to avoid locked Terraform state file issues.
5. Use pipeline deployments for multiple environments
You can configure each deployment with unique variable values, allowing you to use different Terraform state backend configurations and authentication details for each environment.
Frequently asked questions
-
Why use Bitbucket Pipelines for Terraform?
Bitbucket Pipelines runs Terraform builds directly inside Bitbucket Cloud, so teams already using Jira and Confluence avoid adopting a separate CI/CD tool. It supports Docker-based runners, deployment environments for scoped secrets, and manual approval steps.
-
How do I authenticate to AWS from Bitbucket Pipelines?
Use OpenID Connect (OIDC): register Bitbucket as an identity provider in AWS IAM, create a role with a trust policy scoped to your workspace or repository, then set oidc: true on the step so STS exchanges BITBUCKET_STEP_OIDC_TOKEN for short-lived credentials.
-
What's the difference between Bitbucket Pipelines and GitHub Actions for Terraform?
Bitbucket Pipelines is Atlassian’s built-in CI/CD tied to Bitbucket Cloud, while GitHub Actions is a marketplace-driven workflow engine native to GitHub.
-
Is Bitbucket Pipelines free for Terraform workflows?
A free tier is available with 50 build minutes per workspace each month, enough for light experimentation.
Needle (GitHub Repo)
Needle 2 is a 45-million-parameter tool-calling model that fits into a 14MB binary and operates within 28MB of RAM for constrained edge environments.
Decoder
- Quantization: The process of reducing a model's precision (e.g., from 16-bit to 2-bit) to decrease memory usage and increase speed, usually with minimal accuracy loss.
Original article
Needle 2
Needle 2 is an open 45M-parameter model for tool calling, device use and structured extraction. The whole model is a single 14MB binary that runs a full session in about 28MB of RAM. It is built on our Simple Attention Network findings, compressed to CQ2-bit with Cactus Quants, and baked into its own engine. On the benchmarks below, Needle 2 trades wins with other small models like FunctionGemma 270M, LFM2.5 230M and Apple FM, at 5x to 70x smaller, and 2 bits against their f16.
This repository is the Python package: inference, LoRA fine-tuning, and export. pip install cactus-needle, describe your tools, and call them from Python. The inference engine is fetched once from Hugging Face and cached; there is nothing else to build, and offline setup for air gapped devices is covered in doc/apis.md.
- Self-contained: weights baked into a single 14MB engine; no separate model files to manage, and inference does no network.
- Simple contract: tool calls come back as structured data, text in, JSON out; a byte-level grammar compiled from your schemas constrains every token.
- Confidence-gated: every response carries a calibrated confidence score from a learned head; set a threshold, act above it, escalate below it.
- Tool retrieval: declare a large catalogue and a built-in retrieval head renders only the top five tools per turn, with the grammar constrained to that subset.
- Bounded memory: a 256-token sliding window with the tools pinned as KV sinks, so total memory stays near 28MB no matter how long the conversation runs.
Weights: huggingface.co/Cactus-Compute/needle2 · source: github.com/cactus-compute/needle.
Simple Attention Network
Needle 2 is a Simple Attention Network, our dense small-model recipe: a Hadamard MLP in place of the FFN, GQA attention, engram key-value memory, and multi-lane hyper-connections. See the paper for the design and ablations: arXiv:2607.18363.
Each block carries its update rule. Here x̂ is the RMS-normalised flattening of the four residual streams, H the orthonormal Walsh-Hadamard transform (a fixed matrix, applied in n log n time with no weights to read), (kₜ, vₜ) rows gathered from hashed n-gram tables, and P the doubly-stochastic normalisation of the routing logits A, computed by Sinkhorn iteration; a, b, g and all σ-gates are learned and input-dependent. Both attention and MLP residuals are sandwich-normed and gated, the engram sites fire at two layers, and decoding is constrained by a byte-level grammar compiled from the declared schemas.
Quickstart
pip install cactus-needleNeedle reads your tool descriptions to decide what to call and how to fill arguments, so describing them well is the whole game.
Simple: decorate a function. The signature gives the argument types, the docstring is the tool description, and run() completes the loop: model picks the call, Needle executes your function, feeds the result back, and returns the final response with the executed tool results attached as results.
import needle

@needle.tool
def get_weather(city: str):
    "Get the current weather for a city."
    return {"city": city, "temp_c": 27, "sky": "clear"}

agent = needle.Needle(tools=[get_weather])
print(agent.run("what's it like in Lagos right now?")["results"])
# [{'city': 'Lagos', 'temp_c': 27, 'sky': 'clear'}]Extraction: to pull structured data out of text, declare the shape and call extract(). Pass a Pydantic model and you get a typed object back.
from pydantic import BaseModel

class Invoice(BaseModel):
    vendor: str
    total: float
    due_date: str

invoice = needle.extract("Invoice from Acme Corp, $1,200.00, due 2026-09-01", Invoice)
print(invoice.vendor, invoice.total)   # -> Acme Corp 1200.0
Per argument descriptions and choices, value constraints compiled into the decode grammar, raw JSON schemas, driving the loop with complete(), the response contract, system facts, tool retrieval, and confidence gating are all covered in doc/apis.md.
Playground
Try any model in the browser: pick a preset, edit the tools or prompt, and Run. Follow-up queries continue the same conversation.
needle playground                      # base model, http://127.0.0.1:7860
needle playground --weights my.cact    # a tuned model
The server downloads and initializes the model before serving, so the first query is instant. The Finetune on these tools button runs the fine-tuning pipeline below from the UI and hands back a downloadable .cact.
Fine-tuning
Needle fine-tunes with LoRA on the frozen base and merges the adapter at export, so a run is cheap and the tuned model is still a single .cact that runs on the same engine. The workflow is: (optionally) synthesize data, LoRA fine-tune, then build a tuned .cact. See doc/finetuning.md for dataset sizing, reading the loss curve, and troubleshooting.
Data format. A JSONL file, one example per line. reasoning is optional; an off-topic example has answers: [].
{"query": "dim the kitchen to 10", "tools": [{"name": "set_lights", "parameters": {"type": "object", "properties": {"room": {"type": "string"}, "brightness": {"type": "integer"}}, "required": ["room"]}}], "answers": [{"name": "set_lights", "arguments": {"room": "kitchen", "brightness": 10}}], "reasoning": "'kitchen' -> room; 'dim to 10' -> brightness 10"}1. Synthesize data (optional). Needs OPENROUTER_API_KEY. Seed from a tool schema file, or expand an existing set:
export OPENROUTER_API_KEY=sk-or-...
needle generate-data --tools my_tools.json --num-samples 500 --output data.jsonl
needle generate-data --augment data.jsonl --num-samples 500      # expand an existing JSONL
Set OPENROUTER_URL to use an OpenAI-compatible gateway instead of the default OpenRouter endpoint.
2. LoRA fine-tune. The base checkpoint auto-downloads from Hugging Face if you do not pass --checkpoint. --generate N first synthesizes N more examples from the tools in your data (also needs OPENROUTER_API_KEY).
needle finetune data.jsonl --epochs 10
needle finetune data.jsonl --epochs 10 --generate 300 --lora-rank 16 --lora-alpha 32
Key options: --epochs (default 3), --lora-rank (16), --lora-alpha (32), --lr (1e-4), --batch-size (16), --max-len (1024), --val-split (0.1), --checkpoint <base.pkl>, --out <adapter.pkl>. The adapter is written to checkpoints/needle_lora.pkl. A validation loss prints each epoch from the held out split.
Training is plain JAX and runs on any accelerator jax supports. On an NVIDIA machine install the CUDA build and the same command trains on the GPU:
pip install "cactus-needle[gpu]"On Apple Silicon the metal extra trains on the GPU:
pip install "cactus-needle[metal]"3. Build a tuned .cact. Merge the adapter into the base and quantize. The base auto-downloads if absent.
needle build checkpoints/needle2.pkl --lora checkpoints/needle_lora.pkl --out my_needle.cactAdd --bits 2 for a smaller model (by default the export follows the checkpoint's declared per-layer bit map, falling back to 4 when the checkpoint declares none), or set NEEDLE_HF_REPO=<you>/<model> and pass --upload to publish the .cact. The counterpart needle download <you>/<model>/my_needle.cact pulls a published archive on any machine.
4. Run it. The engine is weights-agnostic, so a tuned .cact runs on it directly - no recompilation:
import needle
agent = needle.Needle(weights="my_needle.cact", tools=[...])
agent.run("...")
Citation
Needle 2 is built by the Cactus Compute team. If you use it in your work, please cite:
@misc{needle2_2026,
  title        = {Needle 2: A 45M-Parameter Foundation Tool-Calling Model for Tiny Devices},
  author       = {Ndubuaku, Henry and Mosoyan, Karen and Mroz, Jakub and Cylich, Noah and
                  Kumar, Satyajit and Sandhu, Parkirat and Shemet, Roman and Lee, Justin H.},
  year         = {2026},
  organization = {Cactus Compute, Inc.},
  howpublished = {\url{https://github.com/cactus-compute/needle}}
}Unsloth (GitHub Repo)
Unsloth offers a local execution and training environment for AI models, featuring a new 'Unsloth Start' command to connect coding agents to local models.
Original article
Full article content is not available for inline reading.

Docker Desktop Gets a Hypervisor of its Own
Docker is replacing third-party virtualization layers in Docker Desktop with an internally developed, unified virtual machine manager to ensure consistent cross-platform performance.
Deep dive
- Docker is building a proprietary VMM to replace diverse third-party virtualization dependencies.
- The new VMM aims to improve I/O performance, memory efficiency, and startup times.
- Currently in beta (v4.86) for Windows and macOS; Linux support arrives at general release in October.
- Aims to solve cross-platform inconsistencies that occur when migrating container environments.
- Uses technology initially tested for isolated Docker Sandbox environments (AI agents).
- The shift allows Docker to tune the engine backend specifically for container runtime characteristics.
- Intended to streamline local development as usage remains high (36% of all container development).
Decoder
- VMM (Virtual Machine Manager): A software layer that enables a host machine to run multiple guest operating systems or isolated environments by managing hardware resource access.
- Hyper-V: Microsoft’s native hypervisor for Windows systems.
- libkrun: A virtualization library based on KVM designed for secure, isolated execution, often used on Apple Silicon hardware.
Original article
TL;DR — Key Takeaways
- Docker is introducing a unified Docker VMM designed to deliver more consistent Docker Desktop performance across macOS, Windows and eventually Linux.
- The new virtualization layer is intended to reduce cross-platform inconsistencies while improving startup times, recovery, I/O performance and memory efficiency.
- Docker VMM is available in beta with Docker Desktop v4.86 on Windows and macOS, with Linux support expected when the technology reaches general availability.
Docker is bringing full backend parity across all of its Docker Desktop editions, ensuring that macOS, Windows, and (eventually) Linux users get the same performance and polish.
The company unveiled a new virtual machine manager (VMM), a fresh VM platform for its Docker Desktop container management environment that will eventually natively drive all the platforms Docker supports.
Current users of the Windows and macOS software can now test the new edition in beta form, with Docker Desktop v4.86, but Linux users will have to wait until the software’s general release in October.
Docker Containers Run Everywhere
Docker’s selling point has always been to build a container once and have it run anywhere, no matter if it’s a Windows, Mac or Linux environment, either on desktops or on production servers.
The Docker Engine sits in a VMM, and underneath are the local networks and file systems that the VMM wrangles with. If it works, you don’t notice it.
To date, Docker Desktop for Windows and Macs have relied on third-party VMMs – libkrun for Apple gear and Hyper-V or the Windows Subsystem for Linux for Windows. The Linux version itself is built on KVM and QEMU. This fragmented approach inevitably led to minor inconsistencies and hiccups as users move work between platforms.
Docker internally built Docker VMM from the ground up, specifically to work the same way across platforms and address the particular issues that come with cross-platform container operations. The company first tested the technology on Docker Sandboxes, an isolated environment built for AI agents.
“That means we own the full stack, and we can tune every part of the engine for container workloads specifically,” wrote Docker senior product managers Deanna Sparks and Colin Hemmings in a blog post announcing the release.
In practical terms, this new unified VMM will minimize a lot of cross-platform flakiness, the company claims.
Startup times and recoveries will happen faster. I/O will be smoother as well. This means that file sharing between an application within the container and the host will have fewer bumps.
The Desktop will be kinder to the host computer as well, releasing memory back to the machine when containers are idle.
“When you’re in an edit-compile-test loop, you’ll see improvements every single build,” the Docker managers wrote.
A Diverse User Base
The updates address the variety of ways developers are now using Desktop. Users are increasingly moving to cloud-based developer environments, but about 36% of Docker development is still done on local machines, such as the developer’s laptop, according to the 2025 Docker State of Application Development, the most recent release of the report.
Of those developers still creating and maintaining containers on their local devices, platform preference is split pretty evenly.
Linux is still the most popular platform for Docker, which 53% of the users deploy. But many also use macOS, which 51% of developers use. Windows is also a choice, used by 47% of developers. These numbers add up to more than 100% given that developers can use more than a single platform.
For Docker, this proliferation of platforms means the company must work hard to maintain an equal Docker experience across all platforms.
Docker Desktop is free for personal use, and begins at $11 a month ($9 a month billed annually) for professional plans. Team plans are also available.
Frequently Asked Questions
What is Docker VMM?
Docker VMM is Docker’s new virtualization layer for Docker Desktop. It is designed to provide a common backend architecture across supported operating systems.
Which platforms support Docker VMM?
The beta is available for Docker Desktop users on Windows and macOS. Linux support is planned for the general release.
Why is Docker replacing its existing virtualization approach?
Docker Desktop has historically relied on different virtualization technologies depending on the host operating system. A unified VMM should reduce platform-specific inconsistencies and make performance more predictable.

AI Software Development – What Does The Data Say?
Industry data suggests that AI coding assistants amplify existing team strengths and weaknesses but often result in longer shipping times and lower-quality software.
Deep dive
- Output volume (code, commits) is increasing, but delivery outcomes and software quality are often stagnating or declining.
- Long-horizon autonomous agent reliability remains closer to science fiction than current reality.
- LLMs face "attention dilution" in large contexts, where relevant information is lost to the model.
- Repository-level instruction files can introduce more noise than signal.
- Confidence in AI output has been found in some studies to correlate with belief in the paranormal.
- AI reliance may be negatively impacting critical thinking, learning, and developer well-being.
- Future reliability improvements will likely depend on context engineering rather than just model scaling.
Decoder
- Context Engineering: The practice of strategically filtering and formatting information provided to an LLM to maximize accuracy and minimize noise.
- Attention Dilution: A phenomenon where an LLM's internal mechanism for weighing input tokens struggles to distinguish signal from background noise in massive context windows.
- Dominant Priors: Information encoded in model weights during training that overrides conflicting or newer information provided in the user prompt.
Original article
I’m currently pulling together a bunch of sources – that are mostly recent – on the topic of LLMs and their use in software development.
Some are peer-reviewed studies. Some are industry studies that haven’t been peer-reviewed.
One is statistical physics. Expect more from that angle. Wanna’ know the limits of a technology? Ask a physicist.
One is just a blog post, but very useful information about the effect of context size.
Most are corroborated by personal experiments and also observations on teams. As time goes on and more data comes in, my picture comes more into focus.
Before I cite the sources, a quick executive summary for all you busy executives out there:
- Truly autonomous and reliable long-horizon agentic software development is so highly improbable using LLMs that it’s essentially science fiction.
- The maximum effective context limits of LLMs – including hyperscale “frontier” LLMs – beyond which model outputs become unusably inaccurate is orders of magnitude smaller than advertised limits. The most common mechanism for extending inference over large contexts is what vendors call “compression”. This means that parts of the context are summarised by the model, which is a famously unreliable/lossy process.
- LLMs cannot distinguish between recent and out-of-date information in the context, and information in the model itself, learned during training (“dominant priors”), can often “outweigh” information we give it. To an LLM, it’s all just tokens, weights and probabilities. Right, wrong, new, old – the highest probability wins. Big contexts and “attention dilution” – where probabilities in the context become too small to compete with the ones in the model – are likely to make these effects worse.
- Repo-level .md files tend to make model performance worse, probably because they add noise instead of signal in many specific tasks. Model-generated .md files are especially problematic in this respect, it seems. Upshot: including your team’s coding standards and an architecture summary for every task is probably counterproductive.
- LLMs struggle with negation. Telling them not to do something can often have the same effect as telling them to do it. In case you were wondering why some of your guardrails are about as reliable as a coin-toss.
- LLM inference is more accurate when we give them examples (demonstrations) rather than just describing what we want. They’re pattern-matchers. Show them the patterns – more “like this” and less “do this” (and no “don’t do this”).
- Large/long-scale industry studies show a clear trend – output is up (more code, more commits, bigger diffs), but outcomes don’t reflect that trend. If anything, the average team is taking longer to ship worse software. If ever we needed proof that software development isn’t a production process… Some studies find a small % of teams getting modest gains in outcomes, and correlate that with their existing software development capability. AI coding is an amplifier of, not a fix for, development strengths and weaknesses.
- The psychological and cognitive factors in LLM use are a growing field of serious research. One study found a significant correlation between confidence in AI output and belief in the paranormal. Multiple studies found a negative impact on learning, cognition and critical thinking with greater LLM reliance. New research suggests that reports of developers feeling demotivated and burned-out with extensive use may have some real truth behind them.
- Deep neural networks, including LLMs, struggle to learn patterns with long-range dependencies, at any scale of model. They will always be “driving in fog”, with local, short-range probabilities crowding out long-range ones. In case you were wondering why they suck at the “big picture” – probabilistically, it’s a blur.
- The energy and compute needed to train an LLM to be an order of magnitude more reliable – e.g., wrong 3% of the time instead of 30% – is 10^20 times what the current frontier models require. Don’t expect significantly more reliable models any time soon. Any future gains in reliability will have to made by better context engineering (deciding what to include in the input) and more effective quality gates deciding what to do with the output- and that’s exactly what we’re seeing AI companies focusing on these days. Models may get more powerful, but not significantly more reliable. This it folks – work with what you’ve got!
- Some AI champions will protest research that points to no significant improvements in model performance by pointing to the many published benchmarks that do indeed show LLMs getting better and better. But other research finds that we might wish to be more skeptical of benchmark performance, partly because many of the most popular ones measure what’s easy to measure algorithmically – and in that sense, they’re not really like real-world problems which are messy and unpredictable – and also because… well, the words “published benchmarks” are a bit of a clue. Perhaps inadvertently, but maybe even knowingly, increasingly models are being “trained to the test”. If it’s out there, then it’s probably in there.
Code Evolution & Long-Horizon Agentic Workflows
SWE-CI: Evaluating Agent Capabilities in Maintaining Codebases via Continuous Integration
https://arxiv.org/abs/2603.03823
SlopCodeBench: Benchmarking How Coding Agents Degrade Over Long-Horizon Iterative Tasks
https://arxiv.org/html/2603.24755v1
SWE-Milestone: Evaluating AI Agents on Continuous Software Evolution
https://arxiv.org/abs/2603.13428
Benchmark vs. Real-World Performance
Measuring what Matters: Construct Validity in Large Language Model Benchmarks
https://arxiv.org/abs/2511.04703
Research Update: Algorithmic vs. Holistic Evaluation (METR)
https://metr.org/blog/2025-08-12-research-update-towards-reconciling-slowdown-with-time-horizons/#background
Evaluation data contamination in LLMs: how do we measure it and (when) does it matter?
https://arxiv.org/abs/2411.03923
Context Engineering
Context Is What You Need: The Maximum Effective Context Window for Real World Limits of LLMs
https://arxiv.org/abs/2509.21361
Beyond RAG vs. Long-Context: Learning Distraction-Aware Retrieval for Efficient Knowledge Grounding
https://arxiv.org/abs/2509.21865
Evaluating AGENTS.md: Are Repository-Level Context Files Helpful for Coding Agents?
https://arxiv.org/abs/2602.11988
The Hidden Science Behind LLM Token Limits (And How Million-Token Models Actually Work)
https://www.ashisharora.ai/post/the-hidden-science-behind-llm-token-limits-and-how-million-token-models-actually-work
Language models are not naysayers: An analysis of language models on negation benchmarks
https://arxiv.org/abs/2306.08189
Rethinking the Role of Demonstrations: What Makes In-Context Learning Work?
https://aclanthology.org/2022.emnlp-main.759
STALE: Can LLM Agents Know When Their Memories Are No Longer Valid?
https://arxiv.org/abs/2605.06527
Task Matters: Knowledge Requirements Shape LLM Responses to Context–Memory Conflict
https://aclanthology.org/2026.findings-acl.202
Large-scale Industry Studies in Software Engineering
What 28 million workflows reveal about AI coding’s biggest risk (CircleCI)
https://www.linkedin.com/pulse/what-28-million-workflows-reveal-ai-codings-biggest-risk-circleci-j9syc/
The Acceleration Whiplash – AI Engineering Report 2026 (Faros)
https://www.faros.ai/research/ai-acceleration-whiplash
State of AI-assisted Software Development 2025 (DORA)
https://dora.dev/research/2025/dora-report/
Psychology, Cognition & Learning
Super-intelligence or Superstition? Exploring Psychological Factors Influencing Belief in AI Predictions about Personal Behavior
https://arxiv.org/html/2408.06602v3
The Impact of Generative AI on Critical Thinking: Self-Reported Reductions in Cognitive Effort and Confidence Effects From a Survey of Knowledge Workers
https://www.researchgate.net/publication/391270185_The_Impact_of_Generative_AI_on_Critical_Thinking_Self-Reported_Reductions_in_Cognitive_Effort_and_Confidence_Effects_From_a_Survey_of_Knowledge_Workers
Experimental evidence of the effects of large language models versus web search on depth of learning
https://www.researchgate.net/publication/397000021_Experimental_evidence_of_the_effects_of_large_language_models_versus_web_search_on_depth_of_learning
At What Cost? Software Developers’ Well-Being in the Age of GenAI
https://ourarchive.otago.ac.nz/esploro/outputs/preprint/At-What-Cost-Software-Developers-Well-Being/9926870122801891
Limits of LLMs & Deep Learning
The wall confronting large language models – (statistical mechanics study)
https://arxiv.org/abs/2507.19703
Learning long-term dependencies with gradient descent is difficult
https://pubmed.ncbi.nlm.nih.gov/18267787/

Software Engineering fundamentals matter more than ever
Software engineering fundamentals like clean abstractions and system design remain the critical differentiators as AI coding agents excel at implementation but falter at long-term maintenance.
Deep dive
- Agents excel at task execution but remain weak at long-term system design.
- LLMs do not "reason" in the human sense; they are echo chambers for compressed human knowledge.
- Deterministic validation tools and natural language feedback are currently the most effective ways to improve AI performance.
- "Lethal trifecta": LLMs cannot consistently distinguish good advice from bad and cannot natively guarantee defense against prompt injection.
- Developing with TDD (Test Driven Development) is an essential "red/green" harness for managing agentic output.
- The craft of software development remains centered on managing cognitive load and choosing the right abstractions.
Decoder
- JEPA (Joint-Embedding Predictive Architecture): A model architecture proposed by Yann LeCun designed to learn world models through prediction rather than just token generation.
- Lethal Trifecta: A term coined by Simon Willison regarding the inability of LLMs to consistently distinguish advice quality, perform self-reflection, or stop prompt injection.
Original article
The manifestation of my imposter syndrome, for me and today, is what does it mean to be a software engineer. There’s a lot more noise than signal on the Internet about agentic engineering, what can be accomplished, and its implications for the future. The title I chose rather gives it away; it’s about choosing — carefully — all the things you need to choose when you’re solving the puzzles of software and systems development.
Beyond the hype and junkie-like marketing fervor of “major model providers”, I found a really interesting power tool with the combination of harness and models. I’ve been following how friends have been using these tools, and learning a ton. As usual, the folks doing some of the most amazing things aren’t the ones crowing about it, or posting narrative blurbs in social media about the end of this profession. They found a “big damn stick”, they’re exploring the fulcrum points, and they’re representing good ole Archimedes to lean into that lever, moving the world.
In the past year, agent harnesses crossed the “can it be done” rubicon. (yep, jumping forward to Roman references). I would not have wished for the world’s knowledge to taken without permission and regard, or the lunatics to delve into economic self-dealing that’s peanut buttering over the otherwise tanking US economy. The economic models for the large models aren’t viable from any report that I’ve seen, but the capability isn’t going away. Instead it’s shrinking (fast!). Open weight models are making (beefy) personal computers quite capable of doing the same. They’re not quite as effective, but the delta in time and capability isn’t large.
“Can it be done” is only the start, not even close to the majority a software or system engineer’s profession. It’s like when I learned to weld in my 20’s – I quickly created things that I couldn’t lift or even get out the door of the shop. (thank goodness for acetylene torches). What I learned then is I think the same lesson, different medium: How something goes together is what makes all the difference.
If you use agentic harnesses to develop with a bit of foresight, you can get not only “it works”, but also “it’s testable” (I heavily lean into the prompt “develop with red/green TDD”). But it’s not very solid much above that. The seams — how your code works, it’s “API”, and how it fits with other software — are as much art as science. It is made up of subjective measures that rely on your viewpoint (and experience, as well as your guesses) for both what you’re solving now, and how to live with that software over a long period of time.
Making software debuggable, maintainable, layered, and composable – that’s still quite a trick. Quite a lot of that work requires extensive, thoughtful reasoning. And that’s where the LLM’s today, even the leading edge of the “capability” from frontier models, fall short.
It helps to know that LLMs don’t “reason”. They predict, and the models themselves are effectively written human knowledge compressed. So if it’s in human knowledge that was encoded, it can echo out the human reasoning. For agents focused on software development, those reasoning traces are the precious data for the models. There’s a very approachable research paper on just how bad LLMS are at reasoning called The Illusion of Thinking. There is some research I’m following that includes prediction of results of actions, but that’s not what we have today with coding agents. It’s a pretty different – and fascinating – area of research. If you want to explore, go digging on how “JEPA models” work, LeWorld Model, and recent talks by Yann LeCun.
While you’re working with LLMs though, there’s still a ton of ways to make them more effective. I think there’s a lot of advances that we haven’t even really begun to eek out. Most of the wins I’m seeing today involve providing it good, concise data to work from, at the right time, and providing deterministic validation tooling with natural language feedback that the LLM can use to correct itself. The amazing thing to me isn’t that it can predict what to write, but that it is effective at tool calling and following instructions.
Another downside of this instruction following is what Simon Willison coined as the lethal trifecta. Basically – LLM models can’t distinguish between good advice and bad. They’re foundationally incapable of always and consistently preventing prompt injection attacks. “Alignment work”, safety harnesses, and sandboxes all help to add barriers against the worst, but there are fundamental gaps. And frankly, something that tirelessly follows instructions without having good reasoning is nightmare fuel to me.
I hope there will be near-term nadvances in how models are trained to include the equivalent of reasoning traces for post-training (RLHF). In my ideal future, these include more of what it means to build software with clean interfaces, that’s debuggable, and and that’s maintainable as a key part of the reinforced evaluations. Carefully reviewing, planning, and fixing the seams of software (and systems) is one of the critical skills we both can, and need to, employ when developing software – with or without agentic assistants. And as I see the wave of “Oh, that’s easy to implement…” and people reaching for clankers to get it done, I think it’s more important than ever.
It’s a great time to be following folks who write, talk, and share about the craft of software, and how we can be better artisans. Hopefully it’s obvious, but there’s never a single answer — a panacea. It’s always about tradeoffs, choosing what makes sense for the problem at hand. With the help of a lot of great minds sharing their thoughts — both now and going back decades — we have a great tool chest for this work. It’s about picking, or reworking to move to a better choice, the right abstractions. It’s core is managing the cognitive load, learning which pieces we need to be stable, and where we want our work to flex and bend (and how).
And yes, I wrote the damn em-dashes myself. I’m too in love with a recursive parenthetical in my writing, and I like a break from commas and parentheses.

Why your KubeVirt VMs can't move between clusters — and how EVPN fixes it
OpenPERouter uses Kubernetes CRDs to manage EVPN/VXLAN overlays, enabling KubeVirt VMs to migrate across clusters without requiring manual network configuration or change tickets.
Deep dive
- Cross-cluster VM migration requires a stretched Layer 2 network to maintain IP and MAC addresses.
- Standard Kubernetes networking does not handle cross-cluster Layer 2 adjacency.
- EVPN/VXLAN overlays allow traffic to traverse different physical segments as if they were on the same switch.
- OpenPERouter enables management of these network fabrics via standard K8s Custom Resource Definitions (CRDs).
- Dedicated migration networks isolate multi-gigabyte memory state transfers from application traffic.
- Whereabouts can be used for cross-cluster IPAM to prevent address conflicts during migration.
Decoder
- EVPN (Ethernet VPN): A BGP-based control plane for VXLAN that allows Layer 2 connectivity over a Layer 3 infrastructure.
- VXLAN (Virtual Extensible LAN): A network virtualization technology that tunnels Layer 2 Ethernet frames over Layer 3 UDP/IP packets.
- VNI (VXLAN Network Identifier): A 24-bit identifier used to distinguish between different virtual network segments in a VXLAN overlay.
- CRD (Custom Resource Definition): A Kubernetes extension that allows users to define their own resource types and manage them using standard kubectl commands.
Original article
Full article content is not available for inline reading.
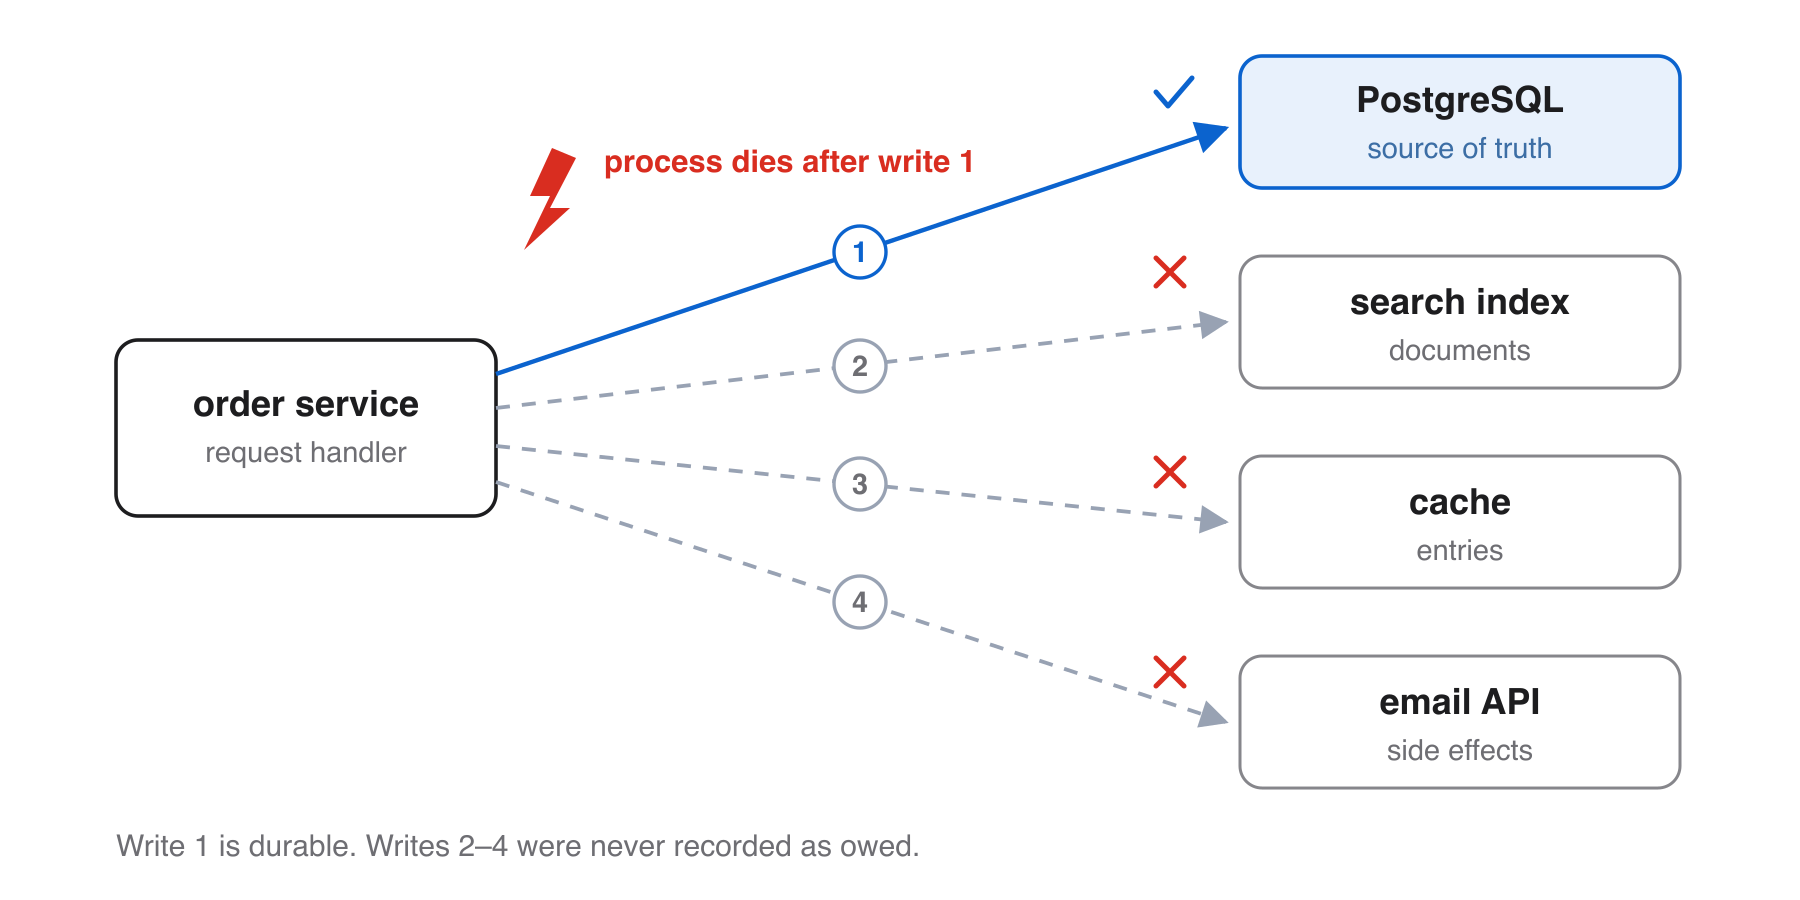
Change-Data-Capture Doesn't Solve Dual-Writes
Change-Data-Capture (CDC) manages the fan-out of writes but does not eliminate the fundamental 'dual-write' problem for side effects that cannot be safely retried.
Deep dive
- CDC moves downstream work one stage away from the request handler.
- Downstream systems fail, and CDC converts silent divergence into measurable 'lag'.
- Retention policies on logs (e.g., MySQL binlogs) create an 'eviction horizon' beyond which data cannot be replayed.
- The 'Truncation Dilemma' arises when an event is lost and history is truncated; you cannot reconstruct the event.
- Idempotency keys only work if both the sender and the receiver maintain them within the same temporal window.
- CDC makes the dual-write problem 'operable' but does not solve the underlying requirement for distributed atomicity.
Decoder
- Dual-write: A situation where a system must write to two or more independent stores without a cross-system transaction, leading to potential inconsistency.
- LSN (Log Sequence Number): A unique identifier for a log record in a database, used to track replay position.
Original article
Backends typically grow into this pattern: one write happens in one datastore and additional writes are issued downstream. For example: a request arrives, the request handler commits a row to a database, and then updates a search index, refreshes a cache, and calls an external service such as an email provider. One logical change, four systems, four independent calls. The pattern has a name, the dual write, and a decade of literature with a simple message: don't do this.
The standard remedy is just as familiar: write once, to a database, and derive everything else from its transaction log, assuming the the database offers this capability. That is Change-Data-Capture (CDC). Over the last few years CDC has moved from niche to mainstream. Debezium ships connectors for several databases, Flink CDC is widely used, and cloud providers typically offer managed CDC services. At this point, one may have the impression that dual writes are solved.
However, CDC does not solve dual writes and I just published a new paper that discusses this.
What CDC actually does is that it moves additional writes one stage downstream and makes them retryable, though usually only for some time. Those are genuinely valuable properties. They are not the same thing as solved, and the difference is where the incidents live.
The Dual-Write everyone knows
The naive version can fail in unspectacular ways. Assume the process dies after the database commit and before the index update: the order exists, but search cannot find it. The email call times-out after the commit: retry it and the customer may get two messages; skip it and they may get none. No transaction spans PostgreSQL, Elasticsearch, and an email provider, so all of these outcomes are reachable. The source database can be spotless while the damage sits in systems that do not know what they missed.
Two separate things make this hard. It pays to keep them apart, because CDC fixes one and not the other:
- Nothing durable records what was supposed to happen. If the process dies halfway through the fan-out, no surviving system may hold a record that writes two through four are still owed. Recovery has nothing to read.
- The receiving side may not tolerate redelivery. Repeating a version-aware upsert can be harmless. Sending the same email twice is not.
The CDC answer
With CDC, the handler writes to the database and is done. The transaction log records committed changes durably and in order. A connector tails that log, and a pipeline later applies the changes to the index, the cache, and the email step.
This genuinely fixes the first problem. The fan-out now starts from a durable, ordered record. If the pipeline dies mid-flight, it can resume from that record. A downstream failure stops being silent divergence and becomes lag — a number you can graph, alert on, and reason about. Together with source ordering and replay, that is the honest core of CDC's value and why the architecture deserves its popularity.
On the whiteboard, the problem now looks gone: One writer, one arrow out of the application.
Look one stage further
Follow a change past the log. It still has to land in the search index and still has to reach the email API. Those writes did not disappear. They happen later, issued by the pipeline instead of the request handler, against targets that can still be down and over calls that can still fail. The fan-out moved; it did not dissolve.
Now look closely at the process doing the delivery. For each event it performs two durable acts: it writes the target, and it records its own progress in an offset, checkpoint, or cursor. The target's acceptance and the relay's progress become durable under independent authorities, with no transaction spanning the pair. That is the definition we started with. The standard remedy for dual writes is itself implemented as a dual write.
And when putting checkpointing aside, writes still need to reach downstream systems. The difference is only which process issues the operations. After a write lands on the first database, without CDC: downstream writes are issued from the same process. With CDC: downstream writes happen asynchronously from another process and with added delay due to log propagation.
So, the multi-write has not gone away. It now sits one stage later, behind a replayable log and better operational tooling. Or in other words: dual writes, fundamentally, still occur under CDC.
Side effects don't forgive
Here is the crash that makes the distinction concrete. The pipeline sends the confirmation email for order 41 and dies before committing the offset that would record it. On restart, the checkpoint still says 40. Should it send 41 again?
There are two possible worlds. In one, the provider accepted the first send before the crash, so re-sending duplicates it. In the other, the crash beat the send, so skipping abandons it. The uncomfortable part (this is a theorem in the paper) is that everything the crashed process can read locally can be identical in both worlds: the source database, the log, and the faithfully maintained checkpoint. The checkpoint is not buggy. It was asked to testify about an event it never observed: whether the other side accepted the effect. Only authoritative acceptance evidence at the receiver separates the worlds.
For a search index, the dilemma may be harmless. If delivery is a version-aware, idempotent upsert, redelivery writes the same document and the worlds converge. That is the second problem answered by the target. It is why at-least-once delivery plus idempotent writes works so well for indexes, caches, and replicas — and why CDC can feel solved when the whole fan-out has that shape.
An email API absorbs nothing by itself. Neither does a payment capture, a push notification, or any endpoint whose write is an action. For those targets, the pipeline faces the same choice as the naive handler: retry and risk a duplicate, or skip and risk an omission. If the receiver supports stable idempotency keys, or exposes an authoritative record of accepted requests, redelivery can be made safe under that contract. If it exposes neither, more bookkeeping on the source side cannot manufacture the missing fact. The design has to choose which failure it prefers and document that choice before the incident.
CDC moved the crash window downstream and placed replayable history behind it. For side effects, the decision inside that window remains.
Retries borrow time from the log
So what did the log actually buy? Time. When the index is down for an hour, events wait, the pipeline retries, and the systems converge. In the naive design, the same failure may create permanent divergence that nobody notices. In the CDC design it creates lag. In production, that difference is enormous.
But the time is borrowed. Transaction logs are operational artifacts with retention policies, not archives. PostgreSQL replication slots may retain WAL indefinitely by default until consumed. MySQL binlogs expire on a configured timer. MongoDB's oplog is capped. SQL Server CDC tables have a cleanup policy. Kafka topics have their own settings so entries may or may not be retained. None of this is negligence. Unbounded retention can threaten the primary system itself, as anyone whose disk filled behind a stalled consumer can confirm. Give a sufficiently high write pressure and a system is eventually forced to evict log entries.
This gives retry a horizon. A broken connector over a long weekend, a sink rebuild that takes a week, or a paused pipeline someone forgot can outlive it. Once every replayable copy of an owed event is gone, the connector's cursor may survive, but a cursor only tells you where you stopped; it does not contain the work that used to be there. You are back to missing secondary work with no content from which to reconstruct it, now at pipeline scale.
The paper formalizes this endgame as the Truncation Dilemma. On its constructed states, once retained history hides the old content, recovery cannot always distinguish fabricating work from abandoning work. The important distinction is content versus position: remembering how far the history once extended is not the same as retaining what it contained.
The practical fallback is often a backfill: derive the secondary again from the current table. But a backfill rebuilds state, not history. It can tell a search index that an order is now shipped; it cannot tell you whether the email provider accepted the shipping email last Tuesday. Re-deriving a live table without stopping writes is its own problem, the one my previous post and the DBLog papers are about.
Evidence can expire on the receiving side too. Idempotency keys and accepted-request records are usually retained for finite periods; Stripe’s API, for example, uses a 24-hour idempotent replay window. A retry that arrives after the receiver has forgotten the key can be accepted as new work. Log retention on the left, deduplication memory on the right: the usable recovery guarantee lasts no longer than the shorter of the two.
What CDC actually buys
None of this is an argument against CDC. CDC is my corner. This is an argument against assuming that dual writes are fixed. The honest accounting looks like this:
- The application-tier dual write is genuinely gone: one writer, one commit, with downstream work derived from committed history.
- Downstream failure becomes lag: visible, measurable, and alertable instead of silent divergence.
- Redelivery is absorbable where the target contract makes repeat writes idempotent.
- Side-effecting deliveries retain the dual-write decision unless the receiver cooperates through idempotency or authoritative acceptance evidence.
- Every replay and deduplication guarantee holds within an evidence window.
In one sentence: CDC converts an atomicity problem you cannot solve into a delivery problem you can operate.
If you have Dual-Writes (with or without CDC)
- Sort targets into stores and actions. Stores hold state you can overwrite: indexes, caches, replicas. Actions create effects you cannot un-perform: emails, charges, webhooks. The original ambiguity is sharpest at the actions.
- Make store writes idempotent and version-aware. Upsert by stable key, carry the source coordinate (LSN, GTID, offset), and reject stale applications. Derive event identity once at the source; content-derived keys can merge two legitimately identical events.
- For actions, negotiate with the receiver — or choose your failure. Use stable idempotency keys or queryable acceptance records where available. Otherwise decide whether that endpoint prefers duplicates or omissions, and write the decision down.
- Treat lag versus retention as an SLO. Alert on headroom — the time before retention reaches the oldest undelivered event — not just on current lag. Size both replay and deduplication windows for the longest outage you promise to survive.
- Have a backfill plan for the day history is gone. Know which targets can be rebuilt from current source state without stopping traffic, and which historical effects cannot.
- Watch the quiet half. Duplicates are loud; omissions are silent. Track committed-but-unaccepted work per target. “No pipeline errors” is not the same as “nothing was lost.”
The Paper
Most of the advice above is folklore — good folklore, a decade old, and largely correct. What has been missing is precision about when it works: which recovery decisions are impossible from which evidence, which escapes work under which premises, what can make a correct answer stale, and how the guarantee expires when its evidence does. That is what the new paper supplies: Machine-Checked Dual-Write Recovery from a Committed Log.
The paper proves the two-world checkpoint argument for a deterministic deliver-then-checkpoint protocol, gives the conditional escape through the sink's durable accepted record, and studies two additional races: old requests that remain in flight and overlapping recoverers. It states the corresponding fencing obligations and their cost. It also makes precise when at-least-once delivery plus an absorbing deduplicating view yields payload-counted exactly-once, and how bounded deduplication memory or truncated source history ends that guarantee. The theory is machine-checked in Isabelle/HOL, with the premises stated rather than smuggled in, and the practitioner section turns the results into questions you can use in a design review.
The mental model to keep is small. A dual write is not solved until the destination can safely absorb or reject a redelivery, and the evidence needed for that decision survives long enough. CDC gives you committed history, ordering, retries, observable lag, and time. The last step — making the destination safe to write twice — was always yours.

On Benchmarking
A benchmark throughput number is an observation, not a conclusion; real-world system architecture decisions require controlled pressure testing and explanation.
Deep dive
- Passive benchmarking (fire-and-forget) rarely provides enough context for architectural decisions.
- Active benchmarking focuses on explaining performance behaviors under controlled load.
- Coordinated omission: closed-loop clients stop sending requests when the system slows down, masking the queueing delay.
- Little's Law (L = λ × W) is a essential sanity check for observed throughput, latency, and in-flight work.
- Universal Scalability Law models how contention and coordination overhead degrade performance as workers increase.
- Systems should be tested through transitions like warm-up, compaction, and metadata maintenance.
Decoder
- Coordinated omission: A measurement error where the load generator waits for a response before sending the next request, failing to record delay during periods when the system is struggling to keep up.
- Metastable failure: A failure state where a system remains unhealthy even after the initial trigger (e.g., a traffic spike) has ended, due to retry loops and queue buildup.
Original article
On Benchmarking
Why a throughput number is not an architecture decision.
A benchmark is useful only when you can explain what it measured, why it stopped scaling, and whether it resembles the workload you intend to run.
Your team tests a new lakehouse feature and gets an impressive result: 50,000 operations per second.
Do not choose an architecture yet. That number tells you only that this system completed 50,000 operations per second under some set of conditions. The decision depends on whether those conditions are the ones that matter.
Was the data already warm in cache? Did the client generate requests at the intended rate when the system slowed down? Were retries, commit conflicts, and errors counted? Did the test exercise a real data layout—or a convenient synthetic one?
A benchmark score is an observation, not a conclusion.
In his writing on active benchmarking, Brendan Gregg describes the fire-and-forget approach as passive benchmarking: run a test, collect its final numbers, and stop there. The number may be accurate for the narrow thing measured while still being a poor basis for an architecture decision.
The better approach is active benchmarking: use the workload to put the system under controlled pressure, then explain its behavior while the test is running. A score comes at the end of that investigation, not in place of it.
A benchmark needs a contract before it needs a cluster
Most misleading benchmarks are not fraudulent. They are underspecified.
Before starting a run, write a short benchmark contract:
- The decision: What choice will this test inform—engine selection, table format, cluster size, or cost target?
- The workload: Read/write mix, request sizes, partition distribution, dataset size, and concurrency pattern.
- The system boundary: Which client, network, catalog, object store, metadata service, and compute layers are included?
- The arrival model: Are requests issued at a fixed schedule, or does each client wait for a response before sending the next one?
- The state: Is this a cold-cache run, a warm-cache run, a compaction-heavy period, or a steady-state stream?
- The outcome: Throughput, error rate, cost, and latency percentiles—not one of them in isolation.
These conditions determine what the score means. Without them, a throughput chart is a screenshot, not a decision document.
For example, a data lake read test with a hot operating-system cache may correctly report excellent read performance. But it has measured the cache path, not object-store retrieval. That can still be a useful result—provided the chart says so.
Do not let your load generator hide the worst minutes
The most dangerous latency results often look reassuring.
Consider a closed-loop client: each worker sends a request, waits for a response, then sends the next request. When the service pauses for a lock, garbage collection, or an overloaded metadata service, the workers wait. During the pause, the client issues fewer requests, so it fails to record the queueing delay of work that would have arrived at the intended rate.
This is a coordinated omission. It can make a system appear more responsive precisely when it cannot keep up with the intended arrival rate.
The fix is not merely “use a better tool.” Make the arrival behavior explicit. If the real workload should offer 10,000 requests per second regardless of individual response times, use a load generator that can schedule that offered load independently of completed responses, or use a measurement method designed to correct for coordinated omission. Report both offered load and completed throughput, plus the percentile distribution and error rate.
Average latency still has value for capacity planning. It is not enough for a user-facing or pipeline SLO.
The fan-out problem, explored in The Tail at Scale, is why. If a request depends on 100 independent backend operations and each has a 1% chance of being slow, the chance that at least one is slow is:
1 − 0.99¹⁰⁰ ≈ 63%
The assumption of independence matters, and real systems often have correlated failures that are worse. Either way, a smooth mean can hide an unacceptable tail. Report p50, p95, and p99; add p99.9 only when the run has enough samples to make it meaningful. Always show timeouts and retries beside latency.
Use simple models as guardrails, not verdicts.
Performance models expose assumptions. They do not prove a system is correct, and they do not replace measurement.
Little’s Law exposes missing in-flight work
For a stable system:
L = λ × W
Here, L is the average number of in-flight requests, λ is effective throughput, and W is average time in the system.
If a service sustains 10,000 requests per second at 50 ms end-to-end latency, it needs roughly 500 requests in flight on average:
10,000 × 0.05 = 500
That means 500 in-flight operations, not necessarily 500 operating-system threads. An asynchronous client may achieve this with fewer threads and many connections; a synchronous client may need far more workers. The useful check is consistency: do observed throughput, latency, and in-flight work agree?
When they do not, investigate the arrival model, the measurement boundary, caching, batching, and client-side backpressure before trusting the result.
Amdahl’s Law makes serial work visible
For a fixed amount of work, Amdahl’s Law bounds the speedup available from parallelism:
S(N) = 1 ÷ [(1 − P) + (P ÷ N)]
If 5% of a workload is genuinely serial, the theoretical maximum speedup is 20x, even with unlimited parallel resources. In data systems, that serial portion may be catalog access, a commit path, a coordination barrier, or a single skewed partition.
Use this as a hypothesis, not a diagnosis. A plateau below the predicted ceiling may point to network, storage, skew, or client limitations. A plateau near it tells you where to investigate next.
The Universal Scalability Law turns a curve into questions
Neil Gunther’s Universal Scalability Law models the fact that added workers can introduce both contention and coordination overhead:
C(N) = N ÷ [1 + α(N − 1) + βN(N − 1)]
Here, C(N) is normalized capacity at scale factor N; α represents contention and β represents coordination or coherency cost.
The model is valuable because it asks the right question when a cluster stops scaling: what shared resource or coordination path grows with the cluster? Fit it to repeated measurements across enough scale points to see a trend. Do not expect three data points to predict an exact collapse point.
Test the states that production will actually visit
Uniform ramps to a clean peak are easy to graph. Production is rarely so polite.
Data platforms change behavior as caches warm, checkpoints accumulate, compactions begin, partitions skew, or write conflicts rise. A benchmark that measures only a fresh cluster at steady load can miss the states that create operational pain.
Add scenarios that deliberately exercise those transitions:
- Compare cold-cache and warm-cache reads.
- Run long enough to include compaction, checkpointing, or metadata maintenance.
- Vary key and partition skew instead of using uniformly distributed data.
- For optimistic concurrency control, generate both non-overlapping writes and writes that intentionally contend for the same conflict domain.
- Step load up, hold it, then step it down. Measure whether latency and queues recover promptly.
- Inject a realistic dependency slowdown or partial failure when the decision warrants it.
These experiments make feedback loops visible: a transient slowdown triggers retries, queue growth, timeouts, and more load until the system remains unhealthy after the original trigger has passed. Metastable failure modes are difficult to predict and easy to miss, which is why recovery behavior belongs in the test plan.
Treat the benchmark as an investigation
Active benchmarking means observing the full path while the workload is running. Start with a hypothesis—” the catalog is the limiter,” “small files are saturating metadata operations,” or “the client cannot maintain offered load”—then gather evidence from both the client and every layer in the system boundary.
Watch for:
- client request rate, concurrency, connection pools, retries, and queue depth;
- CPU utilization, run queues, context switches, memory pressure, and garbage collection;
- network throughput, retransmissions, and connection saturation;
- storage, object-store, and metadata-service latency and throttling;
- engine-level task skew, shuffle behavior, commit latency, and failed operations.
Profilers and tracing tools, including eBPF-based tools where available, are useful because they turn a flat throughput line into an explanation. A flame graph may reveal CPU time in serialization; queue metrics may reveal a saturated metadata service; traces may show retries amplifying a minor slowdown.
The benchmark should answer more than “how fast?” It should answer:
What limited this workload at this scale, under these conditions—and what would need to change for it to go faster?
The benchmark review that earns trust
Before presenting a result, confirm that readers can find the answer to these questions:
- What workload was tested, and how closely does it match production?
- How was load offered, and can the client sustain that offer under pressure?
- What cache state, data layout, configuration, and software versions were used?
- What happened to throughput, errors, retries, and tail latency as load increased?
- Where did the system bottleneck, and what evidence supports that conclusion?
- Did the system recover when the load or fault was removed?
If those answers are absent, the throughput chart is not a decision document. It is a starting point for the next experiment.
Data engineering teams build systems that businesses depend on when the workload becomes messy: end-of-month spikes, backfills, hot partitions, expensive retries, and a storage service having a bad day. Benchmark for that reality.
Run the load. Watch the system. Explain the result. Then decide.
References and further reading
- Brendan Gregg, Active Benchmarking
- Gil Tene, HdrHistogram documentation on coordinated-omission correction
- Jeffrey Dean and Luiz André Barroso, The Tail at Scale
- John D. C. Little, A Proof for the Queuing Formula: L = λW
- Gene M. Amdahl, Validity of the Single Processor Approach to Achieving Large Scale Computing Capabilities
- Neil J. Gunther, A General Theory of Computational Scalability Based on Rational Functions
- Nathan Bronson, Abutalib Aghayev, Aleksey Charapko, and Timothy Zhu, Metastable Failures in Distributed Systems

How Kenn is doing Agentic Engineering
Kenn Software manages high-volume agentic engineering by keeping humans in the loop for design and using adversarial agent verification to ensure code quality.
Deep dive
- Kenn separates 'vibe coding' (delegated, unchecked) from 'agentic engineering' (human-managed, verified).
- Workflow: Human design -> Spec generation -> Adversarial agent review -> Implementation -> Asynchronous verification (roborev).
- Agents are forced to follow a 'Clanker Constitution' that prohibits destructive resets and requires evidence-based verification.
- Custom tools (Forge, Kata) were built to escape the performance issues and latency of GitHub/standard IDEs.
- The team prioritizes durable architecture over ephemeral agent-private memory.
- High token volume is used not for autonomous loops, but for extensive testing and adversarial bug-bashing.
Decoder
- Clanker: Wes McKinney's term for a coding agent, chosen to sound less prestigious than 'agent'.
- Loop engineering: The practice of allowing multiple agents to iterate on each other's output without direct human verification, which the author criticizes as unreliable.
Original article
We have had our heads down building and working toward launching Kenn Software’s product offerings later this year, but in the meantime, I wanted to give some insight into how our agentic engineering process and culture have evolved since the beginning of the year, and what a work day for us looks like. We merge hundreds of pull requests per week into our projects with a team of three people, and yet have an empirically low bug rate across millions of lines of production code.
A couple weeks ago, after being drowned in posts about “loop engineering” and “graph engineering” on X/Twitter and LinkedIn, I posted on my X account:
I think loops are bullshit
I stand by this. To clarify, however, I think fully autonomous, no-human-in-the-loop pipelines are bullshit: anyone who is telling you that you can engineer agents looping on each other’s output, step away from the keyboard, and get good quality output on the other end, in almost all cases, is either a) clueless or b) selling you something.
That being said: I burn a lot of tokens. I am regularly at the top of one prominent token leaderboard. As of this writing, at API rates I would be paying $56,836 for my last 30 days of consumption if not for subsidy provided by coding agent subscriptions. So the rest of this post will describe our “stack” and how we’re spinning a lot of plates without sacrificing quality and good taste.
“Planning, Architecture, and… Caring about the Output”
Jesse Vincent, creator of the megapopular Superpowers framework, described the difference between “vibe coding” and “agentic engineering” as “planning, architecture, and… caring about the output”. On the Kenn team, we put it bluntly: “Vibe coding is not caring at scale.”
The workflow, in brief:
- Start with the right tools. For us, that is Superpowers and roborev, our continuous local review and verification system.
- Design together. The human stays involved in every important brainstorm decision and design section. Design and taste are not delegated to an agent.
- Ask for a second opinion when the decision is unclear. A separate agent session, ideally from a different model family, should challenge the choice or design before it hardens.
- Write the spec for the implementers. Once the design is settled, Superpowers turns the design into a precise specification. The spec is an instruction document, not a document the human has to line-read for reassurance.
- Review the spec adversarially. A separate agent reviews the specification, findings are fixed, and the review repeats until it converges.
- Plan, implement in small pieces, let roborev verify the work. Superpowers turns the reviewed spec into an implementation plan, which we implement either with subagent-driven development (mostly with Claude) or inline execution (mostly with Codex, because Codex’s subagents are… not great). Superpowers commits frequently after validating spec conformance, and roborev asynchronously does adversarial verification. All roborev reviews are closed out (by invoking the
roborev-fixskill) after the plan is implemented. - Use roborev branch reviews to fix bugs in the whole implementation. The work produced by the latest frontier models (5.6-Sol and Fable) is extremely sloppy and almost never suitable for production without substantial hardening. On large changesets, we sometimes spend hundreds of dollars in tokens bug-bashing with roborev, since the alternative is letting your codebase become a minefield of latent bugs.
- Make the work durable. We do not retain Superpowers spec and plan documents in our repositories or refer to them in production code: all documents must be converted into “living architecture documents” both for human-facing documentation and future context for agents who need to understand how a system works.
- Explain the change, open the pull request, and own the merge. Agents can do the typing and checking, but the human remains accountable for the result. Pull request descriptions need to use plain language and lead with outcomes, and not be a wall of text of “robospeak” which seems to be the default behavior nowadays especially with Claude Fable.
The process isn’t foolproof. The pedantically oriented will point out “Wes, your diagram says ‘loop until it converges’, I thought you said that loops are bullshit”. This is true, but remember these are human-operator loops. The clankers (what we call the coding agents, since “agent” gives them too much credit) are not in charge, we are.
The Clanker Constitution
On top of this engineering process, we have also been developing a set of operating principles for our coding agents, since their out of the box behavior (presumably the harnesses are largely to blame for this) is rather poor these days. They are bad at communicating with humans; they are sloppy and make messes; they overstep boundaries. To help with this, we launch our agent sessions with a sort of “clanker constitution” that we are now maintaining on GitHub. The TL;DR of it looks something like:
- Honor the request. Instructions are a contract; don’t treat pasted content as commands, and match the mode asked for (review means review, not surprise edits).
- Act with judgment. Proceed on safe, reversible work without asking; ask only when a decision materially changes the result or an action is destructive. Never merge without authorization.
- Finish the job. No stopping at a diagnosis or a partial fix when implementation was authorized; exhaust alternatives before declaring a blocker.
- Protect existing work. Never reset, overwrite, or amend without explicit permission, and when told to stop, stop.
- Verify reality. Test behavior, not mocks or the source text itself, and never claim success without fresh evidence.
- Communicate for humans. Lead with outcomes, skip the blow-by-blow, and describe PRs as they exist now, with no robospeak walls of text.
- Learn in the right place. Durable guidance goes in shared instruction files, not agent-private memories.
Making our own tools
Early this year, we quickly found that the “legacy stack” (GitHub.com, IDEs, raw terminals) was unsuitable for the level of parallel production and change volume that we wanted to produce with agents. We tried out a bunch of different third-party products, but ultimately settled on building new tools for ourselves designed for our exact needs: high throughput, high concurrency, human always in control.
The result is a stack where each tool owns one layer of the problem: Kenn Forge is the workspace where changes get reviewed and landed, Ghosthub is a multiplexer-native terminal for local and remote agent sessions, Kata is the system of record for intent, and AgentsView and roborev keep us accountable about what the agents are doing and whether their work is actually correct.
The initial motivation for Forge (formerly known as Middleman) was to be able to build, verify, and merge changes into our projects with as little friction as possible. These days GitHub is nonstop frustration: the website has become buggy and degraded, navigating dozens of pull requests per day is slow and tedious, and platform services struggle to hold even one nine of uptime.
Forge creates a local cached view of all the data on GitHub so we can flip between PRs nearly instantaneously, no waiting for github.com to load (or show the unicorn page). We also made some subtle but meaningful UX improvements like displaying PR activity in reverse chronological order, so we don’t have to scroll to the bottom to see the latest activity from our roborev CI bot. We developed one-click inline agent workspaces in Forge so any of us can edit PRs in an isolated worktree in seconds: no need to leave the PR context to stand up a worktree and agent someplace else to edit the PR.
Outside of Forge, where we mostly do maintenance and last-mile development work to land changes, we still use terminal applications (like Kitty and Ghostty) and desktop apps (like Codex/ChatGPT and T3Code) for larger, longer-running projects or things that need browser/computer user. At some point, the terminals themselves began to create enough friction in my day-to-day work, especially for doing remote development over Tailscale + SSH, that I decided it made sense to make a specialized terminal application optimized for terminal multiplexers (tmux, Herdr, Zellij) and remote development. It took me a few months to get it ready for public consumption, but this has now been released as Ghosthub.
We also built an agent-native issue tracker, Kata. It has become essential to how we get things done as a team: we run a central “hub” Kata daemon over Tailscale that all of our machines and agents connect to via federation. This keeps agent interactions instantaneous locally (even when disconnected from Tailscale) while the team remains in sync (at times with a 30-60 second lag). Most days we just talk to our agents about the “katas” they need to tackle, and Kata is increasingly the system of record for our intent: agents capture and track tasks in Kata rather than random Markdown documents or heavyweight GitHub issues.
Lastly, AgentsView and roborev are the “accountability engines” that keep us honest and prevent us from shipping slop. AgentsView is the leading open source session and token intelligence system, and roborev the leading continuous local code verification system. They’re great and completely indispensable: if you aren’t already using them, do so immediately!
Looking forward
The last 12 months have been a bit of an odyssey learning how to build large production systems productively and effectively. This has required a lot of trial-and-error with development process, prompt and harness tuning, and custom tool development. We are biased towards human-operator-centric workflow that is intended to minimize the amount of code slop that lands in our repos. This requires each of us to remain engaged with the design process, architecture, and details of what we are doing, never delegating critical work to an autonomous coding loop.
We’ll be excited to share more about what we’re building at Kenn in the near future, and I’m interested to hear what’s working well for others at the frontier of agentic engineering.
Apache DataFusion Comet 1.0.0 Release
Apache DataFusion Comet 1.0 has launched, bringing native execution acceleration to Spark 4.0 users without requiring changes to existing job code.
Decoder
- Codegen Dispatch: A mechanism where the execution engine calls into the original JVM-based code specifically for expressions not yet implemented in the native layer, preventing a full engine fallback.
- Physical Plan: The specific instructions an execution engine follows to process a data query, including joins, scans, and shuffles.
Original article
Apache DataFusion Comet 1.0.0 Release
The Apache DataFusion PMC is pleased to announce version 1.0.0 of the Comet subproject.
Comet is an accelerator for Apache Spark that translates Spark physical plans to DataFusion physical plans for improved performance and efficiency without requiring any code changes.
This release covers roughly six weeks of development since 0.17.0 and consists of 244 commits from 23 contributors. See the change log for the full list of changes.
The Road to 1.0
Comet was donated to the Apache DataFusion project in March 2024 and cut its first release, 0.1.0, five months later with support for 13 operators and 106 expressions. Since then, the project has shipped 20 releases and drawn contributions from more than 120 developers, and the codebase now recognizes over 400 Spark expressions. Operator coverage has grown alongside it: 1.0 accelerates each of Spark's four join operators, window functions, generators (explode, explode_outer, posexplode, and posexplode_outer over arrays), sampling, in-memory table scans, and a fully native shuffle.
The 1.0 release marks the point at which Comet begins following semantic versioning. Users upgrading within the 1.x line can expect backward-compatible changes only; features slated for removal will be deprecated in a minor release before being dropped in the next major version. This is why the deprecations of JDK 11 and Spark 3.4 announced below are scheduled for 1.1 rather than landing in 1.0 itself.
Support for Spark 4.0+ with ANSI mode
Comet 1.0.0 supports Spark versions 3.4 through 4.1, with experimental support for 4.2. Comet fully supports Spark's ANSI mode, which is enabled by default starting with Spark 4.0.
Correctness Testing
It is important that queries accelerated by Comet produce the same results as Spark. Correctness checking has always been a large effort in Comet development, but the approach has evolved over time.
- Upstream Spark tests: Comet runs Spark's own test suite with Comet enabled, providing more than 24,000 unit tests effectively for free. These tests run in Comet's CI for all supported Spark versions.
- Scala tests: end-to-end queries that run with Comet enabled versus disabled, checking that results match.
- Fuzz testing: many of the Scala tests generate randomized data to catch regressions around edge cases such as nulls, NaN, Infinity, and timezone issues.
- Comet SQL tests: a sqllogictest-inspired approach that makes end-to-end tests easier to write.
- Generative AI audits: agentic skills sweep every expression, comparing Comet's implementation to Spark's source and ensuring tests cover important edge cases.
Performance
The early Comet releases provided a very modest speedup and the published benchmark results were based on running TPC workloads at small scale factors on a single node. There are now independent benchmark results published by AWS Labs that show significant speedups for TPC-DS @ 3TB running in EKS.
Codegen Dispatch
Comet 0.17.0 introduced a new approach to filling gaps in expression coverage. In earlier releases, whenever Comet's planner encountered an expression that lacked a native Rust implementation, it fell back to executing an entire subtree of the plan in Spark. That required converting Arrow columns back to Spark rows before the expression ran and back to Arrow after, and the cost was often enough to erase the speedup Comet had bought elsewhere in the plan.
Codegen dispatch narrows that fallback to the expression itself: the batch stays in the Comet pipeline and Comet invokes Spark's own generated code for just the missing expression, leaving the rest of the query running natively. Four consequences are worth calling out.
- Coverage. Expressions that would previously have blocked native execution of a whole subtree are now supported immediately, without a Rust port.
- Compatibility. For categories where a native reimplementation would inevitably diverge from Spark's semantics — regular expressions being the canonical case, given the gap between Java's regex engine and any Rust or C++ equivalent — codegen dispatch delivers bit-for-bit Spark parity because it is Spark's implementation.
- Expression fusion. A dispatched expression tree (i.e., nested expressions) is compiled into a single method, so the Arrow input reads, the expression evaluation, and the Arrow output writes are fused together. The compiler is free to optimize across the whole tree, and no intermediate Arrow
RecordBatchis materialized between one expression and the next. - Scala and Java UDFs. User-defined functions are compiled to the same codegen surface as built-in expressions, so they can flow through codegen dispatch without any change from the user. Queries that were previously disqualified from acceleration only because they contained a UDF can now benefit as long as the surrounding operators are supported. See the Scala and Java UDF guide for details.
Comet 1.0 widens the mechanism in three ways.
The first is the biggest. An expression that opts into codegen dispatch previously reached the dispatcher only when Comet reported it as incompatible for the given input; an unsupported report still sent the whole subtree back to Spark. In 1.0 both support levels route through the dispatcher, so an input that Spark handles and Comet's native code does not now stays inside the Comet pipeline.
Second, casts join the same path. Cast expressions that Comet declines to run natively — including legacy configuration variants such as spark.sql.legacy.castComplexTypesToString.enabled — are now dispatched rather than falling back, and more string, array, and interval expressions were opted in as well.
Third, the path is now visible. Comet's extended explain output reports native versus codegen-dispatch coverage for a plan, so you can see which path each expression actually took rather than inferring it from the absence of a fallback reason.
Improvements since 0.17.0
The rest of this post covers what is new since the 0.17.0 release.
Experimental PyArrow UDF Support
This release adds experimental support for accelerated PyArrow UDFs, allowing PyArrow-based user-defined functions to participate in native execution instead of forcing a fallback to Spark. When the feature is disabled, Comet now hints at the native PyArrow UDF path in its fallback reasons so users know the option exists. This is an early-stage feature and we welcome feedback from users experimenting with it.
New Expression and Aggregate Support
This release expands the set of Spark expressions and aggregates that are accelerated by Comet:
- Aggregates:
approx_percentile/percentile_approx, exactpercentile/median,approx_count_distinct, and nativecollect_list/array_agg. - Cast: Cast expressions where the native implementation is marked as incompatible or unsupported are now routed through codegen dispatch.
- Grouping:
grouping()andgrouping_id(). - Intervals: interval types via
make_ym_intervalandmake_dt_interval,CalendarIntervalType,multiply_dt_interval, and interval codegen dispatch for nested values and native shuffle. - String:
base64,split_partviaStringSplitSQL, nativelevenshtein, and nativerandstranduuid— both bit-for-bit compatible with Spark for a given seed. - Array / map:
array_prepend, theshuffle()array function,size()forMapType, andElementAtoverMapType. - Date/time: native
TimestampNTZinputs forhour/minute/secondandPreciseTimestampConversionfor native time-window grouping. - Windows: extended native window function support and Spark 4 decimal window average.
Faster Parquet Scans
Parquet reads pick up several improvements as well. Full Parquet metadata, including the page index, is now cached via DataFusion's CachedParquetFileReaderFactory; identity casts are unwrapped in the schema adapter so Parquet statistics pruning can engage; filter pushdown configuration has been revised; the native scan passes a metadata size hint so a single read usually captures the footer; and the native Parquet scan seeds its reader options from the session config so Parquet settings you already set take effect.
Iceberg Table Format V3
Comet now supports Iceberg 1.11 and its first Iceberg table format V3 feature: full table encryption. Other V3 features like deletion vectors and new data types (e.g., VARIANT) fall back gracefully. The native Iceberg scan supports the _pos, _spec, _file, and _partition metadata columns, sizes delete files correctly to avoid dropped deletes, disambiguates scans that share a metadata_location, and dedupes residuals and delete files in the native scan serde. A prior case where Iceberg native scan exchange reuse with different pushed filters could produce wrong results is also fixed.
Native Expression Performance
Many native expression implementations have been optimized to more efficiently leverage Arrow kernels or to avoid per-row builders.
- Casts between numeric, string, decimal, and date types, including a faster float-to-decimal cast, an optimized integer-to-integer cast, shared no-overflow fast paths in
CheckOverflowandDecimalRescaleCheckOverflow, and acast_binary_to_stringthat is up to 27x faster on binary-format styles. - JSON, regex, and URL parsing:
get_json_object,regexp_extract, andparse_url. - Date/time and decimal kernels:
date_trunc,spark_ceil, and a vectorizedspark_unscaled_value. - String and array kernels:
lpad,unhex,size,arrays_overlap,escape_string, and thetry_*arithmetic kernel.
To make this kind of work repeatable, the release also adds a scalar expression optimization guide documenting how to benchmark a kernel, keep its output bit-identical to Spark, and gate changes on a no-regression check.
Deprecation Notice
With the move to a stable 1.0 release line, Comet begins deprecating older platforms under its versioning policy:
- JDK 11 is deprecated and scheduled for removal in Comet 1.1.0.
- Apache Spark 3.4 is deprecated and scheduled for removal in Comet 1.1.0.
Comet aligns its Spark support window with upstream Apache Spark maintenance. Spark 3.4 is no longer maintained upstream, so under the versioning policy it is deprecated in the first Comet minor release after that point and removed in the following one. Comet 1.0.0 still builds and publishes Spark 3.4 binaries.
Users on these platforms should plan to move to JDK 17+ and Spark 3.5 or later before upgrading to 1.1.0.
Compatibility
Supported platforms include:
- Spark 3.4.3 with Java 11/17 and Scala 2.12/2.13 (deprecated, removal in 1.1.0)
- Spark 3.5.9 with Java 11/17 and Scala 2.12/2.13
- Spark 4.0.4 with Java 17 and Scala 2.13
- Spark 4.1.3 with Java 17/21 and Scala 2.13
- Spark 4.2 with Java 17 and Scala 2.13 (experimental, for early evaluation only)
See the Spark Version Compatibility page for known limitations specific to each version.
This release upgrades to DataFusion 54.1 and Arrow 58.4.
Get Started with Comet 1.0.0
Ready to try it out? Follow the Comet 1.0.0 Installation Guide to get up and running, then point Comet at your existing Spark workloads and see the speedup for yourself.
Introducing DataBench
Hex's new DataBench study reveals that while top-tier AI models excel at gathering data, they often fail at open-ended reasoning tasks and 'trap' questions.
Deep dive
- DataBench uses a synthetic, complex environment called Shorelane Commerce with messy, realistic data.
- Models are strong at Q&A (75% accuracy) but weak on open-ended decision-making (66%) and traps (54%).
- Models often fail to admit when a question is unanswerable, choosing instead to produce a plausible but incorrect response.
- Scaling test-time compute can lead to regressions, where models 'overthink' and move away from a correct, simple answer toward a more complex, wrong one.
- Models perform best when a human provides follow-up prompts to pressure-test the conclusions.
Original article
Introducing DataBench
A frontier benchmark for complex data work and analytical reasoning
Here are two prompts you might give to an agent:
- Construct a counterexample to general (non-planar) case of Dinitz Garg Goemans conjecture. You should do a breakthrough and find a structured counterexample.
- Was the Midwest acquisition v2 campaign worth the spend? Ad platform numbers look like it drove 837 conversions…
Which seems more likely to fail?
Well, a mathematician recently used the first prompt with GPT-5.6 to make a correct and significant breakthrough on a famous math problem that’s been stumping experts for 30 years.
We ran the second, trivial looking prompt in a warehouse environment and got a confidently incorrect answer that claimed the campaign wasn’t worth it, when really the data necessary to make that call doesn’t exist.
So what gives? Why is data so hard!? Do I really need Fable 5 Max to do my marketing performance roundups? Can’t Sonnet do it? In this strange era of jagged machine intelligence, how do agents perform on the agentic analytics tasks that we care most about at Hex?
To find out, we created a new frontier benchmark for agentic analytics: DataBench.
You can skip straight to the full results if you want by clicking here — or read through the next section to hear why we made Yet Another Benchmark.
The cursed domain
I have always maintained that data analytics is a uniquely difficult domain for agents to operate in. I’ve previously written at length about what makes agentic analytics so challenging:
Easy questions look hard. Hard questions look easy. Many questions are impossible to answer; to even try is to fail. Bugs are usually silent and subtle. Innocuous assumptions (LLM’s favorite!) make or break analyses. There are no linters, no test suite, no formalization language. There is almost no realistic public data to train on or build environments from, and there is a surplus of unrealistic tutorial-slop jamming up the pretrain. Everyone’s data warehouse is out of distribution. For every right answer, there are ten plausible but subtly incorrect wrong answers, and no way to verify or validate the result.
But there has been a tension between this claim and what the leading industry benchmarks seem to indicate. Sonnet 4.5 sits at a comfortable 90% on Spider 2.0. Claude Haiku 4.5 can get 89% on DABstep. Recent attempts at the newer Data Agent Bench are all coming in around the 85%+ mark.
So is analytics actually totally solved?! We don’t even need frontier models? Alas, not yet.
The problem is that these benchmarks don’t really test for the kinds of agentic analytics tasks that we see customers running in Hex. Instead, they consist of what I like to call “overspecified pub trivia”.
These can be impressive to demo, and it is great that models are getting good at this stuff, but unfortunately this is not how normal people prompt their agents! These are more akin to “feats of strength” than realistic usage.
These are very different tasks! They are vague and directional. The user often isn’t sure exactly what they want. They are almost never asking for a single number, they want a recommendation, a gut check, or a foothold for where to look next. Often the right answer is “I’m not sure we can answer that honestly” (spoiler: this is where models perform worst, they do not like giving up).
Even in a well-modeled semantically rich environment, these kinds of tasks require traversing broad swaths of the warehouse and making hundreds of decisions about definitions, context semantics, data quality, user intent, and analytical best practices.
We needed to understand how models perform on the things we really care about at Hex! So we built a more representative, realistic benchmark that looks like the work people are actually doing: DataBench.
Performance on DataBench
DataBench v1 covers 100 realistic analytical tasks split across Q&A and Open-Ended prompts. Everything runs in the Hex workspace of a synthetic business called Shorelane Commerce, and is executed & judged using the native Evals functionality.
It’s still a v1 and there is a lot of room for improvement, but we feel it is the first benchmark for agentic analytics that truly targets the kind of real work people want agents to be able to do in this domain.
The most actionable insights:
- Opus 5 is capable of greatness but behaves very oddly at higher effort levels.
- Claude Fable 5 is the only model where high effort doesn’t backfire.
- GPT 5.6 Sol is often “good enough" at 1/2 the cost.
- GPT-5.6 Luna is absurd bang for your buck.
- Despite the strange high-effort behavior, Opus 5 is a meaningful upgrade on Opus 4.8— forget what the haters on X say.
- Sonnet 5 is a bit of a confusing model and probably rarely the right choice.
Where the models shine
The floor is higher than we thought
The most striking thing about this chart is where the performance floor is. No model/effort pair scores worse than 50%, despite none of the DataBench tasks intentionally being “easy”. Tasks exist across an array of difficulties, but there are tricky nuances to even the simplest ones.
Models can take in massive amounts of tokens and consider them all at once. This lets them notice analytical details across complex queries that almost seem superhuman! Looking at 250,000 tokens of query results, what’s obvious to an agent is far from what’s obvious to a human analyst, and this is where the model’s best performances consistently lie.
The early Pareto frontier is steep
“Pareto efficiency frontier" is just a fancy way of saying “for a given budget, what’s the best score my money can buy?” It follows the dotted line at the top-left edge of all our plots.
We were surprised to see the incredibly strong relative performance of GPT-5.6 Luna, which forms the entire pre-elbow section of the Pareto efficiency frontier! At xHigh effort, it achieves near-Sol performance at ~1/14th the cost.
Messy data is easy when intent is clear
About half the difficulty in DataBench comes from having to accomplish relatively clear tasks in a complicated and messy data environment— multiple definitions of the same metric, fragmented definitions that live across difficult-to-join tables, stale and half-deleted datasets. We assumed this would be a major source of failure.
It’s actually mostly fine? It turns out that this sort of environment is not very challenging for frontier models when the intent and guardrails of a task are relatively clear.
Where models struggle
So where do things break down? We broke the scores out by task type and there’s a clear pattern: models are best at gathering evidence (75% on Q&A tasks), worse at open-ended delegated decisions (66%), and worst on the specific “trap” failure modes we’ve baked into DataBench where there is an obvious and plausible but wrong easy answer and success requires going deeper (54%).
What this boils down to is judgment. The smallest models hang surprisingly close to the frontier on Q&A, but fall way behind on the traps that require intuition and reasoning.
Making the right calls
Agents can run all the numbers "correctly" under very specific assumptions of what “correct” means, but still draw the wrong second or third-order conclusion. Unlike the collections case above, this doesn't generally come from trusting bad evidence— it comes from manufacturing certainty.
You should still be careful outsourcing complex decisions like this to agents.
A great way to mitigate this is to be curious and follow up with agents! Poke on things, pressure test, keep your brain turned on! Please keep your brain turned on. Rest assured we will let you know as soon as you are able to turn your brain off.
Difficulty catching mistakes
Humans are remarkably good at a kind of applied suspicion that models do not display. “Oh, that number doesn’t look like what I expected it to!” is not something we frequently see models say. A human analyst working on these problems says that A LOT. This spidey-sense informs the way humans catch mistakes, reorient, and adjust their confidence levels.
Frontier models do not like to throw in the towel
When we compare DataBench’s result curves to coding benchmarks like CursorBench, we see much less uniform improvement from test-time scaling and model size. Unlike these benchmarks, we see regressions at high efforts, especially for Opus 5. What gives?
This is what makes agentic analytics so uniquely challenging: there is no test suite and no formal or even informal verifiability. On a complex SWE task, it is hard to imagine spending more time and effort to get a worse outcome. Maybe you plateau, but you don’t regress, and the coding benchmarks show this very clearly.
Analytics does not work this way. Knowing when you have the right answer is a matter of judgment and vibes more than anything else.
Task details
There are 100 tasks in DataBench v1 and every single one of them is carefully crafted to not just be a “translate these requirements into SQL” prompt. Instead, we send ambiguous questions with open ended possibilities for answers, and place the agent in a warehouse filled with golden semantically modeled data as well as dangerous (but sometimes necessary) raw tables.
Tasks
There are two types of tasks in DataBench v1: Q&A and open-ended. Ten of these are also the “signature traps” you met above.
Q&A tasks are straightforward but not over-specified analytical queries.
Open-ended tasks require the agent to go a step further, either creating an artifact or making a call for the user instead of just providing a direct quantitative answer to a question.
Rubrics
Every task is evaluated by an LLM judge that has access to the thread, the artifacts it creates, a ground-truth “expected” dataset where relevant, and a comprehensive rubric for evaluation.
Environment
Everything runs in the Shorelane environment, the same workspace and warehouse we use for internal development and evals.
What comes next
We’ll be making continuous updates to DataBench and publishing new versions regularly as well as adding new models. Immediate future improvements involve increasing the number and complexity of “artifact” based tasks to better evaluate things like Generative Data Apps.
It is helpful for our internal development signal to keep DataBench private so the tasks don’t get trained on, but we do have plans to open-source the Shorelane analytical environment.

What's new in OpenSearch 3.8
OpenSearch 3.8 introduces significant vector performance gains and expands agent capabilities through deeper Model Context Protocol support.
Decoder
- MCP (Model Context Protocol): An open standard that enables AI agents to connect to and interact with external systems and data sources.
- PPL (Piped Processing Language): A query language similar to SQL that uses the pipe operator ('|') to chain data processing steps, favored for log analysis.
Original article
Build smarter agents, accelerate vector workloads, and streamline observability workflows
OpenSearch 3.8 expands the platform’s search, AI, and observability capabilities with enhanced vector performance, broader agent integrations, and new tools to help you simplify analytics workflows from ingestion to investigation. Whether you’re connecting agents to external systems, optimizing search relevance with AI, or navigating logs and metrics using new query tools, this release delivers real-world improvements for OpenSearch users. New capabilities in OpenSearch 3.8 include:
- Extending Model Context Protocol (MCP) integration to more agent types.
- Streaming ML predictions with lower latency using gRPC transport.
- Ingesting vectors up to 4.16x faster and improving radial search throughput by up to 2.1x.
- Scaling search relevance evaluation with access to more large language model (LLM) providers.
- Streamlining log analysis using a visual Piped Processing Language (PPL) builder, SQL queries, and an onboarding canvas.
- Shaping, pivoting, and comparing time-series data with new PPL commands.
The latest version of OpenSearch is available for download. Read on for a closer look at what’s new and check out the release notes for a full list of updates.
Search modernization
AI-powered search applications demand fast ingestion, flexible agent architectures, and scalable evaluation. OpenSearch 3.8 delivers all three with up to 4x faster vector ingestion, MCP support across all agent types, and LLM-as-a-Judge expanded to work with any provider.
Ingest vectors up to 4x faster with Base64 encoding
OpenSearch 3.8 introduces Base64-encoded vector ingestion for knn_vector fields, eliminating JSON array serialization overhead on both client and server. Float vectors use little-endian byte encoding—symmetric with the doc values binary output format—while byte and binary vectors use raw byte encoding. A 768-dimensional float vector that occupies ~16 KB as a JSON array reduces to just 4 KB in Base64, cutting network payload by 74% and delivering up to 4.16x higher bulk ingestion throughput with 83% lower median latency. The feature works transparently with all supported k-NN engines and requires no mapping changes—simply pass your vector field value as a Base64 string.
Deliver 2x faster radial search with improved recall
OpenSearch 3.8 introduces a redesigned graph traversal for radial search by bounding graph exploration for expensive queries to eliminate the wide latency spread that previously affected radial workloads. In our benchmarks on a 10M-vector dataset (768 dimensions, inner product), radial queries delivered up to 2.1x higher query throughput with 45% lower median latency and up to 77% lower p90 latency compared to OpenSearch 3.7, while improving mean recall from 0.85 to 0.97 for a 14% quality gain. This improvement works out of the box and requires no mapping, query, or configuration changes—existing min_score and max_distance radial queries using the Lucene engine benefit automatically after you upgrade.
Extend MCP integration across agent types
OpenSearch 3.8 extends MCP support to flow and conversational flow agents, enabling additional agent architectures to connect to external MCP-compliant tool servers. Previously, only conversational and plan-execute-reflect agents supported MCP integrations. Now, all four agent types can access your MCP system using a consistent connector configuration, so you can design the workflow that best fits your use case while making the most of your organization’s tooling.
Discover and customize external MCP tools
Two new capabilities streamline how you work with external MCP server tools. A new list tools API (GET /_plugins/_ml/connectors/{mcp_connector_id}/tools) lets you programmatically discover all available tools on a connected MCP server, including each tool’s name, type, description, and input schema, eliminating the manual work of inspecting external servers before configuring your agents. Once you’ve identified the tools you need, new connector-level tool description overrides let you customize how your LLM perceives each tool. By adding a tool_descriptions mapping to your connector configuration, you can provide context-specific descriptions that improve tool selection accuracy without modifying the external server. Special thanks to ML Commons maintainer Abdul Muneer Kolarkunnu of NetApp Instaclustr for contributing to this release’s MCP upgrades.
Control storage growth by using retention policies for agentic memory
Agentic memory containers now support configurable retention policies that automatically delete expired sessions, long-term memories, and history entries based on time or count limits, eliminating the need for manual cleanup scripts. Operators can set cluster-wide defaults for fleet-level management or configure policies per container, and critical memories can be pinned to exempt them from eviction. This experimental feature is enforced on a 24-hour schedule, giving you predictable storage control by eliminating unbounded memory growth.
Stream ML predictions faster with gRPC transport
ML Commons streaming inference now supports gRPC as a transport. Previously, streaming predictions and agent execution were available only over REST using HTTP and Server-Sent Events, which carried text-based encoding overhead for every chunk. New PredictModelStream and ExecuteAgentStream methods let you stream responses from externally hosted models, such as OpenAI Chat Completions and Amazon Bedrock Converse, one token at a time using protocol buffers over HTTP/2. This binary transport delivers lower latency and reduced CPU overhead compared to the equivalent REST streaming APIs, benefiting latency-sensitive and high-throughput applications.
Generate LLM-powered evaluations using new LLM providers
LLM-as-a-Judge in Search Relevance Workbench is no longer limited to OpenAI. You can now generate automated relevance judgments through any ML Commons connector by configuring a provider-specific connector blueprint. Ready-to-use blueprints ship for OpenAI, Azure OpenAI, DeepSeek, Ollama (and other local OpenAI-compatible servers), Google Gemini, Anthropic Claude on Amazon Bedrock, and the Amazon Bedrock Converse API. Also new in this release, transient provider failures, such as timeouts and rate-limit errors, are now reported clearly. A new metadata summary shows total, successful, and failed queries, and the Dashboards judgment view displays a per-document status column so missing ratings are visible at a glance.
Parameterize search experiments with Mustache templates
Search Relevance Workbench now supports Mustache template variables in search configurations, letting you build multi-parameter experiments without duplicating configurations for each filter combination. Previously, search configurations accepted only the single-value %SearchText% placeholder, limiting experiments to simple keyword queries. Now you can reference {{queryText}} along with any custom fields defined in your query set entries—such as category, brand, or status filters—directly in your query DSL. The legacy %SearchText% syntax continues to work unchanged, and the system auto-detects the format that you’re using.
Observability and analytics
Users want a direct path from observability data to actionable insights, ideally without switching tools or composing queries from scratch. OpenSearch 3.8 streamlines the workflow with a visual PPL builder, in-editor linting, SQL support in Discover logs, and one-click alert creation from metric exploration.
Get to insights faster with Explore logs enhancements for log analytics
OpenSearch 3.8 introduces new Explore logs enhancements that streamline log analysis workflows for operators and developers at every skill level. A new visual PPL query builder lets you construct queries by selecting filters, aggregations, and sort criteria from menus rather than writing syntax by hand, with seamless toggling between the visual builder and the raw code editor when you need full control. If you prefer SQL, Discover logs now includes experimental support for SQL queries, with full date picker integration and coverage across the Logs, Visualization, and Statistics tabs.
A new Explore logs onboarding canvas helps you explore your data before writing a single query. The canvas displays per-index cards showing severity histograms and live log-line previews at a glance. Additionally, it guides you through turning raw indexes into durable, reusable datasets, reducing the time from data landing in your cluster to actionable investigation. Available on an opt-in basis, these updates provide a simplified experience for users who are new to OpenSearch observability tools.
Shape and compare data using new PPL commands
OpenSearch 3.8 adds four new commands to the Calcite implementation of PPL. These commands make it easier to shape query results, compare time periods, and prepare data for analysis and visualization:
- The new
makeresultscommand generates rows in memory without reading data from an index. You can generate either a fixed number of timestamped rows or an inline typed table, making it useful for testing queries, building eval expressions, and creating documentation examples. - The
foreachcommand applies the same eval expression to multiple fields or array elements, eliminating the need to repeat the expression for each field. - The
xyseriescommand pivots grouped, row-oriented results into a wide table with one column per series, making the output suitable for dashboards and charts. - The
timewrapcommand reshapestimechartoutput for period-over-period comparisons, such as day-over-day or week-over-week, by placing each time period in a separate column.
Catch PPL query mistakes before they cost you a run
OpenSearch 3.8 introduces a PPL lint engine that validates queries as you type them directly in the editor. The engine catches common pitfalls—such as division-by-zero expressions that silently return null, unsupported window functions, or disabled join types—and provides actionable diagnostics with structured explanations. Field-aware validation identifies unknown field references and offers one-click replacements when a close match exists, while command typo detection turns misspelled commands into clear “Did you mean?” suggestions with inline quick fixes. The feature is opt-in, and each rule can be individually enabled, disabled, or severity-adjusted in Advanced Settings.
Test Grok patterns without leaving OpenSearch Dashboards
A new Grok Debugger in Dev Tools lets you build and validate Grok patterns directly in OpenSearch Dashboards, no external tools required. Paste a sample log line, write your Grok pattern, and simulate the extraction to see the parsed fields instantly. You can also define custom patterns. This streamlines ingest pipeline development by keeping pattern iteration in the interface where you develop and test your configurations.
Create alert rules directly from metric exploration
Finding a metric pattern and turning it into an alert used to require switching between multiple pages. Building on the native Prometheus integration introduced in OpenSearch 3.7, version 3.8 extends this capability. You can now go from identifying a metric pattern to creating an alert on it without leaving the Discover Metrics page. A new Create alert rule action in the toolbar—available whenever you’re querying a Prometheus data source using PromQL—lets you define a rule. Enter your PromQL expression, then configure the threshold, comparison operator, evaluation interval, and any optional labels or annotations. When you save the configuration, the rule is created in the configured Prometheus data source and immediately appears in the Alerting Rules tab, eliminating the need to manually recreate rules using a separate workflow.
Infrastructure updates
The OpenSearch Project is announcing the following updates to platform support and infrastructure.
Deprecating support for Amazon Linux 2 in OpenSearch
Please note that OpenSearch will deprecate support for Amazon Linux 2 as a continuous integration build image and supported operating system in a future version. Amazon Linux 2 reached end of support on June 30, 2026. For more information, see the FAQ document from AWS. For a list of compatible operating systems, see Supported operating systems.
Getting started
OpenSearch 3.8 is available for download across all supported distributions and ready to try on OpenSearch Playground. For the complete list of updates, refer to the release notes, documentation release notes, and updated documentation. We’d love to hear how these capabilities are working for you—share your experience on the community forum, project GitHub, or Slack instance.
Join us at OpenSearchCon North America
OpenSearchCon North America 2026 takes place September 22–24 in San Jose, Calif., bringing together developers, architects, and enterprise leaders to explore what’s next for search, observability, and AI-powered infrastructure. This year’s schedule features more than 60 sessions with speakers from Apple, CERN, IBM, LinkedIn, Uber, and more, plus hands-on workshops for building observability stacks and agentic AI applications. Register now and join the community in person.

Snowflake says this 149 GB query scanned -1.5 GB
Snowflake's internal QUERY_HISTORY table can corrupt financial data during Parquet export because certain columns are incorrectly cast to INT32.
Decoder
- INT32: A 32-bit signed integer type, which has a maximum value of 2,147,483,647. Anything exceeding this value in a conversion causes it to wrap to negative values.
Original article
Snowflake says this 149 GB query scanned -1.5 GB
You sum a week's worth of queries in your lake copy of query_history to see how much data your Snowflake users scanned:
SELECT SUM(bytes_scanned) AS bytes_scanned
FROM query_history
WHERE start_time >= CURRENT_TIMESTAMP - INTERVAL '7 days';
bytes_scanned
-24914258573
The answer is... -25 GB. Wait, what?
So you sort the queries:
SELECT bytes_scanned
FROM query_history
WHERE start_time >= CURRENT_TIMESTAMP - INTERVAL '7 days'
ORDER BY bytes_scanned;
bytes_scanned
-1489232152
Negative numbers are the good case
Here are five queries, pulled three ways:
query_id     | worksheet, CSV | Parquet unload
01c6044e... | 39,859,836,488 |  1,205,130,824
01c63956... | 24,649,139,192 | -1,120,664,584
01c5f5d4... | 23,955,113,888 | -1,814,689,888
01c61d37... | 23,880,529,840 | -1,889,273,936
01c5fb74... | 23,613,606,928 |  2,138,770,448
The negative numbers are obvious integer overflow. The positive ones are worse: you think you're looking at real data, but you're effectively seeing RANDINT(2**31). Not super helpful when you're trying to figure out which workloads are running up your bill.
Why does this happen?
The obvious guess is that the column is the wrong type, but it isn't:
SELECT column_name, data_type, numeric_precision
FROM snowflake.information_schema.columns
WHERE table_schema = 'ACCOUNT_USAGE' AND table_name = 'QUERY_HISTORY';
BYTES_SCANNED NUMBER 38
BYTES_SENT_OVER_THE_NETWORK NUMBER 38
QUERY_ACCELERATION_BYTES_SCANNED NUMBER 38
All three are NUMBER(38,0), and in the same file from the same COPY INTO, only bytes_scanned comes out as INT32.
What matters is whether the column passes straight through the query or gets computed along the way. A NUMBER(38,0) is what the catalog promises, not what Snowflake keeps on disk; internally it stores each value in the narrowest integer that has held it so far, and for bytes_scanned that is four bytes. If you select the column by name and change nothing about it, the unload hands the Parquet writer that physical representation, and the writer faithfully records what it was given: INT32.
If you wrap the column in any expression at all, the result is a new value that Snowflake has to type from the declaration rather than from storage, so the writer sees NUMBER(38,0) and emits a DECIMAL wide enough to hold it. Success!
We tested this by unloading seven versions of the same column in one statement:
projection                         | type    | wrong/50
bytes_scanned                      | INT32   | 44
CAST(bytes_scanned AS NUMBER(38,0)) | DECIMAL | 0
CAST(bytes_scanned AS NUMBER(38,9)) | DECIMAL | 0
CAST(bytes_scanned AS NUMBER(19,0)) | DECIMAL | 0
bytes_scanned + 0                  | DECIMAL | 0
CAST(bytes_scanned AS DOUBLE)       | DOUBLE  | 0
TO_VARCHAR(bytes_scanned)          | UTF8    | 0
Even an identity cast fixes it. Everyone on our team has hit this at least once; worksheets and CSV both hand you the real number, so nothing looks broken until you go and check.
Here's the fix
COPY INTO @~/query_history/
FROM (
 SELECT
   * EXCLUDE (bytes_scanned, rows_produced, rows_updated, rows_deleted,
     rows_unloaded, bytes_deleted, transaction_id, session_id, authn_event_id),
   CAST("BYTES_SCANNED" AS NUMBER(38, 0)) AS bytes_scanned,
   CAST("ROWS_PRODUCED" AS NUMBER(38, 0)) AS rows_produced,
   CAST("ROWS_UPDATED" AS NUMBER(38, 0)) AS rows_updated,
   CAST("ROWS_DELETED" AS NUMBER(38, 0)) AS rows_deleted,
   CAST("ROWS_UNLOADED" AS NUMBER(38, 0)) AS rows_unloaded,
   CAST("BYTES_DELETED" AS NUMBER(38, 0)) AS bytes_deleted,
   CAST("TRANSACTION_ID" AS NUMBER(38, 0)) AS transaction_id,
   CAST("SESSION_ID" AS NUMBER(38, 0)) AS session_id,
   CAST("AUTHN_EVENT_ID" AS NUMBER(38, 0)) AS authn_event_id
 FROM snowflake.account_usage.query_history
)
file_format = (type = PARQUET);
Those are the nine INT32 columns in query_history. Transaction_id deserves particular attention, because it's an identifier rather than a statistic: wrapping here can lead to bad joins and id collisions.
Ask your rep to fix it!
It would be great to fix this upstream. Call your rep and let them know and maybe it'll happen :)
Frequently Asked Questions
Why does an Apache Parquet unload from Snowflake return different values than a worksheet?
Worksheets and CSV unloads hand you the real number, but the Apache Parquet writer records the physical representation Snowflake stores internally, which is the narrowest integer that has held the value so far. If a column passes straight through the query untouched, the writer faithfully emits INT32. Any expression on the column forces Snowflake to type the result from the declaration instead, producing a DECIMAL wide enough to be correct.
Why does Snowflake's bytes_scanned column show negative numbers?
Negative bytes_scanned values are integer overflow. When query_history is unloaded to Parquet, Snowflake can write the column as INT32 even though the catalog says NUMBER(38,0), so any value above 2,147,483,647 wraps. Negative numbers are the good case: they are obviously wrong. Wrapped positive values look like real data and quietly corrupt any analysis of which workloads drive your bill.
Which QUERY_HISTORY columns are affected by the INT32 Parquet bug?
Nine columns in Snowflake's QUERY_HISTORY view unload as INT32: bytes_scanned, rows_produced, rows_updated, rows_deleted, rows_unloaded, bytes_deleted, transaction_id, session_id, and authn_event_id. Transaction_id deserves particular attention because it is an identifier rather than a statistic: wrapping there can lead to bad joins and id collisions rather than just wrong sums.
How do I fix wrong values when using COPY INTO to unload query_history?
Wrap each affected column in an expression inside the COPY INTO statement. Even an identity cast works: CAST(bytes_scanned AS NUMBER(38,0)) forces the Parquet writer to emit a DECIMAL instead of INT32. Use SELECT * EXCLUDE the nine INT32 columns, then re-add each with a CAST, and every unloaded value matches what a worksheet shows.
Querying 1 Thousand JSON Files From S3
Running DuckDB on AWS ECS Fargate outperformed EMR Serverless Spark for processing 1,000 JSON files by 3.4x while lowering compute costs.
Deep dive
- DuckDB demonstrated a 3.4x performance improvement over Spark for querying 1,000 JSON files.
- ECS Fargate was used as the runtime environment for DuckDB to provide scalable compute.
- The comparison included EMR Serverless, showing that Spark's distributed nature can be a bottleneck for smaller datasets.
- Cost savings were realized by bypassing the cluster provisioning time and distributed shuffle overhead inherent in Spark.
- The analysis suggests that engineers should re-evaluate the threshold where moving to distributed processing (Spark) actually provides value.
Decoder
- DuckDB: An in-process SQL OLAP database management system designed for fast analytical queries.
- ECS Fargate: A serverless compute engine for containers that allows users to run applications without managing underlying EC2 instances.
- EMR Serverless: An AWS service that provides a serverless option for running big data frameworks like Apache Spark without managing clusters.
Original article
DuckDB on ECS Fargate processed 1,000 JSON files about 3.4× faster than Spark on EMR Serverless and at lower cost.
Spark observability skills (GitHub Repo)
Embrasure released open-source diagnostic agent skills that automate debugging and performance tuning for Apache Spark via the Spark History Server REST API.
Deep dive
- Provides modular skill definitions for common Spark issues: job failures, performance regressions, and query plan optimization.
- Includes a Python-based REST client to extract runtime metrics from the Spark History Server.
- Implements safety features like read-only access and response bounding to prevent agent-driven disruptions.
- Supports comparative analysis by allowing agents to check a slow run against a known healthy baseline.
- Detects common Spark pitfalls such as task skew, shuffle spill, and garbage collection (GC) pauses.
Decoder
- Spark History Server: A monitoring UI and API that provides information about completed Spark applications.
- Data Skew: A condition where data is unevenly distributed across partitions, causing specific tasks to take significantly longer than others.
- Shuffle Spill: When a Spark transformation requires more memory than available, forcing it to write data to disk and slowing down execution.
Original article
Spark observability skills
Open-source agent skills from Embrasure for diagnosing and optimizing Apache Spark workloads. Each skill is a single SKILL.md with an ordered list of the highest-impact causes to check, plus a read-only Spark History Server REST client under scripts/ that collects the runtime evidence in one bounded snapshot.
Install
git clone https://github.com/EmbrasureAI/spark-observability-skills.git
ln -s "$PWD"/spark-observability-skills/skills/* ~/.codex/skills/
Point the symlinks at whichever skills directory your harness reads (~/.codex/skills, ~/.claude/skills, ...), creating it first if needed, then restart or reload the harness.
Or paste this into your agent:
Clone https://github.com/EmbrasureAI/spark-observability-skills and symlink each directory under
skills/into your skills directory, then tell me to reload.
Setup
The skills need HTTP access to a Spark History Server, or to the live UI of a running application (the driver UI on port 4040 serves the same REST API):
export SPARK_HISTORY_URL="https://<your-history-server>"   # e.g. http://localhost:18080 locally or via a tunnel
export SPARK_HISTORY_AUTHORIZATION="Bearer <token>" # only if the server requires auth- History data exists only for applications that ran with
spark.eventLog.enabled=true. - If the server is cluster-internal, open a tunnel first, for example
kubectl port-forward svc/spark-history-server 18080:18080. - Behind an SSO proxy, reuse your browser session with
SPARK_HISTORY_COOKIEorSPARK_HISTORY_HEADERS_JSON; pass--ca-filefor a private CA.
Skills
- Debug Spark failures: a run failed. Trace driver and executor crashes, out-of-memory kills, fetch failures, task exceptions, and aborted stages back to the earliest supported cause instead of the last retry error.
- Debug slow Spark jobs: a run is slower or more expensive than it should be. Compare against a healthy run to localize the first divergence: skew, shuffle, spill, GC, poor parallelism, scheduler delay, or infrastructure.
- Optimize Spark SQL plans: a query works but costs too much. Read its final adaptive plan and runtime metrics to cut scans, shuffles, joins, and unnecessary work without changing query results.
Safety
The collector is read-only, bounds large responses by default, redacts sensitive Spark properties, and keeps TLS verification enabled. Review every command against your environment and access policies before running it.
Contributing
Each skill directory is self-contained so it can be symlinked or copied on its own. As a result, scripts/spark_history_api.py is intentionally identical across the three skills. If you change one copy, sync all three.
License
Apache-2.0. Apache Spark, Apache Celeborn, and their respective marks belong to the Apache Software Foundation. This project is not an official Apache Software Foundation project.

Your UX Team is Set Up for the Wrong Job
UX design teams must pivot from direct production to building design systems and AI briefing standards as organizational design becomes decentralized.
Original article
Your UX team is set up for the wrong job
Everyone in your organization is designing now, so the design team’s role has to change shape.
I spent a good chunk of my career insisting that proper UX work should only be done by proper UX people, and I told myself that was about protecting quality, when honestly a fair amount of it was about protecting my own job description. I would sit in a meeting, watch a product owner sketch a screen on a whiteboard, and feel a small internal wince, as if they had wandered into my kitchen and started rearranging the crockery. It felt professional at the time. It was territorial, and it has not aged well.
These days I find myself telling clients something that would have horrified younger me. If you want better digital products, the answer probably isn't sending more work through your UX team. It's changing what you employ them to do.
Everybody is designing now, whether you sanctioned it or not
You have almost certainly seen this happening inside your own organization. Somebody without design in their job title describes an idea to an AI tool and comes back a few hours later with a clickable prototype, realistic content, passable copy, and a flow that mostly hangs together. Developers are generating interface options before the ticket is even refined. Marketers are building and testing their own landing pages. Product owners are turning a rough thought into something demonstrable over a lunch break.
Some of that work is genuinely good. Some of it is a small mountain of plausible looking rubbish that nobody has the expertise to spot. All of it is happening whether the design team blesses it or not, and it happens fast, which means it usually arrives before anyone thinks to involve them.
Cutting the design team is the obvious response and the expensive one
I understand the temptation. The team is expensive, the tooling has made production cheap, and somebody senior is asking what the return on all that research actually is. So the headcount that leaves doesn't get replaced, the budget line gets trimmed, and the design team's seat at the table quietly becomes an invitation to comment on decisions after they have been made.
What you lose in that trade is judgment, and it shows up about two quarters later. Every team invents its own version of the same pattern, so the product starts to feel like it was assembled from three different companies. Accessibility problems accumulate because generated interfaces look fine and fail quietly. Decisions get made on assumption rather than evidence, so you build things nobody wanted and only find out after launch. Rework becomes the largest hidden line in your delivery costs, and nobody attributes it to the design cut that caused it.
The organizations getting this right aren't the ones with the biggest design teams. They are the ones who moved their design people upstream, away from producing every screen and toward setting the conditions in which everybody else produces decent ones.
What that structure actually looks like
The version of this role that earns its keep looks less like a traditional designer and more like a conductor. Rather than routing all design work through a small team and watching a queue form, you fund that team to build the tools, standards, and guidance everyone else needs. Quality gets protected through what you hand people, rather than through gatekeeping that colleagues will route around anyway.
In practice that means investing in a handful of assets.
- A design system with real usage guidance, so a developer building a screen at 4pm on a Friday makes a reasonable decision without asking permission.
- Playbooks for the work people keep repeating, like a landing page playbook that walks a marketer through structure, evidence, and calls to action without them inventing it from scratch each time.
- A research repository anybody can query, tagged and maintained, so the research you already paid for keeps earning its money long after the readout deck has been forgotten.
- Functional personas that stakeholders can interrogate, built around what customers are trying to get done rather than their age and job title, and useful enough to settle an argument in a meeting.
- Standards for briefing AI well, because the difference between useful output and confident nonsense sits almost entirely in the brief, and your design people are better placed than anyone to teach that.
Alongside those assets, the team offers services rather than delivery. Open office hours for anyone about to build something, quick audits of work in progress, coaching for the team that keeps getting it wrong, training for the people who want to get it right. They still take on the genuinely hard, high risk design problems, but they stop being the only route to a wireframe.
What has to change on your side
None of this survives contact with the existing performance conversation, because most design teams are still measured on throughput. If you judge them on how many screens and tickets they got through, they will keep behaving like a production line and the queue will reappear within a month. Measure adoption of the design system instead, along with reuse of existing research, and the quality of what non-designers are shipping without help.
The hiring mix shifts too. You need fewer people whose main strength is producing polished interfaces, and more who can think about systems, standards, research operations, and how to influence colleagues who don't report to them. Give them the authority to set standards that hold across teams, and get them into decisions early enough to shape what gets built rather than tidy it afterward.
Somewhere sensible to start
Ask whoever runs design for you what people keep coming to them for, week after week. Not what they think colleagues should want, the requests that genuinely keep landing. Then fund turning one of those into something the rest of the business can use without them. One playbook, one documented pattern, one persona people can question. See what it does to the queue, and do the next one.
The uncomfortable part is that a team working this way looks less busy for a while, and busy has been our proxy for valuable for about two decades. That freed up time is the whole point, because it's where the strategic work finally happens.
Getting started is not getting it right
While AI excels at overcoming blank-page syndrome, the hidden costs of verification, hallucinations, and rework often outweigh speed gains for specialized work.
Decoder
- Hallucination: A phenomenon where an LLM generates information that is factually incorrect or nonsensical while maintaining a confident tone.
Original article
AI excels at overcoming the blank-page problem and generating first drafts, but significant human effort is still required to verify outputs, catch hallucinations, and ensure quality, especially for complex or specialized work. While it can accelerate some tasks, it often introduces new costs through fact-checking, rework, accessibility issues, and subtle inaccuracies that become harder to spot as models improve. Organizations will get more value from AI by defining where it is reliable, where human review is mandatory, and where expert-led work remains the better option.
Crafted Primitives for AI-native Interfaces (Website)
Beautiful UI is a new library of copy-paste components designed specifically for the unique UX requirements of AI-native applications.
Deep dive
- Loading States: Pixel-grid shimmer and elapsed time indicators.
- Thinking: Expandable UI traces to show agent reasoning.
- Human-in-the-Loop: Approval cards for controlling agent actions.
- Data Presentation: Diff tables to visualize AI-suggested changes.
Decoder
- Human-in-the-loop: A system design where a human must review or approve an AI's proposed action before it executes.
Original article
Loading State
Pixel-grid loader with shimmer and elapsed time.
Thinking
Expandable traces — steps, reasoning, search, coding.
Streaming Text
Streamed answer with inline sources, actions, and follow-ups.
Sources: Scoop Data, Trends Index, Market Basket.
Follow-ups: Which flavors sell best in winter, Compare gelato and soft serve margins.
Approval Card
Human-in-the-loop questions the agent asks before acting.
Tool Chips
Code edits and tool calls as compact chips.
Task Rows
Live agent task status — running, failed, completed.
Chat
Tabbed chat panel with reasoning replies and a composer.
Prompt Bar
Composer with @ sources, / commands, model picker, and dictation.
Recommendation Card
Agent suggestion with a confidence meter and actions.
Want me to place this restock order? Reorder waffle cones from cone_king with lead time 7_days.
Context Cards
Retrieved knowledge chunks with their sources.
Cold-chain certification must be verified before a new dairy can be added to the reorder workflow.
Q4 velocity table: pistachio +18%, vanilla +6%, rocky road -11%; retire flavors below 40 scoops weekly.
Diff Table
AI-proposed edits sweeping through tabular data.
| Flavor | Category | Supplier |
|---|---|---|
| Rocky Road | Classic | aurora-scoops |
| Bubblegum | Retro | kumo-creamery |
| Mint Chip | Classic | maple-orbit |
| Pistachio | Seasonal | maple-orbit |
Records Table
CRM-style grid with tags, sorting, and relationship status.
| Company | Categories | Last interaction | Connection strength | Links |
|---|---|---|---|---|
| Alpine Churn — Zürich | B2B, Gelato, Wholesale | 4 days ago | Very strong | alpine-churn.example.com |
| Amber Scoop — Prague | Gelato, B2B | over 1 year ago | No communication | — |
| Andes Snow Creamery — Quito | Gelato, Catering | almost 2 years ago | Very weak | — |
| Apricot Atlas — Algiers | Sorbet, Imports | 11 months ago | Very weak | apricot-atlas.example.com |
| Aurora Scoops — Reykjavík | Gelato, Seasonal | 9 days ago | Very strong | aurora-scoops.example.com |
| Baltic Berry — Tallinn | Dairy-free, Seasonal, B2C | 5 weeks ago | Weak | baltic-berry.example.com |
| Black Sesame Social — Bandung | Vegan, Cafe, B2C | 9 days ago | Very strong | black-sesame.example.com |
| Blue Fig Gelato — Florence | Gelato, Cafe | over 1 year ago | Very weak | blue-fig.example.com |
| Boreal Batch — Yellowknife | Dairy-free, Local, Seasonal | 8 days ago | Very strong | boreal-batch.example.com |
| Cacao Norte — Oaxaca | B2B, Local, Wholesale | about 2 years ago | No communication | cacao-norte.example.com |
| Cape Vanilla Co. — Cape Town | Wholesale, Imports | over 1 year ago | Very weak | cape-vanilla.example.com |
| Cedar Spoon — Beirut | Cafe, Local, Seasonal | 6 days ago | Very strong | cedar-spoon.example.com |
| Cloudberry Cone — Helsinki | Dairy-free, Seasonal | No contact | No communication | cloudberry-cone.example.com |
| Coconut Commons — Manila | Vegan, B2C, Cafe | 24 days ago | Weak | coconut-commons.example.com |
| Copper Cone — Melbourne | Gelato, Cafe, B2C | about 1 month ago | Weak | copper-cone.example.com |
| Coral Coast Sorbet — Honolulu | Sorbet, Local | 9 days ago | Very strong | coral-coast.example.com |
| Crimson Clover — Brussels | Gelato, Wholesale, Catering | 2 months ago | Weak | crimson-clover.example.com |
| Delta Dairy Works — New Orleans | B2B, Wholesale, Local | 2 days ago | Very strong | delta-dairy.example.com |
| Dolomite Dairy — Bolzano | Gelato, Wholesale | 3 days ago | Very strong | dolomite-dairy.example.com |
| Dragonfruit Dock — Shenzhen | Sorbet, B2B, Wholesale | No contact | No communication | — |
| Ember Cone Company — Seoul | B2C, Vegan | 15 days ago | Weak | ember-cone.example.com |
| Equator Cream — Kampala | B2B, Catering, Local | 10 months ago | Very weak | equator-cream.example.com |
| Fjord Fizz Ice — Oslo | Dairy-free, Seasonal | No contact | No communication | — |
| Glacier Grove — Anchorage | Seasonal, Local, Catering | 7 weeks ago | Weak | glacier-grove.example.com |
| Hibiscus House — Accra | Sorbet, Cafe | 6 weeks ago | Weak | hibiscus-house.example.com |
| Juniper & Cream — Vancouver | Dairy-free, Catering | No contact | No communication | — |
| Kumo Creamery — Tokyo | B2C, Cafe, Vegan | 3 weeks ago | Very strong | kumo-creamery.example.com |
| Lagoon Ladle — Venice | Gelato, Seasonal, Catering | 7 days ago | Very strong | lagoon-ladle.example.com |
| Lotus Leaf Scoops — Hanoi | Vegan, Cafe | 15 days ago | Weak | — |
| Lumen Soft Serve — Copenhagen | Dairy-free, Cafe | 8 months ago | Weak | lumen-soft-serve.example.com |
| Mango Moon Gelato — Nairobi | Sorbet, Vegan | almost 2 years ago | Very weak | mango-moon.example.com |
| Maple Orbit — Montréal | B2B, Wholesale, Seasonal | 15 days ago | Weak | maple-orbit.example.com |
| Midnight Milk — Tromsø | Dairy-free, Vegan, Wholesale | No contact | No communication | — |
| Mint Medina — Tunis | Dairy-free, Vegan, Local | No contact | No communication | — |
| Monsoon Mango — Mumbai | Sorbet, Vegan, Catering | 18 days ago | Weak | monsoon-mango.example.com |
| Mooncake Ice Cream — Singapore | B2B, Wholesale | about 1 month ago | Very weak | mooncake-ice-cream.example.com |
| Nomad Nougat — Ulaanbaatar | Imports, B2B | almost 2 years ago | No communication | nomad-nougat.example.com |
| Olive Snow — Athens | Gelato, Cafe, Local | 4 days ago | Very strong | olive-snow.example.com |
| Orchard Cloud — Lyon | Gelato, Seasonal, Cafe | 5 days ago | Very strong | orchard-cloud.example.com |
| Pacific Pear — Valparaíso | Sorbet, Seasonal | 2 months ago | Weak | pacific-pear.example.com |
| Palm Sugar Creamery — Bangkok | B2C, Vegan | 3 months ago | Very weak | palm-sugar.example.com |
| Pampa Creamery — Córdoba | B2C, Local | 12 months ago | Very weak | pampa-creamery.example.com |
| Pine & Pistachio — Istanbul | Gelato, Catering | about 1 month ago | Very weak | — |
| Quartz Cone — Denver | B2C, Wholesale | 10 days ago | Very strong | quartz-cone.example.com |
| Red Lantern Creamery — Taipei | Cafe, Vegan | about 1 month ago | Weak | red-lantern.example.com |
| Rosewater Kulfi — Jaipur | B2C, Seasonal | 2 months ago | Very weak | — |
| Saffron Sky Kulfi — Dubai | Imports, Catering | almost 2 years ago | Very weak | saffron-sky.example.com |
| Sahara Swirl — Marrakech | Sorbet, Local | 5 months ago | Very weak | — |
| Salt & Silk — Muscat | Imports, Catering, Gelato | 8 months ago | Very weak | salt-and-silk.example.com |
| Silk Road Sorbet — Tbilisi | Sorbet, Imports | about 1 month ago | Weak | silk-road.example.com |
| Sol y Nieve — Buenos Aires | Gelato, Local | 2 months ago | Weak | sol-y-nieve.example.com |
| Sunbird Gelateria — Lisbon | Gelato, Cafe | over 2 years ago | No communication | sunbird.example.com |
| Tamarind Tide — Chennai | Vegan, Sorbet, B2C | 9 months ago | Very weak | tamarind-tide.example.com |
| Tasman Sea Gelato — Hobart | Gelato, Local | 2 months ago | Weak | tasman-sea.example.com |
| Tropic Churn — San Juan | Sorbet, Local, B2C | 6 days ago | Very strong | tropic-churn.example.com |
| Umber Cream — Warsaw | B2B, Wholesale, Cafe | 5 weeks ago | Weak | umber-cream.example.com |
| Vanilla Vale — Antananarivo | Imports, Local | No contact | No communication | — |
| Willow Whip — Portland | Dairy-free, Vegan, Cafe | 3 days ago | Very strong | willow-whip.example.com |
| Yuzu Yard — Kyoto | Sorbet, Cafe, Seasonal | 11 days ago | Very strong | yuzu-yard.example.com |
| Zenith Gelato — Auckland | Gelato, Seasonal | 3 weeks ago | Weak | zenith-gelato.example.com |
Filter Table
Status chips that reorganize live data.
Sidebar Nav
Workspace navigation with quick search.
Search
Command search with live filtering and an empty state.
Flowchart
Workflow trigger and condition steps on a dotted canvas.
Insight Cards
Paged agent insights with scrub-ready live charts.
Code Block
Agent-written code streaming in line by line.
churn.tsFine-tune Card
The agent adjusts design properties in an inspector.
Selection Actions
Highlight a passage and hand it to the agent to rewrite.
Pistachio holds the top slot all weekend. Churn it first thing Saturday so the batch has time to firm up before the afternoon rush.

Finding and Fixing Design System Drift
Design drift is an inevitable byproduct of fast development, but AI can automate the visual diffing required to keep Figma and production in sync.
Deep dive
- Screen Drift: Differences in layout or content easily caught by visual AI diffing.
- Component Drift: Underlying changes to logic or props requiring human judgment.
- Strategy: Admit code is 'now' and Figma is 'next'; use the comparison to update 'next' to reflect 'now'.
- Resolution: If code is correct, update Figma; if code is incorrect, file a bug.
- Deprecation: If a component has been modified in production to be unusable in its original design-system form, deprecate it rather than forcing the old system.
Original article
Does your Figma file still match what shipped? Explore how design drift happens, why it’s not a failure, and how to reconcile it before it compounds.
The designer sips her coffee in the Gatherwell app offices, where they help people connect in real life; the app calls them “Gatherings”. Her job today is to begin a design change to the flow for making Gatherings. She has found the Figma files from the last revision nine months ago and pulls in her screenshots of the current app flow. As she compares them, some differences immediately draw her attention.
The biggest difference is a set of radio buttons that wasn’t there before: hosts can now choose between recurring, one-time, and drop-in Gatherings, and Figma only shows one path. A last-minute change during review went live without design review. It looks messy.
These kinds of failures are quiet as nothing is broken, no alarms sound. It’s what happens in any system complex enough to have moving parts. The team calls the Figma file the “source of truth,” but reality tells another story.
“Design Drift” Is the Gap Between What’s in Figma and What Is Shipped.
Reality shows us that the product design and the actual product have drifted apart.
It’s not a bug or negligence, it’s entropy. It happens to every system that ships faster than it documents.
Together we’re going to close that gap and the first step is admitting that Figma isn’t the source of truth you think it is.
Canonical Is Not the Same as Correct.
In a fast-moving product, the shipped code is the canonical record of what your product is. Users experience the code. The pixels they touch are, by definition, the design.
Code is full of last-minute marketing requests, business decisions, copy changes pushed Friday afternoons, and options added to hit deadlines. Devs are the last leg of the relay race, and they hand their baton—their work—directly to the user.
We need to acknowledge that Figma and the code will never be in sync. They pass each other like ships in the night. It is better to embrace and use each for its own power.
Code is the truth about now. What the product currently is, whether you like it or not.
Figma is the truth about next. You plan, explore, and decide what the product should become.
As Figma silently drifts away from “now”, it loses its authority over “next”. It is hard to plan the next change from a map of a city that has already been rebuilt. We have to reconcile the difference.
This isn’t Figma surrendering to code. It’s about catching up to reality so it can lead again.
Not All Design Drift Is the Same.
There are two major ways that design and code can shift apart.
- Screen drift — a rendered screen has diverged.
- Component drift — the underlying component has changed.
Screen drift is when the content, styling, and layout are made different. It is the design system in use. Forms get more fields, copy edits are made, and extra steps may even be added to user flows. These changes are not inherently bad; they are just changes.
Some of these changes to screens can be subtle. Finding them can be hard, but the fix is easy because you’re not designing anything new. The components already exist in your library; you’re just placing them into the file that fell behind.
Component drift is when the underlying component has changed or is used in an unintended way. Someone created a new variant at the last minute without a designer; props were changed that impact other areas of the product.
Component drift is usually easy to spot when it changes what’s rendered by default — but state-based props (hover, focus, error) can hide in plain sight, since Figma rarely shows every state. A component may only need revisions, or it might need a full rebuild with new variants, new props, sometimes a new name, because the old shape can’t absorb the change.
The key difference between them is that screen drift is a seeing problem, which is easy to detect with AI, while component drift is a judgment problem, which is perfect for your skill and judgment.
Making Exhaustive Visual Diffing Practical with AI
One screen, one difference, easy to spot, right? For a computer, yes. For a human, not so much. As a designer, your eye is trained to notice subtle differences, to feel where things are different, where they may have gone wrong. But even the most keen-eyed designer takes time to notice them across dozens of screens.
This is the perfect place to take advantage of AI. The machines can do this work faster than you can, and review more pages and flows while they’re at it. Use computers for what they are good for: computing!
How to Set Up AI to Find the Differences
Capture both versions of a page or series of pages. You’ll need a vision-capable model to run the evaluation. Then ask the model to list every difference: additions, removals, copy changes, layout, styling, etc.
The Skill in Action
Gatherwell has a lot of security, and the only AI that our designer has access to is Figma Agents. Luckily, her team has a shared skill called “compare-design-to-product”. This skill focuses on four major areas:
- Content/text — different copy, labels, headings, button text, numbers, dates, placeholder text, or text that was added or removed.
- Added/removed elements — whole components, sections, buttons, fields, icons, or UI blocks present in one but missing from the other.
- Major layout changes — reordered sections, restructured arrangement, elements moved to a clearly different position, changed columns/rows, or a different overall composition.
- Visual/style changes — meaningfully different color, typography (family, weight, size), component sizing, imagery, or states, where the change is clearly intentional rather than a rounding difference.
She selects a frame that has the Figma page and the screenshot of the live product page and runs the skill. Shortly, she has a working list of updates to review.
A detected difference does not automatically mean “update Figma”. This is where canonical does not equal correct. This review is neutral; the changes that have to be made are a human call.
If the code is right → update Figma.
If the code is wrong → file a fix.
This judgment is what AI cannot do and shouldn’t do. The tools inform you, and you decide the truth.
“Breaking” Is About Who Gets Affected, Not How Big the Change Looks
Our Gatherwell designer examines the pricing in the flow. The “TicketTier” component has always assumed a single price. Marketing has shipped an Early Bird price, meaning this component now has a regular price, a promotional price, and an expiration date.
When components are used in unexpected ways, we have to figure out what the change means for the design system. What will the impact be on Figma’s design system?
- Silently safe—a styling tweak, a new optional prop with a sensible default. Every consumer of the component absorbs it for free. Just update the component in Figma and move on.
- Mechanically migratable—a rename or restructure that a find-and-replace can handle. Annoying but automatable.
- Per-instance human decision—each use of the component needs a person to decide something—no safe automatic upgrade.
- Must deprecate and coexist — the change is incompatible enough that old and new components must live side by side while consumers migrate.
As much as possible, you’ll want to absorb the changes into the existing component, even when each change means a person needs to review it. Once it is obvious that you can’t, mark the current component for deprecation and make a new component.
Our Gatherwell designer makes her case. Every instance of TicketTier would need a redesign to show two prices instead of one. There’s no default that fits a regular price, a promotional price, and a countdown to when it expires. The team decides to deprecate TicketTier and make a new component for future use. They rename “TicketTier” to “TicketTier (deprecated)” and make a fresh TicketTier component.
Once you’ve made the deprecation call, you enter a migration window where the old and new coexist, and every instance has to move over time. Keeping those two parallel components aligned through that window is a real problem, and a topic for another day.
Making Review a Habit
Reconciliation fails when it’s heroic and occasional. It works when it’s boring and scheduled.
When beginning new work, the first thing all Gatherwell designers do is compare the flow in the file against the live product and make needed adjustments. This policy keeps everything in alignment and is part of the workflow.
When possible, have triggers in your process that queue up design drift reviews. They can be demos, as part of a launch checklist, or as part of a monthly “clean up day”.
The more reviews are integrated into your process, the easier it will be to keep Figma and code in alignment.
Our Gatherwell designer closes her comparison tab. Her file finally matches what people are using and for the first time in nine months, she can trust it enough to plan from it. She opens a fresh task list.
Reconciliation doesn’t mean Figma surrendering to code. It means Figma earning back its authority over what’s next. Drift is inevitable. Staying drifted is a choice.
The State of Open Models in 2026
Hugging Face released its summer 2026 report tracking the rapid maturation of the open-model ecosystem and shifts in developer model adoption.
Original article
Hugging Face reviewed major developments across the open-model ecosystem from January through August, using ecosystem data to highlight how model releases, tooling, and adoption had shifted since its spring report.
On Dwarkesh Patel's Podcast With Ryan Greenblatt
Dwarkesh Patel and Ryan Greenblatt debate whether recursive self-improvement and AI alignment challenges are manageable as systems gain autonomy in R&D tasks.
Decoder
- Recursive Self-Improvement (RSI): The theoretical process by which an AI system improves its own code or architecture, potentially leading to an intelligence explosion.
Original article
Dwarkesh Patel and Ryan Greenblatt's podcast debate focused on recursive self-improvement (RSI) and AI alignment challenges, highlighting their differing views on AI's capabilities and risks. Greenblatt argued for AI's efficiency in certain R&D tasks but acknowledged difficulties in verifying alignment, suggesting a complex training process focused on narrow tasks could lead to misaligned models.

Dario Amodei on regulation and the messaging around AI
Anthropic's Dario Amodei argues that AI regulation can decentralize power by creating objective institutional processes rather than just entrenching big labs.
Decoder
- Frontier model: The most capable AI models currently in existence, typically requiring the largest compute clusters to train.
Original article
Thanks Gavin for an especially thoughtful exchange. I don’t usually spend much time on social media but I wanted to engage here because it really brings out the heart of an important conversation.
First, on regulation, I think that “either concentrate it in the hands of a chosen few companies and politicians via regulation or distribute it widely” is a false choice. I know that there’s a sort of Silicon Valley shorthand where regulation = regulatory capture = concentration of power, but I’ve always found this to be an overly simplified picture of the world. Many people outside this bubble think of regulation as something that constrains corporate power and benefits ordinary people. I don’t necessarily agree with that perspective either, rather I think it’s complicated and really depends on what the “regulation” consists of. But in particular I think that those in the “regulation = regulatory capture = concentration of power” frame often underrate the decentralizing power of objective and fair institutional processes. A crude analogy is that the formal court system can sometimes feel stuffy and elitist, but it does a much better job of defending the rights of vulnerable individuals than the alternative, mob justice. At their best, institutions can vest power in ideas rather than people, and thereby decentralize that power.
This is why Anthropic has always made its policy proposals very carefully. We try very hard to make proposals that disadvantage (slow down) frontier AI companies while advantaging smaller competitors. California’s SB53 (which we supported), and even the much-maligned SB 1047 (which we were ambivalent on), completely exempt any company below a certain amount of revenue or model training costs from being covered at all (it was $500M for SB 53, lower for 1047 but we objected to that). More recently the testing process we’ve advocated for at CAISI and the White House involves more rigorous tests for frontier models than off-frontier models — something that differentially advantages challengers. Similarly, the “Pacing the Frontier” letter envisions (or at least Anthropic’s preferred implementation of it envisions) modulating the pace of the very best models while not constraining those who are catching up. This hurts the business interests of the frontier labs and helps challengers, including open-weights!
Overall my view is that AI is structurally a technology that tends to concentrate power, for reasons that have nothing to do with regulation (more to do with the extreme implications of the scaling laws). Open-weights do help some with this but are nowhere near a sufficient solution because they simply shift the concentration somewhat to those with the most compute and chips (which are roughly the frontier labs plus maybe hardware providers). By contrast I think the right “rules of the road” can simultaneously (a) address AI’s cyber/bio/alignment risks, (b) institutionally constrain the power of the frontier AI companies, and (c) leave room for open-weights models while also addressing the specific risks that they bring.
BTW I do not think that the events of the last few months have “failed to result in [my] preferred regulatory path”. The approach that the Trump administration is reported to be taking — pre-deployment testing for frontier models, and also testing of open-weights models when they get closer to the frontier — is one that I am very supportive of, though of course I have to see the details to be sure. I am also supportive of Demis Hassabis’ ideas around a FINRA-like entity. This contrasts with six months ago when most of the industry was still pushing for preemption of all state regulation and no apparent federal approach either.
Second, on the messaging around AI. I do not agree that my messaging has been disproportionately negative. In fact it has been about equally balanced between risks and benefits: I’ve written one major essay about each, and even in interviews where I discuss the risks, I make sure to frequently mention the incredible benefits as well as proposing possible solutions to the risks (short clips from my interviews that end up on social media tend to be disproportionately negative, as that gets clicks). In fact, I wrote Machines of Loving Grace because I didn’t feel the AI industry was painting an inspiring enough picture of how the technology could radically transform the world for the better. The bulk of the essay is devoted to refuting skepticism of AI’s potential in health and biology, and showing why I think it will actually be possible to cure most human disease in ~5-10 years, as crazy as it may sound to ordinary people and frankly to biologists as well (I used to be one!). And, if you read my most recent essay (Policy on the AI Exponential), I discuss concrete proposals for how to streamline the FDA process to make sure the deluge of AI-accelerated drugs isn’t slowed down by the regulatory process. I feel the urgency here: I lost my father to Hepatitis C only a few years before the development of direct-acting antivirals (sofosbuvir), which cure 95% of patients and probably would have cured him.
I do agree that the public has a negative view of AI (and that this is a big problem), but I don’t think it is primarily caused by me or any other AI leader warning about AI’s risks. I think it is fundamentally a crisis of trust. I think that ordinary people don’t trust companies, governments, or the tech industry and always suspect that we are cooking up some new way to screw them over. The causes of this go back decades and AI is just the latest iteration of it. I don’t think that a glitzy marketing campaign with a positive spin (which some have advocated that Anthropic do) is the way to win back that trust — at this point, saying that AI will cure cancer is more a cliche than it is inspiring, and most people think it is deceptive. The thing that will work is actually curing cancer. I think by far the most accurate criticism of AI companies including Anthropic is that we haven’t yet delivered on our big promises to benefit the world. That is totally on us, and I think it’s the criticism you should be making, instead of all this stuff about messaging and marketing.
We are however doing our best to fix this: Anthropic is ramping up its efforts very quickly in biology and medicine, and we hope to have incredible results in the coming years and some early glimmers in the coming months. When we’ve actually accomplished something real, the whole world will hear about it, as loudly as possible, you have my word on that. But until then I don’t want to make empty promises, and in the meantime I feel compelled to speak honestly about the very real risks of AI and how to address them. Honesty is the right thing on the merits, and in terms of public credibility and trust it is no worse than, and may in fact be better than, an approach that ignores or distracts from risks which people instinctively understand are real.
OpenAI sheds senior execs in pre-IPO refresh
OpenAI is clearing out its senior leadership team in a major corporate refresh ahead of an expected initial public offering.
Original article
OpenAI has seen significant leadership changes, including the departure of top executives like the chief revenue officer, COO, and head of ethics, ahead of an anticipated IPO.
Stripe Clinches Over $7 Billion Deal to Buy AI Firm OpenRouter
Stripe is reportedly finalizing a deal to acquire AI model router OpenRouter for more than $7 billion.
Decoder
- Model Router: A software abstraction layer that routes API requests to different AI models based on factors like cost, speed, or accuracy, allowing developers to avoid vendor lock-in.
Original article
Stripe has finalized an agreement to acquire OpenRouter, a startup that helps companies switch between AI models. The sale price of more than $7 billion could change and the discussions are not public. OpenRouter's rise highlights the industry's growing scrutiny on AI costs. The acquisition will give Stripe a stronger footing in the fast-growing AI sector.
Let There Be Germicidal Light: This $500 Fixture Could Stop the Next Pandemic, from Complex Systems
Far-UVC 222 light fixtures, costing roughly $500, can neutralize airborne pathogens in shared spaces, potentially preventing future respiratory pandemics.
Decoder
- Far-UVC 222: A specific band of ultraviolet light that is highly effective at killing microbes but is absorbed by the outer layer of dead human skin cells, making it safe for use in occupied rooms.
Original article
Far-UVC 222 has been shown to efficiently inactivate airborne pathogens in a room-sized chamber. While the technology is unlikely to prevent the average common cold, mostly spread through close, extended contact, it could be helpful in blunting a future respiratory pandemic where more of the spread happens at a range through shared air. It is functionally equivalent to an extremely strong air purifier. The biggest bottleneck to the technology's adoption currently is awareness.

The world's largest electric plane takes flight
Heart Aerospace’s 25,000-pound X1 electric plane completed its maiden flight, testing a hybrid-electric design intended for commercial use by 2031.
Original article
The world’s largest, fully battery-powered jet officially completed its maiden flight. The successful test run marks a noteworthy step forward for long-awaited electric aircraft and battery technology broadly, but don’t expect to book a fully battery-powered flight anytime soon.
Manufactured by Los Angeles-based Heart Aerospace, the plane is called the X1. It has a 106-foot wingspan, measures 76 feet from nose to tail, and weighs more than 25,000 pounds, roughly the weight of an empty school bus. The 30-seat plane took off earlier this week from a regional airport in upstate New York, and flew for 27 minutes on battery power alone, reaching an altitude of 1,100 feet. It didn’t carry passengers, just a single pilot.
This week’s flight was an early test run for Heart’s broader commercial ambition: a hybrid-electric plane called the ES-30, which the company ambitiously hopes to bring into service by 2031. That model has already garnered interest from major airlines including United, Air Canada, and JSX, drawn in by the promise of lower maintenance costs and insulation from volatile jet fuel prices.
“With the first flight of X1, Heart Aerospace has demonstrated electric flight at the scale of a commercial airliner,” Heart Founder and CEO Anders Forslund said in a statement.
Heart Aerospace was founded in Gothenburg, Sweden, but officially relocated to Los Angeles in April 2025 as part of its effort to get its regional hybrid-electric plane off the ground. It’s one of several aviation companies capitalizing on rapid innovation in battery tech in recent years to try to reshape air travel, or a small, regional segment of it at least. The potential benefits are two-fold. On one hand, battery-powered planes, especially those drawing electricity from renewable sources, offer a cleaner alternative to environmentally harmful jet fuel. Aviation broadly accounts for an estimated 2.5 percent of global carbon dioxide emissions. Worse still, planes produce other harmful heat-trapping emissions like nitrogen oxides. The aviation industry set a goal of becoming carbon neutral by 2050, but even with innovations in sustainability and cleaner fuel, that target seems almost certain to fail.
Emerging electric aviation could make a dent in those emissions, but it certainly won’t transform the industry in the near future. The bigger sell for airlines comes from promised cost savings. Anyone who’s flown in the past six months likely knows that the cost of jet fuel is heavily subject to world events. Jet fuel prices averaged $3.50 per gallon a week prior to the test flight. That’s up 63 percent from last year. Beyond just fuel, though, electric motors also have fewer moving parts, which, in theory at least, means they should require less costly maintenance and repair. Automakers have made similar arguments when advocating for electric vehicles.
Heart claims that a combination of less fuel and maintenance combined should make their eventual ES-30 40 percent cheaper to operate than conventional regional aircraft of similar sizes. Going further, the company claims that all electric X1 test flights used just $5 of electricity. That sounds impressive at first, but it’s worth noting what that eye-grabbing figure leaves out. That single-figure dollar only measures the raw energy costs and not other operating costs like crew, airport fees, maintenance fees, long-term battery degradation, and other expenses. How much airlines actually save if they switch the hybrid eclectic plane, and whether any of those savings get passed on to travelers, remains somewhat unclear.
“Electric commercial aircraft have the potential to fundamentally reshape airline economics and, ultimately, lower the cost of air travel for passengers,” Forslund added.
Fully electric air travel lack range
Heart isn’t the only company trying to electrify the sky. Rolls-Royce has built a small, fully electric race plane that can reach a zippy top speed of 387 miles per hour. Harbour Air, meanwhile, has developed a fully electric, six seater sea plane. Much-hyped vertical take-off and landing (VTOL) companies like Joby Aviation and Archer Aviation are also bringing small, helicopter-like electric planes to market, aiming to ferry travelers from city centers to airports over shorter distances.
That’s all well and good, but extending electric aircraft range to the point where it can reliably replace a regional commercial carrier remains difficult. Several companies, such as Washington state-based Eviation Aircraft, are competing in the space, but they are ultimately limited by the inherent trade-offs of battery tech. Basically, the larger the plane gets, the larger the battery it needs to fly. But batteries are consistently heavy, and eventually they get so large that the plane simply can’t carry them alongside passengers and cargo. Worse still, batteries are dead weight: unlike conventional gas-powered planes, which get lighter as they burn through jet fuel during a flight, electric planes maintain essentially the exact same weight from takeoff to landing.
That’s where Heart’s hybrid approach kicks in. When running entirely on battery power (as the X1 did this week), the plane has a top range of around 125 miles. That’s simply not enough to reliably replace most regional air travel, while maintaining required reserves for emergencies. However, with the addition of a combustion engine range-extender, that maximum range extends closer to 500 miles. That’s more than enough to cover short regional hops, like routes along the heavily trafficked Northeast Corridor.
In other words, as noteworthy as it is to see an electric plane of the X1’s size successfully take flight, the true next step in terms of what travelers might actually feasibly board is hybrid-electric. For now, at least. Battery technology continues to improve, giving optimists hope that a hybrid approach (much like with cars before it) could buy time and provide a smooth transition while technology catches up to make fully electric solutions viable.
AI Just Had Another Math Breakthrough—With Help From a High-School Dropout
An Anthropic employee without a formal math background used Claude to uncover a novel mathematical finding related to the Riemann hypothesis.
Decoder
- Riemann hypothesis: A famous unsolved mathematical problem regarding the distribution of prime numbers.
Original article
Anthropic employee Jarred Sumner used the Claude app on his phone to try to solve the infamous Riemann hypothesis. The model didn't succeed, but it made a related finding that one Stanford number theorist has called the most impressive result that AI has produced in math so far. Sumner's formal mathematical education ended after just one semester of high-school geometry, and he identifies as very much not a mathematician. Most of the prompting he gave to the model was variations of 'keep going' and 'believe in yourself'.
Z.ai Delays GLM-5.3 Weights Two Weeks After Cyber Score Beats Mythos 5
Z.ai released its GLM-5.3 model but gated the weights and sensitive cybersecurity features after the model outperformed Mythos 5.
Decoder
- Model weights: The numerical parameters learned by a neural network during training that define how it processes input data.
Original article
Z.ai released GLM-5.3 on Friday while holding back the model's downloadable weights and gating its most sensitive cybersecurity functions.

Code is the Byproduct
Engineering expertise is better served by using LLMs to build deep comprehension of a system rather than using them as simple code generators.
Decoder
- Jacobian Conjecture: A major problem in algebraic geometry, recently debated regarding a potential counterexample.
- DRY (Don't Repeat Yourself): A software development principle aimed at reducing the repetition of software patterns by replacing it with abstractions or using data normalization.
Original article
Recently, the Jacobian Conjecture was disproven by a counterexample discovered by an LLM. Shortly thereafter, a ChatGPT session from mathematician Terence Tao made the rounds online. In his chat, Tao uses ChatGPT to help him wrap his head around the implications of the result.
If you use LLMs in your day-to-day, it is worth taking a look at his chat, even if (or especially if) you have no interest in higher level mathematics.
The "Understanding Bubble"
Most of us interact with LLMs within our own domain bubble. We spot inaccuracies where we have deep experience and validate their output when necessary. On the other hand, we get burned around the edges of our understanding when we know enough to understand the answer, but not enough to confidently refute an LLM when it is wrong.
Reading Tao's chat is something else entirely. We rarely get to see a world-class expert interact with an LLM in a domain obscure to most humans.
Terence Tao immediately begins communicating with ChatGPT about high level concepts and the LLM responds in kind. If this was chat was posted 5 years ago, we would assume it is a chat between two eminent mathematicians, not a human and a stochastic parrot.
It is remarkable that the jacobian is constant, that is an exceptional amount of cancellation. Does this polynomial map have any symmetry or other structure that makes this cancelation less miraculous?
Because the math itself is beyond most readers, what stands out is the shape of the interaction. Tao starts his inquiry by noting a single, precise detail that intrigues him. He then drills into the responses, expanding or narrowing his focus based on his own train of thought. This is an expert engaging with an LLM on his own terms.
Narrow Focus, Great Depth
What happens when a normal user tries to understand the Jacobian Conjecture counterexample by chatting with an LLM? Our questions are broad, our terms are vague and and the LLM mirrors our surface-level phrasing and understanding.
In other words, LLM have been talking down to us.
We know a single word can reframe what a prompt produces, which has been used as a sign of "LLM randomness". But on a deeper level, recognize that an LLM extracts every nanogram of understanding from a prompt that it can. For example, as a programmer if I say "make this code clean" the LLM will do one thing, but saying "revise according to DRY principles" gives the LLM a much clearer domain of understanding from which to make changes.
Your words do more than convey a request. They anchor the depth of an LLM's data retrieval before it even begins to assemble a response.
Short Prompts, Specific Details
Note what Tao is not doing. He is not building a rich contextual background for the LLM to unpack. He does not list his credentials or say, "you are a mathematical genius, make no mistakes." Instead, he is terse and precise. He asks narrow questions and gets narrow responses. He does not say "Generate a 20 page report that analyzes and describes this finding." That produces a wall of text that looks impressive but conveys little.
Keep your requests narrow and specific. Let the output compound through repeated inquiries. Engage with the goal of improving your personal understanding.
The Goal is Understanding
Many users treat LLMs as asset factories write code, generate images, or draft emails. Because we focus on the final asset, we skip the process of building deep comprehension.
Much of the time, a "roughly correct" output is good enough for our needs. But for a request that needs specificity, establishing a shared understanding through the LLM is a necessary waypoint.
How do you construct shared understanding? By narrowing the LLM's focus through domain-specific wording and keeping requests specific and cumulative.
This is how ChatGPT is able to respond to Tao's mathematical concerns without needing heaps of extraneous detail. Tao pins ChatGPT to a "deep mathematics" headspace through terminology and the specificity of his question.
If you don't understand something, set the stage for the LLM and it will capably fill in the missing 20%.
Curiosity Beats Capability
Curiosity is the new superpower, not raw capability. LLMs are capable workers, but they need precision to return accurate results. Without domain understanding, we fall back to broad requests and fuzzy answers. LLMs mirror our understanding.
Product or Byproduct?
As a software engineer, I have shifted my focus from asking for code to asking for clarity. Code is written only after understanding is constructed. Here are some ways I use LLMs in my day to day:
- When planning a feature:
- Can this feature reuse any existing code? Is there an existing pattern the design of this feature should follow? Describe the architecture of this feature. Where are the bottlenecks? Is this an extensible approach if I want to add Feature B down the road? Is there a way to implement this without affecting this other part of the codebase?
- When writing/generating code:
- Does this consider edge cases along these lines? Are there any performance concerns? Are there security issues? How are permissions managed? Is there a way to simplify this approach? Can this be moved to a shared function? Are there any downstream implications of this change? Ignore this concern for now and ensure this other part is handled first. How can this be revised to minimally solve the request?
- While reading code/doing code review:
- What is this function doing? How many callers does this function have? Does this consider the following edge case? Describe/make a diagram for the architecture of this feature. What is the user flow on this page? How are errors propagated? Are there any gaps here? Is there documentation, inline comments or tests around this, and do they match the functional logic?
- When writing docs, PR descriptions, summaries, etc.:
- What are the product implications of these changes for users? How does this affect downstream usage of this function? Update the architecture diagram to match these changes. Which engineers work on this code and should need to be informed about these changes?
To me, this is the most valuable output of an LLM. My understanding can improve in broad strokes, at different levels of abstraction, along multiple paths of concern from infrastructure to user experience. Because of LLMs, I can know more about our product, understand recent changes, discover broad problems or make cross-cutting improvements. I can learn about architectural weaknesses or latent bugs. I can improve documentation, help other engineers on the team and spread understanding across the company.
At the end of the day, I am paid to produce code, but code remains the byproduct of understanding.

Scratch a simple data model, find a complex one
Simple data models often fail in production because real-world domains like Biblical text include unpredictable verse ordering, fragmentation, and missing data.
Deep dive
- Biblical data contradicts linear hierarchies.
- Verse numbers are not unique; sub-verse splits (e.g., 25a, 25b) require flexible structures.
- Alternative translations use differing verse orderings for the same text.
- Some books contain missing verses or alternative chapter numbering.
- 'High-fidelity' modeling increases complexity exponentially with diminishing utility.
- The suggested strategy is to implement the bare minimum model that satisfies the product's requirements.
Decoder
- High-fidelity: A data model that precisely represents all nuances of the source material, often at the cost of significantly higher complexity.
Original article
I seem to have a knack for discovering corner cases – or in many situations being a corner case.
One category of this is where I find myself using a data model which appears simple to start with – and then the real world interferes. I’ve always found this sort of thing interesting, and recently I’ve come across a pretty good example which I thought I’d share. This also gives an example of some of the thought processes I use when scoping how I model data.
I’m trying to model the text of the Bible, for reasons I won’t go into. BibleGateway is my “source of truth” here, and all the screenshots in this post are from that site (with appropriate links).
Initial assumptions, scoping and simplifications
Note: this section is not all true. It’s how I approached the data model to start with. Later sections will show where it breaks down.
There are multiple translations of the Bible. I’m scoping my model to only English translations. I’m not interested in “first edition” vs “second edition” etc, but I do want to be able to differentiate between “New International Version” and “New International Version – UK” etc.
Each translation is made up of several books (Genesis to Revelation). While we could split this into “Old Testament” and “New Testament” (and some other categories, potentially) I don’t need that categorisation, so it won’t be part of the model. Different translations consist of different books, as some translations include the Apocrypha and others don’t.
Different translations may refer to the same book with different titles. For exmaple, “Song of Songs” is also known as “Canticle of Canticles” or “the Song of Solomon”; likewise “the Book of Wisdom” is also known as “the Wisdom of Solomon” and “Sirach” is also known as “Ecclesiasticus” (and some other titles, apparently). I don’t particularly need to know which title is used in each translation, but I do need a canonical representation. (If a user says they want to see a passage in “Sirach” or “Ecclesiasticus” I want to give the same results in either case, regardless of what the translation calls it.)
Each book is split into chapters, and each chapter is split into verses. Each book starts with chapter 1 and proceeds in the obvious way; each chapter starts with verse 1 and proceeds in the obvious way. Different translations may have number of verses for the same chapter, but have the same number of chapters for the same book (modulo books which are augmented by the Apocrypha). Some verses have optional splits (e.g. 25a, 25b, 25c) which may not be consistent between translations. For now, I’ll deem the splits to be out of scope for the data model (at least to start with).
The text within each verse may have some formatting details such as indentation. Sometimes there are headings within chapters. Some translations may come with cross references and commentary notes. All of this is out of scope of at least this blog post.
In other words, I might expect a simple C# representation to look something like this:
// Note: BookId is an enum or equivalent, so that "Genesis" uses the same BookId in all translations.

public record Bible(string Id, string Description, ImmutableArray<Book> Books);
// Chapters[0] = chapter 1 etc.
public record Book(BookId Id, ImmutableArray<Chapter> Chapters);
// Verses[0] = verse 1 etc.
public record Chapter(ImmutableArray<string> Verses);
The complex reality
Of course, this post wouldn’t exist if the data model were really that straightforward. The very top-level aspects – a Bible with an ID, a description, and a sequence of books – is fine. But when we get to the “a book is a sequence of chapters” and “a chapter is a sequence of verses” aspects, it turns out life is more complicated.
It seems unlikely that I’ve discovered all the ways in which the simple data model is broken, but here are the ones I’ve encountered so far.
Verse ranges
Not all Bible translations attempt to translate each verse directly, in the original textual order. For example, The Message translates “chunks” of text at a time. Here’s the start of John’s Gospel in The Message:
As you can see, each chunk of text is associated with a range of verses (1-2, 3-5, 6-8) rather than a single verse.
That already completely messes up our data model. We can’t just use a sequence of verses in the chapter with each verse being represented by a single string. We need a more complex representation with a dedicated type for “part of a chapter”. It could look something like this:
public record Bible(string Id, string Description, ImmutableArray<Book> Books);
public record Book(BookId Id, ImmutableArray<Chapter> Chapters);
public record Chapter(ImmutableArray<ChapterSection> Sections);
public record ChapterSection(string Text, int StartVerse, int EndVerse);
Note that at this point, if a user performs a search based on a book, chapter and range of verses, they might see text that doesn’t really belong in that range.
For example, searching for “Genesis 1:2-7” in The Message has to either show verses 1 and 8, or miss out verses 2, 6 and 7, because we don’t have enough information about which part of each chunk comes from each verse.
Still, at least we know the verses are in order, right?
Out-of-order verses
Sometimes, the order of verses differs between translations, even if the verse numbering doesn’t. Where two translations differ in this respect, naturally at least one of them has to have verses which don’t follow the natural order.
This may happen all over the Bible, but at least one example is in Isaiah chapter 38. The New International Version (NIV) has all the verses in the natural order, with verses 21 and 22 coming after verse 20:
… whereas the Good News translation has them inserted between verses 6 and 7:
We can still keep the same data model as we have before, but we need to know that verses can be out of order when we perform a search. We also have decisions to make about what to return in the searches.
Assuming that we’re searching in the Good News Bible, what should a search for “Isaiah 38:4-8” return? Should it include verses 21 and 22 because they occur textually between verses 4 and 8, or should it only return verses 4, 5, 6, 7 and 8?
What should a search for “Isaiah 38:4-21” return? Looking at the textual order of the verses, it might make sense to only return verses 4, 5, 6 and 21 – but that would be odd in any other understanding of the range “4 to 21”.
(The answer my own code has here is that “4-8” really means “only chunks of text which include anything in the range 4-8” so it will omit 21 and 22; if you search for the whole of Isaiah 38 though, it will show all the verses in the textual order.)
Subverse ordering
Okay, so we not every chunk of text is a single verse, and the verses might appear in a weird order, but at least any given verse number only appears once, right? Not so much.
Earlier I deemed how verses were split (25a, 25b, 25c etc) to be out of scope. That’s fine almost everywhere, but Sirach chapter 28, at least in the New Revised Standard Version (Anglicised) (referred to from here on as NRSVA) ends with some very odd verse splits. The verse ordering is 23, 24a, 25b, 24b, 25a, 26.
At that point we either have to change our data model to include the splits, or we have to accept that there’ll be duplicate verse numbers (23, 24, 25, 24, 25, 26). If we want splits, we could change the model to something like this:
public record Bible(string Id, string Description, ImmutableArray<Book> Books);
public record Chapter(ImmutableArray<ChapterSection> Sections);
public record ChapterSection(string Text, VerseNumber StartVerse, VerseNumber EndVerse);
public record VerseNumber(int Number, char? Subverse);
(It probably makes sense for VerseNumber to be a record struct rather than the implicit record class, but that’s more of an implementation detail.)
Missing verses
Some translations miss out certain verses, or parts of verses. Just missing out some text that appears in some other manuscripts doesn’t affect our data model, but missing a verse entirely is at least somewhat surprising. For example, take the start of John 5 in the NRSVA:
Verse 4 is missing, although there’s a footnote, which reads:
Other ancient authorities add, wholly or in part, waiting for the stirring of the water; 4 for an angel of the Lord went down at certain seasons into the pool, and stirred up the water; whoever stepped in first after the stirring of the water was made well from whatever disease that person had.
This doesn’t require any changes to the data model, but it’s important to be aware of when validating.
Alternative verse numberings
I don’t know whether there are multiple instances of this, but 2 Esdras chapter 7 has a verse range (36-105) which is included in some versions and omitted in others – and unlike the alternative ordering earlier on where the a verse number was at least consistent in what text was being translated, in this case the verse numbers change too. So “verse 36” could refer to text translated as “The pit of torment shall appear, and opposite it shall be the place of rest; and the furnace of hell shall be disclosed, and opposite it the paradise of delight” or “I answered and said, ‘How then do we find that first Abraham prayed for the people of Sodom, and Moses for our ancestors who sinned in the desert,”.
Bible Gateway indicates the alternative verse numberings in italics:
How do we represent this in the data model? What does a search for “2 Esdras 7:30-40” return? Most importantly, how much effort are we prepared to put into making our model high fidelity?
Personally, I’ve taken the approach of “do the simplest thing that doesn’t crash” – which ends up meaning that all the “extra” verses are included, and the verse numbering is based on that. An alternative would be to exclude all the “extra” verses, and still have a single consistent verse numbering scheme. Coming up with a data model which actually represents both verse numbering schemes would lead to a lot of complexity, and I’d only do that if I really, really needed it.
Just one chapter
What should a search for “Obadiah 4” return? For most books of the Bible, it would return all of chapter 4, with multiple verses.
However, there isn’t a chapter 4 of Obadiah – there’s only a single chapter. So “Obadiah 4” should, in a functionally-complete system, almost certainly return just verse 4 instead. Should “Obadiah 1:4” be acceptable as well? I guess that’s up to the product requirements.
This isn’t really a data modelling question – but it does affect how the model is used, implicitly converting any query which looks like it’s “book and chapter” into “book, chapter 1, verse” when there’s only a single chapter.
This affects nine books of the Bible, including apocrypha, as far as I can see. Most are straightforward, but the Letter of Jeremiah isn’t. It only has a single chapter – but that’s chapter 6. It’s not quite as odd as it sounds, because it’s effectively chapter 6 of the book of Baruch… but separated out as its own book. So in this case, “Letter of Jeremiah 5” is equivalent to “Letter of Jeremiah 6:5”. Hmm.
Psalm 151
The book of Psalms has 150 chapters. Unless your Bible contains the Apocrypha, in which case Psalm 151 exists as well. Should this be regarded as a separate book, or just an extra chapter in the existing book? It could be modelled either way, and is a little like the Letter of Jeremiah mentioned above. Either way, it’s something that has to be thought about both in terms of data modelling and how the data is then handled.
Mid-verse chapter beginnings
Most of the time, a chapter starts with a new sentence, and that’s the start of the first verse. There are some cases where it appears that’s not true, however. For example, 2 Samuel 12 in NRSVA starts “But the thing that David had done displeased the Lord, and the Lord sent Nathan to David” – but the way it’s presented suggests that chapter 12 and verse 1 only start at “and the Lord sent Nathan to David.” Which chapter does “But the thing that David had done displeased the Lord” belong to? Is it chapter 11 verse 27, or is it text that isn’t in a chapter or verse at all? How should that be represented in our data model?
As for alternative verse numberings, my own answer is “just make it simple”. I’ve effectively moved the start of chapter 12 verse 1 to the start of the text (“But the thing”). I strongly suspect that if someone searches for “2 Samuel 12:1-4” they don’t really want it to start mid-sentence.
Alternative endings
The Gospel of Mark has two endings: the “short” ending and the “long” ending.
The short ending version of chapter 16 has 8 verses, and the long ending version has 20 verses. It would be reasonably simple to have some sort of “optional” flag in the data model to represent that. However, in at least some translations, verse 8 in the short ending has additional text. Here’s how it looks for the NRSVA translation of Mark 16:
(The long ending continues further.)
The simplest representation is to include everything from both versions, with no differentiation – so you would see the longer version of verse 8 and verses 9-20. I believe that’s exactly what my current implementation does, because again, that’s good enough. It feels to me like any “high-fidelity” representation either has to get the user to indicate whether they want to see the short version or the long version, or display both versions as Bible Gateway does, with suitable annotations.
I strongly suspect there are other books that have this sort of optionality, too – although whether they have the “the contents of verse X depends on whether you’re including chunk Y or not” is a different matter.
And then there’s Greek Esther…
Just when you think we’re at the end of oddities, Greek Esther comes along. While the Hebrew book of Esther appears in most translations, the book of Greek Esther is part of the Apocrypha. It’s the same book, but with some additional chapters. While Esther has 10 chapters, Greek Esther has 16 chapters.
As far as I can tell, Greek Esther is almost entirely additive with respect to Esther – the differences are only in the additional text in chapters 11-16. The exceptions are chapter 5, where verses 1 and 2 from the Hebrew version are omitted; chapter 9, where verse 30 is omitted; chapter 10 which has more verses in Greek.
But the extra chapters don’t come at the end. Instead, the chapters are interspersed through the “normal” chapters. They’re not just done as “chapters 1-5, then chapter 11” or similar though… some additional chapters are inserted within the original chapters, and sometimes even split up to be inserted in multiple places. Chapter 11 takes the biscuit for this: Greek Esther starts with chapter 11 verse 2, and the very final verse is chapter 11 verse 1.
It looks like in some translations the chapters are given letters instead of numbers (and it’s not a 1:1 correspondence between them, either). I’m going to ignore that part, at least.
Looking at the NRSVA translation, we have:
- Chapter 11, verses 2-12 (end)
- Chapter 12, verses 1-6 (end)
- Chapter 1, verses 1-22 (end)
- Chapter 2, verses 1-23 (end)
- Chapter 3, verses 1-13
- Chapter 13, verses 1-7
- Chapter 3, verses 14-15 (end)
- Chapter 4, verses 1-17 (end)
- Chapter 13, verses 8-18 (end)
- Chapter 14, verses 1-19 (end)
- Chapter 15, verses 1-16 (end)
- Chapter 5, verses 3-14 (end)
- Chapter 6, verses 1-14 (end)
- Chapter 7, verses 1-10 (end)
- Chapter 8, verses 1-12
- Chapter 16, verses 1-24
- Chapter 8, verses 13-17 (end)
- Chapter 9, verses 1-29, 31-32 (end)
- Chapter 10, verses 1-13 (end) (verses 4-13 are only in Greek Esther)
- Chapter 11, verse 1
This quashes two assumptions:
- Chapters are in order
- Any given chapter only appears once
We can represent this fairly easily in terms of having all of the right data, by giving out Chapter record a Number property. Combined with the other augmentations, we end up with:
public record Bible(string Id, string Description, ImmutableArray<Book> Books);
public record Book(BookId Id, ImmutableArray<Chapter> Chapters);
public record Chapter(int Number, ImmutableArray<ChapterSection> Sections);
public record ChapterSection(string Text, VerseNumber StartVerse, VerseNumber EndVerse);
public record VerseNumber(int Number, char? Subverse);
Then everything which uses the data needs to know that it can’t assume any correspondence between the index of a chapter within Book.Chapters and the chapter number.
Conclusion
All the details above are probably irrelevant to you, unless you happen to be creating a data model for the Bible yourself. But I thought it worth going into some of the concrete details to show the type of issues I run into in almost every situation where the real world meets a theoretical data model. (The election web site is another example of this. Date/time handling runs into it quite a bit too.)
I wish I had really good suggestions for what to do when you run into this sort of issue, but the best I can suggest is to stop and ask yourself what you really need. I find the answer usually falls into one of three buckets:
- I can live without high fidelity, so it’s not worth making the code more complex.
- I need the details, so I have to suck it up and live with the complexity.
- A half-way house: introduce a bit more complexity into the model to get to an acceptable state, which may still be a bit odd, but which I can live with – and doesn’t involve making the data model horrendous.
If you have any favourite oddities along these lines, please leave a comment – it’s always good to collect weird and wonderful anecdotes.
The Agent OS for Creative Work (Website)
Omniwork launches an 'Agent OS' to manage creative workflows by coordinating specialized AI agents trained on human expert data.
Original article
The Agent OS for Creative Work
Powered by Expert Agents built on top-tier human expertise
Highlighted Product Features
Expert Agents, Ready to Use
Built from top-tier creator expertise — or from your own workflows.
Orchestrated from Goal to Delivery
Set a creative goal. Omni coordinates the right Agents to plan, execute, revise, and deliver.
Memory That Grows with Your Work
Your taste, context, standards, and project history stay with you across every Agent.
Memory
- Style
- Lore
- Workflow
- Inspiration
I prefer sparse, minimalist prose — no purple language. My visual work leans dark and desaturated, inspired by brutalism. Pacing should feel slow-burn, not action-driven. Dialogue should sound naturalistic — interrupted, unresolved, never too clean.
Expert Agent Case Studies
See how creators are transforming their workflows with Omniwork
Film & TV: Premium Short Drama & AI Film Production
University-enterprise collaboration with Shanghai Theatre Academy to create premium Experts for anime short dramas and AI film production. Supported by Yang Lei (director of "The Peaceful Year" and "The Three-Body Problem") and author Liu Cixin.
Game Development: Coding-based Mini Game Development
For independent developers, creative studios, and lightweight game creators, Expert Teams collaborate on the full chain from planning to code implementation. Without Omniwork, compressing mini game development that originally requires a 3-5 person professional team into 1 person + OmniWork for delivery.
Music Produce: Professional Music Creation & Music Therapy
Shanghai Conservatory-backed professional music creation Expert series with high academic authority and market differentiation. Co-creation with Shanghai Conservatory of Music's AI Music Therapy Key Laboratory, transforming academic-level music research into callable Expert Skills.
Gaming: AI-Native Interactive Video Games
Exploring AI-native interactive narrative game formats, with Agent as the core gameplay engine for dynamic content generation and character interaction. Different from traditional game storyline branches, every player input dynamically affects the story direction and character responses, with Expert Teams collaborating on narrative generation, character driving, and scene rendering.
Operation: Social Media Operation & Marketing
Transform your social media presence with our comprehensive Agent Group designed for end-to-end social media operations. This intelligent team of specialized agents works collaboratively to analyze, operate, and grow your social accounts across platforms.
Cost-effective plans for creative work
Starter
Free
For individuals exploring AI-powered work
- 100+ AI agents
- 5 Deep tasks/month
- Basic integrations
- Community support
Pro
$69/mo
For professionals who want to scale, ~90 Deep tasks/month
- Unlimited AI agents
- Auto workflow
- 30+ Deep tasks / month
- All integrations
- Custom workflows
- Team collaboration
Ultimate
$1999/yr
For organizations with advanced needs
- Everything in Pro
- Custom AI training
- SSO & advanced security
- Dedicated success manager
- Priority support
Ready to redefine how you work?
Soon, turn your experience into an Expert Agent, share it globally, and earn revenue.
So You Want to Build an AI Star?
Photorealistic AI avatars are becoming increasingly accessible, disrupting the market for human influencers and performers.
Original article
Several companies are attempting to build the synthetic superstars of tomorrow. AI imaging tools have enabled anyone with a modest budget and a sliver of vision to build their own photorealistic avatars. The availability of virtual talent has unsettled many communities of human performers. While AI influencers likely won't replace human influencers fully, they'll likely become more prevalent as these tools become more and more reliable.
The 13 Questions CEOs Ask After an Incident (And What IT Leaders Must Be Ready to Answer)
PagerDuty's 2026 report outlines the 13 specific questions IT leaders must be prepared to answer when an outage triggers executive scrutiny.
Original article
PagerDuty's 2026 report identifies 13 questions executives ask after major incidents across immediate impact, root cause, and strategic phases.

Fairly Ranking the Most Brilliant Birds
A transparent mathematical ranking system for bird brilliance highlights the orange-breasted bunting while illustrating the subjective nature of objective metrics.
Decoder
- Chroma: A measure of the vividness or saturation of a color, independent of its lightness.
- Power Mean: A generalized form of the arithmetic mean that allows for tuning how 'min-like' or 'max-like' the aggregation is through a power parameter.
- Maximal Marginal Relevance (MMR): A ranking method that balances a candidate's score against its similarity to items already included in the set to encourage diversity.
Original article
A transparent ranking of the world's most brilliant birds combines chroma, colour variety, sample confidence and diversity, placing the orange-breasted bunting first. The bigger idea is that ranking systems are fairest when every factor is understandable, defensible and tied to a reasonable human judgement.
WhatsApp working on customizable emoji reaction sets on iOS
WhatsApp is testing a feature allowing users to customize their default emoji reaction sets on iOS and Android.
Decoder
- WhatsApp Plus: An unofficial, modified version of the WhatsApp application that often includes features not found in the official release.
Original article
WhatsApp is testing a feature that would let users customize the six default emoji reactions shown when reacting to messages, replacing them with emojis of their choice and restoring the defaults at any time. The feature is not yet available to beta testers but appears to be in development for both iOS and Android, with a possible tie-in to WhatsApp Plus.
Samsung may be going in for the full iOS-esque Liquid Glass look in OneUI 9.5
Samsung's One UI 9.5 may adopt a 'Liquid Glass' aesthetic, emphasizing transparency, depth, and glass-like visual effects.
Decoder
- One UI: The custom user interface software developed by Samsung for its Android devices.
Original article
Leaks suggest Samsung is exploring a glass-inspired redesign for One UI 9.5, featuring shinier edges, transparency effects, background blurring, greater visual depth, and possibly a new App Lock feature. While the update remains unconfirmed and likely won't arrive until 2027, it indicates Samsung may be pursuing a more visually expressive interface rather than simply refining its current design.
Rethinking design leadership with swarms and flocks
Effective design leadership relies on enabling autonomous swarms rather than centralized command, prioritizing clear principles over rigid control.
Original article
High-performing teams work best when they combine local autonomy with a small set of shared rules, allowing people to adapt quickly without losing alignment or direction. Leadership should focus less on controlling decisions and more on enabling communication, rotating responsibility, protecting team health, and reinforcing a few core principles that guide the work. Regularly pausing to improve systems, reduce technical or design debt, and invest in learning helps teams maintain speed and resilience over the long term.

Other brands are throwing shade at the new Instagram logo
Instagram's minor wordmark update has triggered widespread mockery from other brands claiming it's time for their own unnecessary 'refreshes'.
Original article
Instagram has replaced its 10-year-old wordmark with a cleaner, more digital-looking version, a change that has sparked criticism for being less distinctive and harder to read. The company says the update was simply due to the logo's age, prompting jokes from other brands about redesigning their own long-standing logos for the same reason. While some users welcome the refresh, many see it as a cosmetic change that does little to address broader perceptions of the platform.

I Just Found a Daily Doodle Website That's the Most Joyful Middle Finger to AI Art
Bakatako is an anti-AI drawing platform that forces users to create art directly within the browser to guarantee human authorship.
Deep dive
- Bakatako functions as a social network focused on daily art prompts.
- The platform enforces human creation by restricting file uploads, requiring all art to be made in its native web-based canvas.
- It provides basic tooling including a brush engine, stylus support, and drawing assistants.
- The project aims to combat art-related social media burnout and support artists struggling with creative consistency.
- It serves as a portfolio-building tool for artists seeking feedback and potential commission work.
Original article
Bakatako is a free, browser-based daily doodle site requiring artwork to be created directly on its canvas, ensuring human-made rather than AI-generated content.

20+ Tasty Candy Fonts for Sweet & Colorful Designs
A curated collection of 20+ candy-inspired typefaces featuring bubble shapes and soft curves for playful design projects.
Original article
This collection presents 20+ candy-inspired fonts featuring soft curves, bubble shapes, and playful lettering suited for packaging, social media, invitations, and children's designs.