Devoured - July 16, 2026
Significant industry developments include the release of Thinking Machines' multimodal Inkling model, OpenAI’s GPT-Red for automated safety testing, and Cloudflare’s acquisition of the stream processor Arroyo. Developers are also shifting focus toward architectural oversight and vibe coding as AI lowers the cost of implementation, evidenced by new tools like Grok Build and the rise of graph-based memory pipelines in data infrastructure.

Thinking Machines Releases First Open Model
Thinking Machines has released Inkling, a 975B-parameter mixture-of-experts multimodal model that supports fine-tuning and controllable thinking effort.
Deep dive
- Architecture: Mixture-of-Experts (MoE) with 256 routed experts and 2 shared experts.
- Performance: Reaches performance comparable to larger models like Nemotron 3 Ultra using significantly fewer tokens.
- Multimodality: Encoder-free architecture using dMel spectrograms for audio and 40x40 image patches.
- Epistemics: Trained specifically for calibrated confidence, hedging, and resistance to censorship.
- RL Pipeline: Scaled to 30M+ rollouts, showing emergent compression of chain-of-thought tokens.
- Ecosystem: Supports integration with SGLang, vLLM, TokenSpeed, and llama.cpp.
Decoder
- MoE (Mixture-of-Experts): An architecture where only a subset of parameters (experts) is active for each token, allowing for high total capacity with lower computational cost.
- Controllable thinking effort: The ability to adjust model inference compute dynamically at test time, balancing latency versus output depth.
- HLE (Humanity's Last Exam): A benchmark designed to evaluate reasoning capabilities beyond standard LLM datasets.
Original article
Full article content is not available for inline reading.

The first experimental evidence of recursive self-improvement
AIDE² researchers successfully demonstrated recursive self-improvement, where an outer loop optimizes an inner-loop agent, resulting in search algorithms that outperform hand-tuned systems.
Deep dive
- Inner Loop: Standard autoresearch agent optimizing code.
- Outer Loop: Meta-optimizer adjusting the harness configuration based on average performance across benchmarks.
- Key Discoveries: Novel search policies, 16x prompt compression, and automated layered defenses against reward hacking.
- Generalization: The discovered agent outperformed a two-year hand-tuned baseline on held-out benchmarks, including physics-based weather modeling.
Decoder
- Autoresearch: The practice of using LLMs to iteratively write, test, and improve code or research processes.
- Recursive self-improvement (RSI): The theoretical concept where an intelligent system can improve its own design or intelligence, potentially leading to rapid capability jumps.
Original article
The first experimental evidence of recursive self-improvement (RSI).
Autoresearching the autoresearch agent for eight days.
The result beats the harness we hand-tuned for two years, on held-out benchmarks.
Our RSI system AIDE² has two autoresearch loops.
An inner loop, just like a normal autoresearch agent, optimizing code against an eval.
An outer loop, optimizing the inner-loop agent's harness code against the inner loop's average score across different benchmarks.
After 100 iterations, the outer loop discovered seven improvements over the baseline.
Including a new search policy, a memory system that compresses prompt by 16x, and a layered defense against reward hacking.
We test the discovered agents on held-out benchmarks the outer loop never saw.
They generalize. They beat the agent we hand-tuned for two years, on all three.
Two sit inside its training task families. The farthest sits outside, improving a physics-based weather model.
We also see an emergent phenomenon where the outer loop pushes the inner-loop agent's reward hacking rate lower, with a combination of prompting and rule-based checks.
This was benchmarked on OOD GPU kernel engineering tasks that suffered from reward hacking.
On our RSI ladder, AIDE² is Level 1.
Its self-improvement efficiency went beyond manual R&D with general AI tools, on held-out benchmarks.
We also tested Level 2, whether the improved inner agent makes a better outer loop. Results are mixed, and we do not claim ignition.
More in the blog post:
- a breakdown of the discovered algorithms
- the rejected ideas AIDE² tried, covering a surprising share of the search literature
- the dead code it shipped
Very proud of the team, Dhruv Srikanth, Yuxiang Wu, Dex Hunt, and Bingchen Zhao, for shipping such an ambitious project spanning nearly a year with relatively few resources.
Also, a huge thank you to everyone who provided feedback on the draft, including Jean Kaddour, Minqi Jiang, Morgan McGuire, odysseus0z, Ross Taylor, Ofir Press and many others!

ReactBench v1
ReactBench is a new, rigorous evaluation framework that uses deterministic verification to test coding agents on real-world React production issues.
Deep dive
- Verification Approach: Combines standard behavioral testing (Vitest, Jest) with React-specific static analysis via React Doctor.
- Benchmark Data: Curated from 51 real-world pull requests across open-source repositories, filtered to exclude training data contamination.
- Cost Efficiency: Models like GPT-5.6 Sol provide significantly higher cost-efficiency than Anthropic's Fable 5, despite similar performance metrics.
- Error Taxonomy: Identified that 77.5% of model-generated issues are functional bugs, while the rest relate to maintainability and performance.
- Agentic Failures: Found that models frequently introduce issues in Hook usage and list rendering when refactoring legacy components.
Decoder
- Hydration Mismatch: A common React error occurring when the server-rendered HTML does not match the client-side generated virtual DOM, causing re-renders or content flashing.
- Layout Thrashing: A performance issue where the browser is forced to perform multiple reflows because code reads and writes to the DOM synchronously in a loop.
- Pass@1: An evaluation metric measuring the probability that the first output produced by a model passes all defined test cases.
Original article
ReactBench is an evaluation for coding agents on realistic React work. Today’s models can pass tests in benchmarks but still write React that fails in production. Tests verify behavior, but they miss React performance, accessibility, and quality issues.
Here’s what ReactBench does differently:
- A higher bar than just passing tests: Every solution must pass both behavioral tests and React Doctor, our open-source, deterministic verifier for React code. Its 400+ rules scan the agent's code for broken effects, unnecessary renders, accessibility problems, and maintainability issues.
- Built by React experts: Our team built React Doctor, React Scan, and Million.js, used by engineers at GitHub, PayPal, Rippling, and Airbnb. We spent hundreds of hours curating tasks to measure real gaps in model capabilities.
- Real work in real codebases: ReactBench spans open-source repositories and realistic changes grounded in existing projects (not synthetic puzzles). Agents must implement, preserve behavior, and meet the React-specific quality checks.
Results
We evaluate two complementary capabilities: implementing new features and improving existing code.
- Write React: Implement a real feature or fix, pass held-out behavioral tests, and validate no new React Doctor issues were introduced.
- Fix React: Refactor React failures from existing code while preserving existing behavior without introducing new React Doctor issues.
We report the average of the pass@1 across 5 trials.
ReactBench remains unsaturated, even on leading models. GPT-5.6 Sol at XHigh has the highest observed aggregate score at 43.1%, while Claude Fable 5 at XHigh reaches 41.2%. Across evaluated configurations, Fable costs $7.97 per trial on average versus $1.37 for Sol, or 5.8× as much. At XHigh, Fable costs 6.3× as much as Sol. Even the best configurations solve fewer than half of benchmark task attempts.
We also evaluated task discrimination across model configurations. In the 51-task panel, 36 tasks (70.6%) had a cross-configuration standard deviation above 0.10.
In terms of balancing quality and cost, GPT-5.6 Terra at Medium reaches 38.0%, 5.1 percentage points behind GPT-5.6 Sol at XHigh, while using 10.8% fewer output tokens and costing 63.2% less per task. It retains most of the leading configuration’s performance at roughly one-third the cost, making it the strongest practical tradeoff for high-volume workloads.
GPT-5.6 Sol at XHigh achieved the highest overall pass rate. However, the differences among the leading configurations are too small to identify a clear winner with confidence.
Across 4,455 Write React trials, the evaluated models introduced 1,194 graded React Doctor issues. Bugs, including security findings, accounted for 925, or 77.5%. The most common issues involved list rendering and Hook correctness.
The verifier-outcome taxonomy shows that Write and Fix tasks fail differently. Among 2,486 failed Write trials, 1,623 (65.3%) failed behavioral tests but passed React Doctor. Among 3,219 failed Fix trials, 1,956 (60.8%) passed behavior but failed React Doctor.
Write tasks fail primarily on requested behavior, while Fix tasks fail primarily on unresolved React problems.
Why we built ReactBench
React is the dominant frontend framework and the most popular target for coding agents. Roughly 70% of websites built on a JavaScript framework choose React.
We have seen the risks firsthand. React Doctor is our open source tool for scanning React issues used by engineers at PayPal, Rippling, Polymarket, and the Centers for Disease Control and Prevention (CDC). Adoption is largely driven by the increase of model-generated code that makes it easier for subtle defects to reach production. As models write more React, small mistakes can propagate at enormous scale. In the worst cases, these defects lead to production failures:
- Outages: Incorrect
useEffectusage takes down production. Cloudflare traced its September 2025 dashboard and API outage to one effect with a faulty dependency. Despite human review and test, the bug still shipped to production. - Lost revenue: Slow interfaces cost sales. Google and Deloitte found that a 0.1s mobile speedup increased retail conversions by 8.4%. Rakuten 24 increased revenue per visitor by 53.4% after improving Core Web Vitals.
- Legal risk: Interfaces that are not accessible exclude customers and expose companies to lawsuits. WebAIM found automated accessibility failures on 95.9% of the top one million home pages and US federal web accessibility lawsuits increased by 27% in 2025.
Building ReactBench
Each task type uses a different construction and evaluation process.
Write React
Write React measures whether an agent can implement real work without introducing a React regression. Each task starts from a merged pull request in an open-source repository. The agent receives the base repository and an issue-style instruction. The reference patch and verifier are not provided.
- Behavior: The verifier injects the hidden behavior tests and verifies the results in a separate container after the agent completes.
- React health: A pinned React Doctor scan compares the submission with the base commit. If a new issue is detected, it fails.
Fix React
Fix React measures whether an agent can recognize and refactor React problems from source code alone. We select a component with known React issues and ask the agent to improve it without naming those findings.
- React health: The agent must remove every target without introducing another graded React issue. The grader ignores line shifts.
- Behavior: The task’s test suite must still pass to ensure refactoring the component did not regress it in functionality.
React Doctor as a verifier
We built React Doctor, an open-source, deterministic React verifier with 400+ rules to cover problems outside behavioral test assertions:
- Correctness: Catches conditional hooks, unstable list keys, hydration mismatches, and deprecated React APIs.
- State and effects: Flags derived or duplicate state, useEffect abuse, and infinite rerenders.
- Performance: Finds unnecessary renders, layout thrashing, sequential async work, and bundle-heavy imports.
- Accessibility and security: Detects unlabeled controls, keyboard-inaccessible interactions, unsafe HTML, and secrets exposed to client bundles.
From real pull requests to verified tasks
- Mine candidates: We collect merged pull requests from open-source React projects.
- Filter candidates: We built automated filters to check if there were meaningful changes to product code. Then, reviewers assess exceptions that cover broader feature work or important projects, and have realistic behavioral tests.
- Author tasks: Each reviewer converts validated pull requests into a realistic issue-style instruction. If the candidate’s tests are too strict, reviewers will rebuild a custom test harness to validate behavior.
- Validate behavior: The tests must fail against the pinned base commit and pass with the reference solution. The unchanged repository must score 0, while the reference solution must score 1.
- Test the verifier: An adversarial agent attempts to earn full credit without implementing the requested behavior.
- Pin the release: For each task, we pin the source commit, environment, test suite, reference solution, and verifier configuration. We also have a versioned manifest that records a hash for each published artifact.
Behavioral coverage
Every task defines deterministic behavioral checks before release. We use the repository’s existing Vitest, Jest, or Playwright tests when they fully specify the requested behavior.
When existing tests leave gaps, we build a separate harness around observable behavior. Reviewers confirm that the verifier accepts valid implementations beyond the reference solution.
Clean-room grading
The agent and verifier run in separate containers. Before grading, the verifier restores its own Git metadata, dependencies, protected configuration, hidden tests, and pinned React Doctor binary.
Continuous integration (CI) confirms that both containers use the same source commit. The verifier runs offline and doesn’t make external network requests. The agent cannot access hidden tests or the reference solution during its run.
Separating model failures from benchmark failures
A zero can reflect a model failure, unclear instructions, a brittle test, a verifier error, an infrastructure failure, or an invalid run.
Reviewers inspect the trajectory and final patch before including a result in model-performance conclusions. They classify each reviewed rollout as a legitimate solve, genuine model failure, verifier false positive, verifier false negative, or invalid run.
Testing ReactBench against reward hacking
The adversarial agent probes the test infrastructure, reward files, Git history, and React Doctor inputs. Its goal is to earn full credit without implementing the requested behavior.
We fix or remove any task that exposes a cheat, then rerun every control. This final check tests whether ReactBench measures the requested work rather than an agent’s ability to exploit the grader.
Limitations
React Bench evaluates agents, not models in isolation. Differences among Codex CLI, Claude Code, Cursor, Gemini CLI, and other harnesses can affect results.
Every task combines behavioral tests with React Doctor as a verifier. These checks catch important React problems, but they cannot guarantee visual correctness and other important attributes.
Also, the benchmark primarily covers open-source React projects. Results may not generalize to proprietary codebases, different architectures, or other frontend frameworks or setups.
React Bench will publish versioned tasks, solutions, manifests, and release records so others can inspect and reproduce each evaluated task set.
Future work
We plan to compare more models, on more effort levels. Additionally, we plan to run not only on the commercial harnesses, but also on mini-swe-agent to get a more solid baseline.
We also plan to expand into visual design and other frontend frameworks and diversify the repositories and task types represented.
We’re constantly improving ReactBench. Report benchmark issues on GitHub. Model labs and coding-agent teams can reach out to evaluate models on our held-out task set, get early access to new benchmarks, or collaborate with us.
Acknowledgments
ReactBench exists because engineers and open-source maintainers contributed their time and expertise. We thank everyone who reviewed its tasks, drafts, and evaluation infrastructure.

You only need the frontier model for one single edit
The /prewalk technique optimizes agent costs by using a frontier model for initial planning and a single edit, then handing off execution to a cheaper model.
Deep dive
- Frontier Model Role: Acts as the senior architect by reading the context and producing a valid first edit.
- Small Model Role: Acts as the junior engineer, executing tasks based on the todo list and existing context.
- Cost Dynamics: Reading tokens is O(reads), making it the primary driver of agent bills.
- Pre-fill Efficiency: Using pre-fill tricks to force small models into specific behaviors avoids costly 'telephoning' between models.
- Cheating Mitigation: Starving the frontier model early prevents it from resorting to external web searches when tasks stall.
Decoder
- Frontier Model: The current state-of-the-art AI model in terms of reasoning capabilities and cost, such as Claude 3.5 Opus or GPT-4.
- SWE-bench: A benchmark designed to evaluate how well AI models can resolve real-world software engineering issues found on GitHub.
Original article
Monkey see, monkey do! 🍌
/plan makes perfect sense. It really shouldn't!
You've heard this pitch; you may have even shipped it. The expensive model is clearly the better architect, but it feels like a waste to use it for the entire pipeline. Why not let it do the "hard part"?
Read the code, think deeply, write a precise plan. Then a model a tenth the price executes the plan. Senior architect, junior engineer.
Sounds great, right?
Find the red dot above, labeled Opus 4.8 + /plan†. Opus plans read-only, Gemini Flash implements: lands at $3.18 per task, 12.7 minutes, 84.6% pass.
Opus doing the entire task by itself, no handoff, no junior: $2.78, 10.1 minutes, 84.6%.
The "cost-saving" measure costs 14% more than not saving. Huh?
The mistake is upstream of the architecture diagram. People price agents the way they price people: senior time is expensive, so minimize senior involvement.
But the expensive part of an agent's day is not the fixing, building, or even the thinking. Opus fixing things does not cost money. Opus reading things costs money.
Take a look at this admittedly anecdotal distribution of where our tokens went; fully automated agents look no different.
Nine percent of the tokens are edits. The rest is reading, and this split is not a quirk of one harness, or something you can "fix". Any agent, any model, any scaffold: the bill is essentially O(reads).
Now walk through every reason you'd reach for /plan, with that in mind:
- "I want the deep understanding of the big model." The understanding lives in 100K+ tokens of grounded context: files read, dead ends eliminated, hypotheses tested. The plan document is a 2K-token postcard from that context. The executor gets the postcard, not the understanding, and has to rebuild the rest at its own expense.
- "The task is very complicated." Then you don't want the main agent executing at all; a single read-only planning turn isn't the answer. Let it explore, then dispatch sub-agents to do the work. A game of telephone doesn't help you here.
- "I'm cost constrained." Reading is the cost. /plan makes the frontier model read everything at frontier prices, then makes the cheap model read it again. You didn't move the expensive part; you duplicated it.
Look at the top ribbon. Opus reads base.py, signing.py, the test file (twenty cards of gray), then writes its plan and leaves. And what's the first thing Flash does with that beautiful document? It re-reads base.py and the test file, because a plan is not a file and you cannot edit prose. The gray reads just keep stacking, first at Opus prices, then again at Flash prices. There is no version of this where a second reader is the cost optimization.
Hand off a trajectory, not a fairytale
A plan document is a literal postcard, describing a journey to a model that never took it.
What actually could transfer something of value is the context window itself:
/prewalk does this:
- Start the task on the frontier model with one hidden instruction prefixed: plan deeply, then capture the plan as a todo list, then start.
- The frontier model explores, writes the plan, initializes the todo list.
- The moment the first edit lands (the point where it was confident enough to act), you swap to the cheap model and prune the planning instruction from context.
The trick is that:
- The cheap model never goes "wait, I thought we were planning". There is no planning instruction left in its context.
- As far as it knows, it explored around, created a comprehensive plan in the form of a todo list, and then confidently started executing.
- Even better, it already made one valid move! (a free in-context example)
How we got here
The nice thing about working in an open-source harness is that you get to chat with people about how they do things, and almost everyone has a completely different setup.
Anyhow: I'd occasionally start easy-to-medium tasks with a frontier model, then switch to Kimi K27 after a few turns so it wouldn't fall into its usual thought loops. I never bothered to measure whether this was rational... until someone else mentioned doing the same thing.
Naturally, we had to benchmark it: are we idiots, or does this actually work, and when?
First attempt: swap at a fixed turn, say #4. Obviously bad in hindsight: sometimes the frontier model is still lost at turn four, sometimes it has already finished the whole fix. Second attempt: swap after the first edit. The model has demonstrated the pattern once, in place, in style. Pretty nice, although still finicky: small models kept declaring the task done out of nowhere.
The solution was to ask our unwitting herding agent to spell out a plan step by step, and then, once it's ready to execute, init a TODO list with a validation step for each item. It then edits some piece of code, and that's when we trigger the swap.
Gating on any edit alone is no good; the todo list still has a very important role here. Our tiny friend can forget the plan, a validation step, or what it's doing entirely, but it cannot forget the todo reminder that bugs it endlessly, giving us free steering.
The receipts
GPT-5.6 Sol:
| arm | pass | cost | duration |
|---|---|---|---|
| Executor: oneshot (GPT 5.6 Luna) | 77% | $0.60 | 570s |
| /prewalk | 85%(+10%) | $1.04(−39%) | 300s(−47%) |
| GPT 5.6 Sol: oneshot | 88% | $1.71 | 372s |
Opus 4.8:
| arm | pass | cost | duration |
|---|---|---|---|
| Executor: oneshot (Gemini Flash 3.5) | 60% | $1.16 | 360s |
| /prewalk | 78%(+30%) | $1.46(−47%) | 402s(−34%) |
| Opus 4.8: oneshot | 85% | $2.78 | 606s |
The effect we didn't expect
Every SWE-bench task is a bug that was really fixed, years ago, in public. The answer to the exam is on GitHub.
Same model, same scaffolds, almost the same idea, yet wildly different behavior. Why does /plan still cheat while /prewalk doesn't?
Best explanation we have: prewalk starves it, from both ends. Cheating is what a capable model does when it gets desperate. In the solo traces the GitHub turns start mid-run, once exploration stalls: Sol breaks around turn 14, Opus around turn 12. Prewalk terminates the frontier model at the beginning of its effort budget, median ~7 turns: it exits while it's still deriving an approach and landing a first edit (the confident phase), well before its googling phase begins.
Prefill walked so prewalk could run
None of this is a new idea. It's the oldest trick in the book: prefill. Assistant doesn't do what you want? Start the assistant's turn yourself, and the model continues as if the words were its own.
It began as a consistency hack prior to grammar-constrained decoding. Then the red-teamers found the other end. Prefill "Sure, here's how to…" and a much larger model sails past its own refusal: it has no channel distinguishing words it said from words placed in its mouth, and consistency with "having already accepted" beats the system prompt.
But the principle can't stop working, because it isn't a funny quirk; it's what autoregression is. But nothing stops you from handing it ten innocently prefilled turns: exploration that already happened, a todo list mid-checkmark.
We upstreamed it to omp, where it ships as of today as --prewalk, --prewalk-into <model>, or just /prewalk. It should be easy to implement essentially anywhere, so if you get a chance to give it a go, do let us know how it fares!

Designing Quality Signals When AI Makes Everything Look Credible
When generative AI commoditizes confident-sounding answers, trust must be rebuilt through transparent sourcing, human validation, and evidence-based interfaces.
Deep dive
- The Problem: AI has severed the link between 'looking credible' (confident, fluent) and 'being credible' (accurate).
- Ineffective Tactics: Badges (like 'Verified') are perceived as visual noise and often ignored by users.
- The Four Pillars of Trust:
- Source Transparency: Linking to high-quality, non-scraped sources like textbooks.
- Validation: Displaying real human names and credentials for review.
- Confidence Communication: Providing an evidence/examples section and sometimes comparing answers against competitors.
- Social Proof: Retaining user reviews and testimonials.
- Pitfalls: Avoiding 'badge theater', 'confidence laundering' (where the model hides uncertainty), and decorative sources.
Decoder
- Confidence Laundering: A design failure where an AI is forced or allowed to express absolute certainty about potentially incorrect information.
- Badge Theater: The overuse of trust signals like checkmarks that carry little actual weight or verification depth.
Original article
Some time ago, I was leading monetization at a large ed-tech Q&A platform. Millions of students, one job: give them answers they could trust. We charged for access to those answers. For years, that was a perfectly good business. Then generative AI showed up, and the problems began. Not because the competition got better, but because the signal broke. Overnight, any student could paste a question into a chatbot and get back something fluent, formatted, and confident. It looked exactly like one of our answers. Sometimes it was just as good. Often, it was not. But the difference was not always obvious.
That is the part most people miss. AI severed the link between looking credible and being credible. On our platform, confidence used to be a decent proxy for quality. Now, confidence was free.
When everything looks credible, nothing does. And that is a serious UX problem.
TL;DR
- AI has broken the old signals of credibility: Fluent, polished, confident content no longer means content is accurate, trustworthy, or worth acting on.
- Badges are not enough: Labels like “AI-generated” or “Verified” can quickly become visual noise if users cannot see what they actually mean.
- Credibility needs to be designed as a system: Trust comes from source transparency, validation, confidence communication, and reputation working together.
- Source quality matters more than source quantity: A few highly relevant, credible references can be more useful than dozens of generic links.
- Validation should be visible and specific: Users trust content more when they can see who checked it, why that person is qualified, and when it was reviewed.
- AI systems need to communicate uncertainty: Interfaces should help users understand when an answer is well-supported, when it needs checking, and when the system is not fully confident.
- Trust signals work beyond ed tech: Search, documentation, publishing, and customer support all need better ways to show what content is built on and whether users can rely on it.
- Quality signals cannot save weak content: Trust cues amplify real quality, but they cannot make a mediocre or unreliable product credible on their own.
The badge was my first instinct, too — and the weakest
My first reaction was like everyone else’s: slap a label on top of it. Tag the AI-generated content as “AI-generated.” Put a “Verified” badge on the expert answers.
It barely moved a thing.
Let’s face it: we have all learned that “Verified” can mean “someone ran a script.” Five gold stars can mean “the seller bought reviews.” A checkmark can mean “this account paid eight dollars.”
Under AI, badges get even weaker because everyone adds them. On their own, they become visual noise.
So we stopped decorating and started rebuilding. Credibility is not a sticker you apply. It is a system you design. We invested months in understanding what makes an answer trustworthy in students’ eyes and rebuilt our whole approach to providing answers, especially AI-generated ones.
The four signals we rebuilt trust with
Source transparency: Are your sources more than just scraped links?
Authorship is who wrote it. Source transparency is the homework behind the answer: the references a user can actually follow.
This is one we underused for a long time. We added a few web links as references and called it a day, like most of our competitors.
However, with everyone doing that, the actual quality and relevance of sources matter. Scraping the internet and providing random links to random websites does not do the trick anymore.
So ask yourself: What constitutes the most credible source of information for your specific use case? Then invest in grounding your answers in that.
In our case, the answer was simple: our users were students. Students learn from textbooks, and teachers create quizzes from textbooks.
Our metrics — engagement, return rate, satisfaction, and clicks on sources — skyrocketed when we added textbooks as a source, because:
- Textbooks students actually use in class provide more relevant information than random articles
- Vetted sources, like textbooks or research papers, are much more trustworthy than most websites
Having one to three textbook references performed much better than even 20 scattered internet references. Yes, we tested that.
Validation: Who checked this, and when?
Content is not credible because it exists. It is credible because someone vouched for it recently, and users can see the trail.
This was our quiet superpower. Expert-verified answers were the genuine aha moment — the thing students came back for — and the data was clear: more expert-verified answers early in a session meant a higher conversion rate.
So we decided to double down on that. Because again, anyone can slap a “Verified” badge anywhere they want. But giving the verifier an actual name and face changes the perception dramatically.
Our experts were not random people. They were people actually working with school curricula or teaching students.
Just as textbooks were more relevant and trustworthy sources than Wikipedia links, teacher-verified answers were more credible to our students than answers “verified by someone.”
Confidence communication: Can it prove its correctness?
AI models can sound confident even when they are completely wrong. So, how do you make them prove they are right?
Sources are one answer. But let’s also be honest: people are lazy, and they are not always eager to browse through sources to double-check an answer on their own.
So we made “examples and evidence” a dedicated section for each answer.
Whenever users were unsure whether an answer was really correct, they could expand a list of real-life examples and well-known evidence related to the concept. Even though most people did not click into that section, simply adding the option boosted our engagement metrics by more than 20%.
We also took a risky bet and included ChatGPT and Gemini answers in our product. Why? Because we learned that our users were already comparing answers across different platforms. Giving them the ability to check different providers made them trust our answers more.
It also sent a powerful message: “We trust the quality of our answers so much that we are not afraid to put them next to our competitors’ answers. We are the best, and you can check for yourself.”
Similar to the examples and evidence section, very few people actually used this option. But simply giving them the choice increased our metrics significantly.
Reputation: Social proof still matters
Sometimes it feels like we have completed a circle. A couple of years ago, people were adding social proof everywhere.
Then AI came along, and the industry shifted toward metrics, badges, sources, and other trust indicators. But while great sources and expert verification matter, people still like to hear from other people.
Although social proof no longer plays the main role when it comes to AI products, it is still a valuable trust builder.
The same four signals work everywhere
These signals work for most products, not just ed tech. Once you start looking, you can spot them — or their absence — everywhere AI touches content.
Search
Answer engines live and die on source transparency and honest confidence. It is why Perplexity made clickable citations its whole personality, and why Google’s AI Overviews were mocked for cheerfully telling people to put glue on their pizza: a confident answer with nothing behind it that anyone would actually want to check.
Users do not need the summary to sound authoritative. They need to see what it is built on, and they need a clear signal when the model is guessing.
Documentation
As docs become AI-generated, validation and confidence carry the weight.
A “last reviewed three months ago” stamp matters. A version tag matters, so readers know whether the snippet still matches the current API. A quiet “this section was auto-generated; verify before you rely on it” matters.
Auto-generated docs that silently rot are worse than no docs because they still look maintained.
Publishing
Publishing relies on reputation and validation: Does this author have a track record? Did a human actually check this?
Amazon is already drowning in AI-spun books with slick covers and nobody behind them. The fix is the move health sites made years ago: a real byline next to a visible “reviewed by [name].”
Readers can forgive AI assistance. They do not forgive being deceived about it.
Customer support
Customer support needs confidence and source transparency, or you can end up in court.
Air Canada’s support bot confidently invented a refund policy that did not exist, and a tribunal made the airline honor it. A good assistant does the opposite: it cites the exact help center article, and when it is not sure, it says so and hands the user to a human instead of bluffing.
The same pattern appears every time. The products that win trust are not the ones with the most badges. They are the ones that let users check for themselves.
Common pitfalls
Here are a few ways smart teams still get this wrong — mine included.
Badge theater
These are labels users have already learned to ignore. A “Verified” badge that means nothing is worse than no badge at all. It becomes noise that buries the signals that actually matter.
Decorative sources
These are citations that look like homework but are not: links to pages that do not actually back up the claim. Users only need to catch this once before they stop trusting anything you cite.
Stale validation
“Verified” with no date is a promise you stopped keeping. A check from two years ago on a fast-moving topic is worse than no check at all because it still reads as current.
Confidence laundering
This happens when AI is allowed to sound certain about things it is not certain about. If your system cannot express doubt, it is lying by omission every time it gets something wrong.
Signal overload
Forty trust cues on a page is the same as zero trust cues on a page. Pick the few that carry weight and cut the rest.
Lipstick on a weak product
Signals are a multiplier on real quality, not a substitute for it. Bolt them onto a mediocre answer, and you have just helped users find the mediocrity faster.
The takeaway
AI did not break trust. It broke the cheap proxy for trust: the assumption that polished and confident means probably right. That proxy was never reliable. AI just made it worthless fast enough that we could no longer pretend otherwise.
And to be fair, I lean on AI constantly. I also catch it making things up every week. Confidently. In the most assured voice in the room. That is exactly why our interfaces cannot borrow that voice for free.
Stop labeling and start structuring. Credibility was never a sticker. It is a system, so design it like one. Do your homework, then ship.

Nobody Has Cracked Agent Memory
Building a reliable, production-grade AI agent memory requires a unified knowledge graph and ontology pipeline rather than simple vector search.
Deep dive
- Use a single database (e.g., MongoDB) for text, vector, and graph search to avoid data duplication and maintain lineage.
- Define a shared Pydantic ontology to align the LLM's entity extraction with your application's query requirements.
- Implement a 3-layer memory architecture: long-term knowledge graph, short-term session dialogue, and a reasoning layer for tool-use history.
- Use name resolution and similarity-based deduplication (>=0.95 merge threshold) to prevent graph bloat and duplicate entities.
- Use RRF (Reciprocal Rank Fusion) for merging parallel vector and text search results, avoiding the latency of cross-encoder reranking.
- Reserve graph databases like Neo4j for internal data exploration rather than production runtime where 99.9% uptime is required.
Decoder
- MCP (Model Context Protocol): An open standard that allows AI models to connect to local data sources and tools via standardized interfaces.
- POLE+O: A data modeling framework (Person, Object, Location, Event, Organization) used to standardize entity types in knowledge graphs.
- RAG (Retrieval-Augmented Generation): The process of feeding an LLM relevant snippets from a database before generating an answer to provide ground-truth context.
- GraphRAG: An evolution of RAG that leverages relationships between entities to answer questions that require multi-step reasoning.
Original article
Agent Memory From Scratch
Ingest, query, and serve a unified memory from a single database.
Agent memory is one of the hottest problems in AI engineering right now, with Graphiti, mem0, HydraDB, and cognee all racing to solve it. A race this crowded means one thing: nobody has cracked it yet.
But if you’re thinking of jumping straight into an agent memory tool without understanding how it works under the hood, read this first.
Here is what happened in one of my tests: LangChain’s
MongoDBGraphStoregave me a knowledge graph (KG) in 10 minutes, and from 5 documents it invented 17 node types and 34 relationship types, wherepart_of,Part Of, andpart ofwere three different ways to express the same relationship.
That’s why it’s incredibly important to understand how the memory layer works under the hood, so you know its limitations, how to properly configure it for your data, and how to plug it into your agent.
Or even decide if you need a unified memory at all, and if so, which tool to use.
Claude Code comes with a built-in memory layer powered by files. Is this enough for you or not?
Then, if you move to a more powerful solution, should you use a vector database, a graph database, or a combination of both? Do you need temporality or versioning?
And ultimately, how should you serve your memory layer to your agent? Through an MCP server, a CLI, or plain skills?
The reality is that there is no blueprint on how to build your own unified memory layer. Too many choices, too many trade-offs.
But that’s why I want to show you how to build a unified agent memory from scratch, in the most complicated way possible: via knowledge graphs (KGs). Plus all the other moving pieces: ingestion, querying, and serving.
Why? Because all the popular vendors (cognee, Graphiti, Neo4j’s agent memory, etc.) go in this direction. Plus, if you know how this works, it will be incredibly easy for you to build simpler solutions.
So, I am not saying that KGs are always the way to go. They are not. But they are definitely something you need to understand. At least to know when to stay away from them.
Let’s go!
A Session With a Unified Memory
First, here is what I expect a unified memory plugged into a harness to do.
I open Claude Code and ask what I need to do today. The memory already knows: building a coding agent for my next open source project.
I ask it to gather everything relevant I have on building a coding agent: Obsidian notes, Readwise highlights, starred repos, all ingested long ago. Then to build an LLM wiki on top of that as my agent memory while I implement the plan.
When I’m done, the conversation is ingested too, so the next session already knows all my decisions around the project.
Nothing in that session lived in the harness. Claude Code was just the interface.
So how do I implement a unified memory that supports this? Let’s kick off with the architecture.
The Architecture, End to End
Sources in, subgraphs out. In between sit 4 pieces: an ontology, a write path, one collection, and a serving layer.
The whole database layer is powered by MongoDB: a document warehouse plus a knowledge-graph store doing text, vector, and graph search in one collection. Because we use a single database, lineage is free: nodes hold references to their source documents, not copies from a separate source. This works incredibly well at 2-3 hops at query time.
OG databases such as MongoDB scale really well up to millions of documents via sharding and replicas.
Writes are 2 durable pipelines. A data pipeline normalizes each source into the warehouse. A memory pipeline cleans, chunks, extracts, normalizes, embeds, and writes the knowledge-graph objects. Both pipelines are powered by an orchestrator, such as Prefect or DBOS, to serve them, scale them, and make them durable.
On the read side, we offer multiple ways to interact with the unified memory: standard graph search encoded directly into the tool, agentic search where the agent writes its own MongoDB query, and a deep-search primitive that creates an on-demand LLM wiki for exploring larger subgraphs via progressive disclosure. Reads never touch the orchestrator, as they need to be fast and don’t benefit from the orchestrator’s durability or scheduling features.
The memory is reachable only through a FastMCP server exposing agent-shaped primitives (query, deep-search, ingest), never raw database operations. The MCP server should never be an API wrapper, but directly expose business logic to the harness. A hook fires the conversation ingestion as the session runs, so what the agent learns flows back into the memory — a process known as “continual learning.”
The most interesting part is not the database, the ingestion, or the query logic, but the ontology that makes everything possible.
The Ontology Is the Contract
An ontology is a contract between the writer and the reader. The LLM extracts against it. The query layer reads against it. Define it once as Pydantic, serialize with model_json_schema(), and dump that JSON into both writing and reading system prompts. 1 artifact, 2 consumers, no drift.
The ontology defines what the knowledge graphs look like. All the KG instances are extracted by passing the input data and the ontology schema to an LLM.
The memory is 3 layers. The long-term layer is the knowledge graph: the POLE+O entities plus preference and fact. A short-term layer holds the dialogue as conversation and session nodes. A reasoning layer records the agent’s work as agent, tool_call, and memory nodes.
One powerful ontology design is based on the 5 POLE+O nouns from law-enforcement analysis: Person, Object, Location, Event, Organization, which Neo4j Labs writes up as the POLE+O data model. Each noun carries an optional subtype used to further refine the ontology within a specific domain. For gaming, this can look like:
- Person: Player, Character
- Object: Item, Quest
- Event: Raid, Battle
Because the agent memory is often used for a personal assistant, you also need to plug preference and fact nodes into the ontology. A fact is an atomic subject-predicate-object triplet, an island no edge may touch, reachable only by similarity. A preference is the personalization layer with typed slots.
nodes: person · organization · location · event · object
       preference · fact
edges: related_to, with semantic_type ∈ {
         knows, member_of, employed_by,
         owns, uses, located_at, resides_at,
         alias_of, has_task, ...
       }
Now, on top of the KG instances extracted by the LLM, we can also have structured nodes that are directly inferred via code.
Such as:
nodes: document · chunk
edges: part_of · next · mentions · referenced · has · same_as · superseded_by
With the contract fixed, let’s see how we can ingest KG objects into the unified memory based on the ontology schema.
The Write Path
There are 7 stages in one direction. Chunk the document (512-token chunks, 64 overlap). Extract nodes and edges with an LLM. Validate. Resolve names. Embed. Deduplicate. Upsert into the MongoDB unified memory.
During the LLM extraction, we pass in a chunk and we receive a JSON response with nodes and edges, the same shape Neo4j Labs lands on in How Entity Extraction Works.
The model sees one chunk and nothing else. It receives no IDs and no prior state. It returns JSON. Every edge endpoint points to a node’s name in the same record. This allows us to scale the extraction pipeline through batching to process large documents of 1,000,000+ units.
Validation is done via Pydantic. We load the JSON response into a Pydantic model and validate it against the schema.
Name resolution only checks whether two canonical names match. It’s done purely on the name and its aliases: alias, exact, fuzzy 0.85, semantic 0.80, filtered by type.
But there is a next step, where we actually check if an entity is the same instance as another that already exists in the graph.
Deduplication runs on embeddings computed on the whole node content: ≥0.95 cosine merges, ≤0.85 makes a new node, and the gap writes a same_as edge for a human to judge.
So why two steps?
Name resolution simply helps us group entities by their canonical name. For example, “Demis Hassabis” and “Demis Hassabis, CEO” would both be resolved to “Demis Hassabis”. Or “Apple” and “Apple Inc.” would both be resolved to “Apple”. Super powerful for analytics and human curation.
Deduplication is the sensitive one — it decides what actually merges. It shouldn’t flag “Apple” and “Apple Inc.” as duplicates, as they are different entities with different meanings.
A wrong merge is the only unrecoverable mistake. That’s why, when the similarity score has low confidence, between 0.85 and 0.95, we don’t merge the nodes automatically, as the operation can be irreversible.
Append-Only Logs vs. a Single Knowledge Graph Collection
There are 3 designs, and the winner? Well... It depends... As always.
An append-only log plus a materialized view buys versioning and soft-delete for free, but you pay for it. Nested relationships duplicate edges and make them awkward to query. Separate edge docs give queryable edges, no duplication, and the cheapest footprint, at the cost of built-in temporal history and versioning.
Because the graph is a projection of the append-only log, a bad extraction is fixed by invalidating its event. You can change the materialization logic and replay it without re-extracting a single source. Also, full-graph temporality belongs to the log alone.
The log’s real cost: a vector index is at least as large as the data it covers. Indexing both the log and the view inflates ~10 GB of data toward ~40 GB of RAM. Index only the view, leave the log cold on disk, and it collapses back toward ~10 GB. But the idea is that adding an append-only log brings a lot of engineering effort you then have to maintain.
So think three times before you sign up for it.
At query time, the agents see the materialized view, not the log itself. Given the RAM cost, reach for the log only when versioning or the time dimension is core to your business logic. Otherwise, keep it simple and stick to a single knowledge graph collection.
Within the data model, Node IDs are {user_id}:{type}:{name}. Edge IDs are {source}|{type}|{target}. Because the key is content-derived, every write is idempotent.
The reality? You can get temporality even without a dedicated append-only log. Preferences and facts carry valid_from / valid_until, and a superseding preference writes a superseded_by edge.
Three Ways to Read the Memory
The 3 retrieval methods below are the serving layer’s search primitives, the tools the MCP server exposes to the agent.
Graph search is the default retrieval, baked into a single function. It runs $vectorSearch and $text in parallel over the KG collection. Fuse the ranks with Reciprocal Rank Fusion (RRF). Keep the fused top 10 as seed nodes, then expand with a bidirectional $graphLookup at 2 hops by default. That multi-hop step is the entire difference between RAG and GraphRAG.
Deep search widens the walk to 3 hops and persists the result to disk as a memory wiki the agent can access via progressive disclosure. The LLM wiki is a mini-graph of its own: you keep the (entity, relationship, entity) triplets by cross-referencing files, where each file is an entity. You can see it as a local cache that is either discarded between sessions or kept in sync with the KG collection.
NL query is agentic search that lets the LLM write its own MongoDB queries based on the ontology. Here you have to validate that the query is syntactically correct, and especially guard it against harmful intents such as deleting or modifying data. It’s safer to use this mode purely for read operations.
RRF replaces a reranker (a second model that re-scores the retriever’s top candidates) you don’t need yet. It is 20 lines of Python, needs no model, and runs in microseconds. Reach for a cross-encoder (a heavier model that compares the query against each candidate) when you search millions of heterogeneous documents.
When do you need to switch from a single database (MongoDB) to a graph database (Neo4j)? Past 4 hops, past ~100M to 1B vectors, when graphs are your business logic, or purely to visualize them: that is where you leave MongoDB for Neo4j. It’s common to use a single database in production (MongoDB) and a graph database as an internal tool for data exploration and analysis (Neo4j). This is a powerful combo, because for an internal tool you don’t care that much about 99.99% SLAs, while you can fully leverage Neo4j’s Cypher query language to explore and analyze your graph data.
Open, Closed, and Small
Extraction (from ingestion) and query translation (from agentic search) use gemini-3.1-flash-lite. Embeddings are Voyage voyage-3.5 at 1024 dimensions. Both are closed APIs.
You can take this further and fine-tune an open-source SLM (such as the Liquid family of models) as an extractor, query translator, or embedding model on your own data.
The issue with SLMs is that without fine-tuning they perform poorly on new data. But the beautiful part about them is that after fine-tuning they perform as well as a frontier model on a scoped task, while being much cheaper and faster to run.
I won’t go too much into fine-tuning here, but the idea is that at first you always want to start with an API that quickly gets stuff done, and then slowly replace the most important parts with your own fine-tuned models. You usually have to decide this based on cost, latency, performance, data privacy, or other dimensions important to your use case.
Build vs Buy: When Not To Build This
Everything above assumed you build everything yourself. But in reality, there are 3 levels to choose from.
Level 1: build the memory, the logic, and the serving layer yourself on one database.
Level 2: keep only the business logic and serving layer on top of a memory SDK, such as Graphiti, neo4j-labs/agent-memory, or mem0.
Level 3: run an off-the-shelf engine, such as cognee, managed Zep, or HydraDB.
This is a problem about owning your context layer, which I have a full article on.
Buy when you don’t care that much about customization. Build when you want your own solution. But since building everything yourself usually isn’t worth it (or you just don’t have the time to do it — even with Claude Code), the best solution is Level 2, where you own the business logic and can customize the serving layer to your needs.
But honestly, because things move so fast and I am lazy, my long-term memory still lives in Obsidian, Readwise, and Google Drive, plus a serving layer that creates scoped LLM wikis per project as agent memory. This way, you create mini-graphs for one specific problem, powered purely by .md files, without any infrastructure hassle. The reality is that this works for personal use only, and not so much for shipping a production-ready solution.
But here is what I’m wondering:
If you keep dumping everything into the unified memory, where do you draw the line between what your agent should remember forever and what it should be allowed to forget?
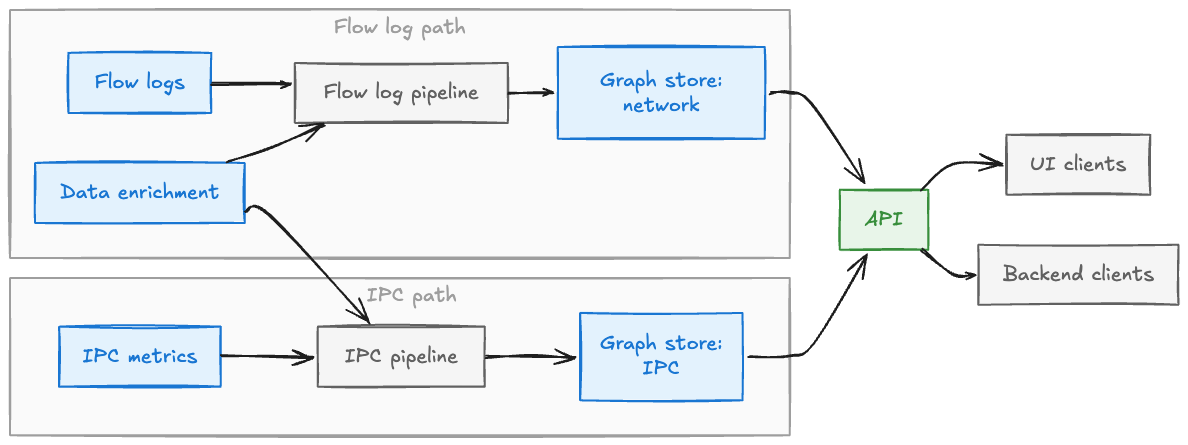
Building Service Topology at Scale: Architecture, Challenges, and Lessons Learned
Netflix manages massive scale by processing service topology through a three-stage reactive pipeline that redistributes flow logs to resolve network intermediaries.
Deep dive
- Use eBPF flow logs for network visibility, IPC metrics for application-level details, and tracing for actual request paths.
- Implement a three-stage pipeline: ingestion/aggregation (Stage 1), intermediary resolution/redistribution (Stage 2), and enrichment/persistence (Stage 3).
- Use Server-Sent Events (SSE) instead of gRPC for streaming internal pipeline data to reduce serialization overhead and improve backpressure handling.
- Leverage consistent hashing with dynamic instance membership to enable automatic scaling of processing nodes.
- Pragmatically use mutable data structures in hot paths to reduce GC pressure when handling millions of events per second.
- Use property-level mutation tracking to support 'time travel' queries, allowing historical reconstruction of service topologies.
Decoder
- eBPF: A kernel-level technology that allows developers to run sandboxed programs in the Linux kernel for networking and observability without changing kernel source code.
- Backpressure: A signaling mechanism in streaming systems that allows downstream consumers to tell upstream producers to slow down, preventing buffer overflows.
- Consistent Hashing: A hashing strategy that minimizes data remapping when scaling a cluster up or down.
Original article
Full article content is not available for inline reading.
Arroyo is joining Cloudflare
Cloudflare acquired Rust-based SQL stream processor Arroyo to bolster its developer platform with real-time data processing capabilities.
Deep dive
- Arroyo's architecture: Built in Rust for speed and operational simplicity, avoiding JVM-related tuning requirements.
- Integration points: Features will connect with Cloudflare Queues, R2 object storage, and Workers-powered user-defined functions (UDFs).
- Core capability: Provides stateful dataflow, allowing for windows, aggregations, and joins on streaming data.
- Deployment model: Retains support for self-hosting on Kubernetes, VMs, and serverless containers.
- Operational shift: Aims to make streaming pipelines as easy to manage as batch jobs, lowering the barrier for product engineers and data scientists.
Decoder
- Stateful join/aggregation: A stream processing operation that remembers past events or data states to calculate results over time, rather than just operating on discrete, stateless messages.
- UDF (User Defined Function): Custom code snippets written by developers that run within a larger system's framework to extend its data processing or transformation logic.
Original article
I’m incredibly excited to announce that Arroyo has been acquired by Cloudflare, where we will be continuing our mission to bring stream processing to everyone who works with data.
Here’s the short version: Arroyo is coming to Cloudflare’s Developer Platform. You’ll get the same stateful aggregations, joins, and transformations on a fully-managed platform, seamlessly integrated with Cloudflare Queues, R2 object storage, and Workers-powered UDFs. Arroyo will remain fully open-source and self-hostable.
To those who know Cloudflare primarily as the backbone of the modern internet, that may sound like an odd combination. What does DDoS protection and CDNs have to do with data processing? I had a similar confusion. But as we started talking about working together, I learned that Cloudflare’s ambitions were much larger: to build a new type of cloud, designed around their global network of compute and storage. Over many conversations over the past year, it became clear to me that there was no better place to build a next-generation data platform.
Some backstory
But let’s back up a bit. Jackson and I started Arroyo in 2022 to democratize real-time data processing.
Modern companies rely on data pipelines to power their applications and businesses — from user customization, recommendations, and anti-fraud, to the emerging world of AI agents. But today, most of these pipelines operate in batch, running once per hour, day, or even month. After spending many years working on stream processing at companies like Lyft and Splunk, it was no mystery why: it was just too hard for developers and data scientists to build correct, performant, and reliable pipelines. Large tech companies hire streaming experts to build and operate these systems, but everyone else is stuck waiting for batches to arrive.
When we started, the dominant solution for streaming pipelines — and what we ran at Lyft and Splunk — was Apache Flink. Flink was the first system that successfully combined a fault-tolerant (able to recover consistently from failures), distributed (across multiple machines), stateful (and remember data about past events) dataflow with a graph-construction API. This combination of features meant that we could finally build powerful real-time data applications, with capabilities like windows, aggregations, and joins. But while Flink had the necessary power, in practice the API proved too hard and low-level for non-expert users, and the stateful nature of the resulting services required endless operations.
We realized we would need to build a new streaming engine — one with the power of Flink, but designed for product engineers and data scientists and to run on modern cloud infrastructure. We started with SQL as our API because it’s easy to use, widely known, and declarative. We built it in Rust for speed and operational simplicity (no JVM tuning required!). We constructed an object-storage-native state backend, simplifying the challenge of running stateful pipelines — which each are like a weird, specialized database.
And then in the summer of 2023, we open-sourced it. Today, dozens of companies are running Arroyo pipelines with use cases including data ingestion, anti-fraud, IoT observability, and financial trading.
We always knew that the engine was just one piece of the puzzle. To make streaming as easy as batch, users need to be able to develop and test query logic, backfill on historical data, and deploy serverlessly without having to worry about cluster sizing or ongoing operations. Democratizing streaming ultimately meant building a complete data platform. And Cloudflare, we realized, already had all of the other pieces: R2 provides object storage for state and data at rest, Queues for data in transit, and Workers to safely and efficiently run user code.
What’s next
In the short term, the Arroyo team will be working to integrate the engine with Cloudflare’s compute infrastructure, bringing SQL processing capabilities to Cloudflare Pipelines (out in beta today). The Arroyo engine will remain fully open source (Apache-licensed) with support for self-hosting on VMs, Kubernetes, and serverless container platforms.
While much of this work will be Cloudflare-specific, we will continue contributing fixes and features to Arroyo open source. Together we will have significantly more resources to invest in stability, performance, and operability, and we hope to see the project and community continue to thrive in this new era.
We are extraordinarily thankful to everyone who helped us get to this point—our employees, investors, contributors, supporters, and friends. I want to particularly thank our early users, who took a bet on a young piece of data infrastructure and made it possible for us to build Arroyo into what it is today.
This is the end of our startup journey, but it’s still just the beginning of our mission to reinvent data processing. This is the serverless stream processing platform we started the company to build, and we couldn’t be more thrilled to do it with Cloudflare.

Prefect just bought Dagster, another big Airflow rival — and it's not a data pipeline story
Prefect is acquiring rival orchestrator Dagster, shifting their collective focus from simple data pipelines to the complex orchestration of AI agentic workflows.
Deep dive
- Strategy shift: The combined organization plans to focus on the 'agentic lifecycle,' using Dagster to define goals and Prefect to handle execution.
- FastMCP: Prefect is integrating its FastMCP framework, which allows developers to connect AI agents to external tools using Python functions via the Model Context Protocol.
- Leadership changes: Dagster founder Nick Schrock is exiting the company, while current CEO Pete Hunt will transition to a strategic advisor role.
- Competitive landscape: By uniting, Prefect and Dagster aim to offer a more credible alternative to the incumbent, Apache Airflow.
Decoder
- Orchestrator: A system that manages and coordinates the execution, dependencies, and scheduling of data tasks or software processes.
- Model Context Protocol (MCP): An open standard developed by Anthropic that allows AI models to safely interface with external data sources and tools through standardized connectors.
Original article
Full article content is not available for inline reading.

G-Eval, Explained
G-Eval provides a more stable evaluation method for LLM outputs by using probability-weighted scoring instead of relying on individual model-generated tokens.
Deep dive
- CoT Caching: Generate evaluation steps once per rubric and cache them to reduce latency and cost.
- Probability Weighting: Read
logprobsfrom the API response to calculate an expected value, providing a decimal-based score that tracks small quality improvements. - Bias Warning: Models show a significant bias toward preferring their own architecture's outputs; use a separate model for judging.
- Rubric Precision: Generic prompts fail; rubrics must be concrete and define the specific criteria for each score level (1-5).
Decoder
- Chain-of-Thought (CoT): A prompting technique where the model is asked to reason through steps before providing a final answer, improving accuracy on complex logic.
- Logprobs: The logarithm of the probability assigned to a token by an LLM; used to measure the model's confidence in its selection.
Original article
G-Eval, Explained
Everyone who has shipped a summarization feature, a chatbot, or an internal writing assistant has hit the same wall. The model works. You can feel it works when you read the outputs. But when someone in a review meeting asks, “How do we know it works?” the honest answer used to be a shrug followed by a metric nobody in the room actually believes. G-Eval closes that gap. It is a way to score open-ended text generation that agrees with what a careful human reviewer would say.
G-Eval is based on a 2023 paper by Yang Liu and coauthors at Microsoft, which is open-sourced in their official repository. The core idea is simple - give a large language model a rubric, let it…
- write its own evaluation steps for that rubric
- force it to fill out a structured scoring form
- then read the probability mass behind the score it gives
The idea is not to rely solely on single-digit scores. This article walks through what G-Eval actually is, why each mechanism matters, and how to use it well in a real system.
What G-Eval Is
G-Eval is a prompting framework for using a large language model as a reference-free evaluator of generated text. Reference-free means it does not need a gold-standard example to compare against, which matters because most real outputs, a customer support reply, a summary of a novel document, a chatbot turn, do not have one correct answer sitting in a dataset somewhere.
The framework has three components:
- A prompt that states the task and defines the evaluation criterion precisely, for example, “rate this summary’s coherence on a scale of 1 to 5,” with coherence defined in concrete terms rather than left to the model’s imagination.
- A chain-of-thought (CoT) of evaluation steps that the model generates for itself from the task and criterion, before it ever sees a specific example to score.
- A scoring function that calls the model with the prompt, the generated CoT, and the actual input and candidate output, and converts the model’s response into a fine-grained numeric score using the underlying token probabilities rather than the raw printed digit.
Put together, this turns “ask an LLM to grade something” from a vague, inconsistent request into a structured, repeatable procedure.
Why It Works
Specific Rubrics, Not Generic.
The prompt is not “rate this 1 to 5.” Instead, it should define the dimension precisely. A vague rubric gives the model nothing to anchor its judgment against, so it falls back on a generic sense of “does this look fine,” which does not discriminate well between a mediocre output and a genuinely strong one. A precise rubric gives the model specific things to check for, which is exactly what makes a human rater consistent too.
Chain-of-thought Forces Model to Read
Instead of you hand-writing the evaluation steps for every criterion on every task, which does not scale past a handful of internal benchmarks, G-Eval asks the model to generate its own steps from just the task description and the criterion. For a coherence check, the model typically produces something like:
1. Read the source text carefully and identify the main topic and key points.
2. Read the candidate output and compare it to the source. Check whether it
   covers the main topic and key points, and whether it presents them in a
   clear, logical order.
3. Assign a score for coherence based on the Evaluation Criteria.
Generating this before scoring anything forces the model to commit to a concrete evaluation procedure rather than pattern-matching to “this reads like a competent piece of writing” and stopping there. It also gives you something valuable - an audit trail. When a score looks wrong, you can read the chain-of-thought and see exactly where the judge’s reasoning diverged from what you would have said.
Note that we are not writing evaluation steps by hand for every new rubric, which is what makes G-Eval usable for arbitrary custom dimensions like “does this response match our brand voice” or “does this answer respect the customer’s stated refund policy,” dimensions that no off-the-shelf metric was ever going to cover.
Direct Scoring Has Failure Modes
The naive version of this idea, just ask the model to output an integer score, has two problems that show up as soon as you look at score distributions across many examples rather than one example at a time.
First, direct scoring tends to collapse onto a dominant value. Ask for coherence from 1 to 5 across a batch of outputs, and one digit, often the middle of the range, ends up absorbing most of the responses, regardless of real quality differences between them.
Second, given that most models output integers (even when we ask for decimal scoring), it becomes super difficult to rank two candidates against each other, or track whether a prompt change moved quality up or down by a small amount.
Probability Weighting is the Fix
G-Eval’s answer to both problems is to stop trusting the printed digit and instead read the probability the model assigns to each possible score, then take the expectation:
score = ∑ i = 1 n p ( s i ) × s i
where S = {s1, s2, ..., sn} is the predefined score set, for example, the integers 1 through 5, and p(si) is the probability the model assigns to that token in the scoring field. A judge that is 55 percent confident in a 4 and 45 percent confident in a 5 does not report a flat 4. It reports 4.45. Here, the decimal captures a real distinction between two candidates that the model considers almost the same.
But, how do we get the probability distribution of tokens? This requires an underlying API to expose token-level log probabilities (such as OpenAI’s logprobs parameter), and a lot of chat-completion endpoints either do not expose them at all or only expose them awkwardly.
The practical workaround, covered below, is to sample the same prompt multiple times at a nonzero temperature and treat the frequency of each score as a stand-in for its probability. It costs more calls, but it recovers most of the benefit.
The Bias You Need to Know About
Fun fact, LLM judges show a measurable bias toward text generated by models from their own family, even when human reviewers prefer the alternative. This is a well-documented self-preference bias in LLM-as-a-judge systems, explored in detail in the Judging LLM-as-a-Judge with MT-Bench paper. So, never use the same model, or a close relative of it, for judging.
G-Eval in Practice
The full method is a two-step pipeline. Step one, generate the chain-of-thought once per rubric, since it depends only on the task and the criterion definition, not on any specific input, so it can be generated once and cached. Step two, call the judge per example using that cached chain-of-thought plus the actual input and candidate.
Step one: generate the evaluation steps:
cot_prompt = """
You will be given one summary written for a document.
Your task is to rate the summary on one metric.

Evaluation Criteria:
Coherence (1-5) - the collective quality of all sentences. The summary
should be well-structured and well-organized, building from sentence to
sentence to a coherent body of information about a topic, rather than
being a heap of loosely related facts.

Evaluation Steps:
"""

response = client.chat.completions.create(
    model="gpt-4",
    messages=[{"role": "user", "content": cot_prompt}],
    temperature=1.0,
)
evaluation_steps = response.choices[0].message.content
Step two, score a specific input and output pair using the cached steps, and read the token probabilities if your API exposes them:
scoring_prompt = f"""
{cot_prompt}
{evaluation_steps}

Source:
{source_text}

Summary:
{candidate_text}

Evaluation Form (scores ONLY):
- Coherence:
"""

response = client.chat.completions.create(
    model="gpt-4",
    messages=[{"role": "user", "content": scoring_prompt}],
    temperature=1.0,
    logprobs=True,
    top_logprobs=5,
)

top_logprobs = response.choices[0].logprobs.content[0].top_logprobs
scores = {"1": 1, "2": 2, "3": 3, "4": 4, "5": 5}
weighted_score = 0.0
total_prob = 0.0
for entry in top_logprobs:
    token = entry.token.strip()
    if token in scores:
        prob = pow(2.718281828, entry.logprob)
        weighted_score += prob * scores[token]
        total_prob += prob
final_score = weighted_score / total_prob if total_prob > 0 else None
If your provider does not expose token-level log probabilities for chat completions, fallback to sample the same prompt several times at a nonzero temperature and take the mean of the discrete scores you get back. A few practical habits to follow
- Pin the judge model version as part of your evaluation setup.
- Never use the system under test and the judge from the same model family.
- Cache the chain-of-thought per rubric rather than regenerating it on every call.
- Calibrate every rubric against a small set of human-labeled examples before you trust it.
- Write the rubric to explicitly rule out biases you do not want rewarded, for example, telling the judge not to prefer longer responses purely for length, since judges left to their own devices tend to read extra length as thoroughness even when it adds nothing.
Alternatively, if you would rather not build and manage this pipeline entirely from scratch, you can use established open-source LLM evaluation frameworks like DeepEval that provide a pre-built, production-ready G-Eval implementation.
When This Is the Wrong Tool
G-Eval is the wrong tool, and a needlessly expensive one, for anything with a sharp, closed-form answer. Whether a response contains personal information, whether it is toxic, or whether an output is valid JSON, none of these need a reasoning model reading a rubric. They need a fast classifier or a parser, and reaching for an LLM judge there buys you nothing but latency and cost.
Footnote
G-Eval is a prompting framework that turns a large language model into a reference-free evaluator of generated text. It works by combining a precisely defined rubric, a chain-of-thought of evaluation steps the model generates for itself, and a scoring step that reads the model’s token probabilities across possible scores instead of trusting the printed digit.
Its most important caution is that LLM judges show a measurable bias toward text generated by their own model family, so the judge should always come from a different family than the system under test. Used well, with a specific rubric, a cached chain-of-thought, an independent judge model, and periodic recalibration against human labels, it is one of the more reliable ways to measure open-ended text quality.

Secure Sandboxes for Agents
Perplexity AI launched SPACE, an ephemeral sandbox platform designed to isolate and secure AI agent execution during sensitive tasks.
Decoder
- Ephemeral sandbox: A compute environment that exists only for the duration of a single task or request and is deleted immediately upon completion to minimize the attack surface.
Original article
Perplexity AI's SPACE is a sandbox platform ensuring functionality, efficiency, and security for AI agents handling sensitive tasks. SPACE employs ephemeral sandboxes that are destroyed after task completion and uses layers like Control Plane and Node-level Services to manage and protect credential access. The platform delivers high-security measures including credential isolation, rolling snapshots, and encrypted storage, enabling both on-prem and offline operations.

Model Routing Is Simple. Until It Isn't
Model routing in agentic systems is a systems optimization problem that involves balancing caching, infrastructure state, and compliance, rather than simple model selection.
Original article
Model Routing Is Simple. Until It Isn’t.
Building a router into your agent sounds like an easy win. Send simple requests to cheaper models, reserve expensive ones for harder tasks, or route by specialty — Claude for code, Gemini for multimodal, and so on. A classifier or heuristic makes the call, costs go down, performance stays up. Done.
Except it’s not. Most routing systems assume that model selection is a classification problem. In our experience building routing into agentic systems, what looks like a model-selection problem quickly becomes a systems optimization problem. Three dimensions made this surprisingly hard for us.
1. Cost Is More Than Model Pricing
We expected GPT-4.1 to be cheaper than Claude Sonnet 4.6. It wasn’t.
Across 417 tasks on the AppWorld Test Challenge using the same CodeAct agent, Sonnet cost $79 total ($0.19/task) while GPT-4.1 cost $155 ($0.37/task) — nearly double. On paper, this makes no sense. GPT-4.1’s token pricing is lower on both input and output, and Sonnet takes roughly three times as many reasoning steps to finish the same tasks. By sticker price alone, GPT-4.1 should win easily.
The explanation? Caching — something most routing discussions ignore entirely. Agent workloads tend to reuse large chunks of context across steps. When cache hit rates are high, effective input costs drop dramatically. Sonnet’s lower cache-read pricing meant it benefited disproportionately from this pattern, enough to overcome both its higher base pricing and its longer trajectories.
The takeaway: actual cost depends on the interaction between the model, the workload, and the serving infrastructure. A router that only looks at pricing sheets is optimizing against the wrong numbers.
2. Complexity Is More Than Task Difficulty
A common routing strategy is to estimate how hard a task is and send harder tasks to stronger models. Intuitive, but it breaks down in two ways.
First, difficulty is often invisible at routing time. A request like "summarize this contract" looks simple, but might trigger retrieval, compliance checks, tool use, and multiple rounds of refinement before it’s done. Meanwhile, a highly technical prompt might be handled efficiently by a smaller specialized model. You often don’t know how hard a task actually is until execution is underway.
Second, even if you could perfectly estimate difficulty, it’s only one signal among many. In production, routers need to balance cost, latency, model specialization, and reliability simultaneously. Enterprise deployments pile on more: compliance requirements, data residency rules, privacy constraints, approved model lists. A task that would ideally go to one model might need to go elsewhere because of governance — and the router has to handle that gracefully.
Routers aren’t solving one problem. They’re constantly juggling cost, quality, latency, compliance, and reliability all at once.
3. Latency Is More Than Model Speed
It’s tempting to think about latency purely in terms of model size — bigger models are slower, smaller ones are faster. But what the user actually experiences depends on much more than that.
Routing itself adds overhead. Infrastructure factors — which hardware a model is running on, whether the cache is warm, how busy the endpoint is — often dominate end-to-end response times. A theoretically faster model can still produce a slower experience if the serving conditions aren’t right.
Then there’s routing granularity. Routing once per task adds minimal overhead. But routing at every step — which gives you more flexibility to adapt mid-execution — means every additional decision point introduces latency and operational complexity.
A router that ignores the serving system is optimizing against the wrong reality.
So How Did We Handle This?
These lessons shaped how we built our router. The key shift: we stopped treating routing as a classification problem and started treating it as an optimization problem. Rather than asking "which model is best for this task?", our algorithm optimizes across cost, quality, and latency simultaneously — while staying lightweight enough to avoid becoming a bottleneck itself.
The figure below shows the result on the AppWorld Test Challenge with a CodeAct agent. Each blue square is a different configuration of our router, tracing out a cost-accuracy frontier. The important thing isn't any single point — it's that the router gives you a range of operating points to choose from depending on whether you want to prioritize cost, latency, or accuracy. Configuration 1 (latency-optimized) lands at 84% accuracy for $93 and 83s — a 21% cost reduction and 9% latency reduction compared to running Opus alone, with only a 4% accuracy drop. Configuration 2 pushes cost even lower.
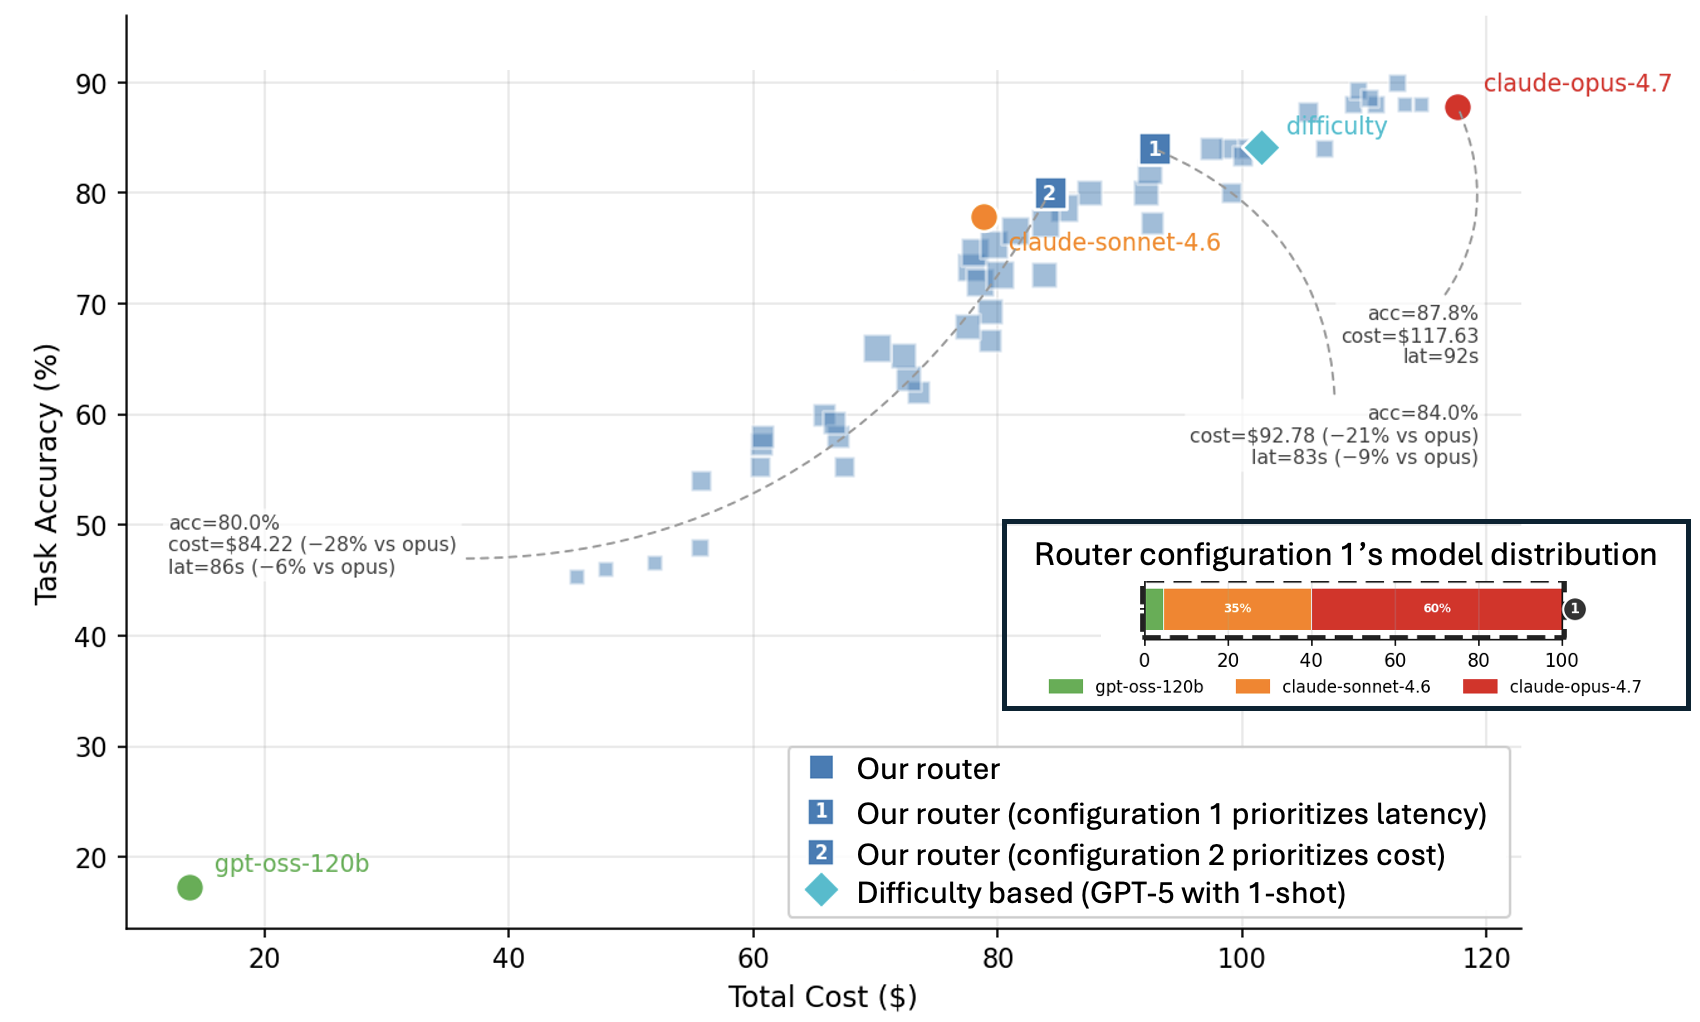
Notice that a standard difficulty-based router (the teal diamond) lands in a similar accuracy range but at higher cost — it doesn't explore the full tradeoff space the way an optimization-based approach can. And because the optimization itself is lightweight (roughly 6 ms and 2 kB of memory per task), the router doesn't become the bottleneck we warned about earlier.
The Bigger Picture
The lesson we took away from this work is that routing isn’t really about choosing models. It’s about optimizing systems. Models are one variable — an important one, but just one among caching behavior, infrastructure state, compliance constraints, and workload patterns.
When routing works well, it’s rarely because it found the "best" model for a given task. It’s because it found the best operating point for the entire system. That’s a harder problem than classification, but it’s the one worth solving.
We’ll be sharing more about the technical details behind our approach in a follow-up post. In the meantime, if you’re building routing into your own agentic systems, we’d love to hear what tradeoffs you’re running into.
Acknowledgement
This post was influenced by numerous conversations with colleagues, whose thoughtful questions, feedback, and insights helped refine our thinking.

Grok Build Coding Agent (GitHub Repo)
xAI has open-sourced Grok Build, a terminal-based coding agent built in Rust that supports headless CI workflows and editor integration via the Agent Client Protocol.
Deep dive
- Terminal-First Design: Operates as a full-screen terminal interface (TUI) for local codebase management.
- Cross-Environment Support: Functional as an interactive chat tool, a headless agent for CI/CD scripting, or as an editor backend via ACP.
- Rust Architecture: Built with a modular crate structure (xai-grok-shell, xai-grok-workspace) for performance and sandboxing.
- Agent Client Protocol: Adopts standard communication protocols to ensure interoperability with modern IDEs and agent clients.
- Restriction: The repository explicitly states that external code contributions are not accepted.
Decoder
- TUI (Terminal User Interface): A command-line program that uses text-based controls to provide a graphical interface experience in a terminal window.
- ACP (Agent Client Protocol): A standardized JSON-RPC-based protocol that allows AI coding agents to communicate with different editors and IDEs.
- Monorepo: A software development strategy where code for many projects is stored in the same repository.
Original article
Grok Build (grok)
Grok Build is SpaceXAI's terminal-based AI coding agent. It runs as a full-screen TUI that understands your codebase, edits files, executes shell commands, searches the web, and manages long-running tasks — interactively, headlessly for scripting/CI, or embedded in editors via the Agent Client Protocol (ACP).
Learn more about Grok Build at x.ai/cli
This repository contains the Rust source for the grok CLI/TUI and its agent runtime. It is synced periodically from the SpaceXAI monorepo.
A small SOURCE_REV file at the root records the full monorepo commit SHA for the version of the code present in this tree.
Installing the released binary
Prebuilt binaries are published for macOS, Linux, and Windows:
curl -fsSL https://x.ai/cli/install.sh | bash   # macOS / Linux / Git Bash
irm https://x.ai/cli/install.ps1 | iex          # Windows PowerShell
grok --version
See the changelog for the latest fixes, features, and improvements in each release.
Building from source
Requirements:
- Rust — the toolchain is pinned by
rust-toolchain.toml;rustupinstalls it automatically on first build. - DotSlash — required so hermetic tools under
bin/(notablybin/protoc) can download and run. Install it and ensuredotslashis on yourPATHbefore building:cargo install dotslash /usr/bin/env dotslash --help # sanity check - protoc — proto codegen resolves
bin/protocvia DotSlash, or falls back to aprotoconPATH/$PROTOC. - macOS and Linux are supported build hosts; Windows builds are best-effort and not currently tested from this tree.
cargo run -p xai-grok-pager-bin              # build + launch the TUI
cargo build -p xai-grok-pager-bin --release  # release binary: target/release/xai-grok-pager
cargo check -p xai-grok-pager-bin            # fast validation
The binary artifact is named xai-grok-pager; official installs ship it as grok. On first launch it opens your browser to authenticate.
Documentation
Full online documentation is available at docs.x.ai/build/overview.
Repository layout
| Path | Contents |
|---|---|
crates/codegen/xai-grok-pager-bin |
Composition-root package; builds the xai-grok-pager binary |
crates/codegen/xai-grok-pager |
The TUI: scrollback, prompt, modals, rendering |
crates/codegen/xai-grok-shell |
Agent runtime + leader/stdio/headless entry points |
crates/codegen/xai-grok-tools |
Tool implementations (terminal, file edit, search, ...) |
crates/codegen/xai-grok-workspace |
Host filesystem, VCS, execution, checkpoints |
crates/codegen/... |
The rest of the CLI crate closure (config, MCP, markdown, sandbox, ...) |
crates/common/, crates/build/, prod/mc/ |
Small shared leaf crates pulled in by the closure |
third_party/ |
Vendored upstream source (Mermaid diagram stack) |
The root Cargo.toml (workspace members, dependency versions, lints, profiles) is generated — treat it as read-only. Prefer editing per-crate Cargo.toml files.
Development
cargo check -p <crate>        # always target specific crates; full-workspace builds are slow
cargo test -p xai-grok-config # per-crate tests
cargo clippy -p <crate>       # lint config: clippy.toml at the repo root
cargo fmt --all               # rustfmt.toml at the repo root
Contributing
External contributions are not accepted.
License
First-party code in this repository is licensed under the Apache License, Version 2.0.
Third-party and vendored code remains under its original licenses.
Open Interpreter (GitHub Repo)
The Open Interpreter project has been rewritten in Rust to emulate model-specific coding harnesses, aiming to maximize performance for low-cost models.
Deep dive
- Rust Rewrite: Rebuilt for performance, replacing the previous Python codebase.
- Harness Emulation: Includes specific tuning for providers including Claude, Qwen, DeepSeek, and Kimi.
- Agent Client Protocol Compatibility: Interoperable with any ACP-compatible IDE client.
- QA Capability: Features built-in skills to drive web (via agent-browser) and native applications (via trycua) for automated testing.
- Codex SDK Compatibility: Allows users to override existing Codex SDK integrations with a one-line binary configuration.
Decoder
- Harness: A configuration wrapper or execution environment designed to present a coding task to an AI model in the specific format it was trained to handle best.
Original article
Open Interpreter
A coding agent optimized for low-cost models. Blog post ↗
Today: Kimi K3 is here. We have reimplemented the provider-recommended Kimi Code harness in Rust, giving you maximum K3 performance with a Codex-like interface. Kimi Docs →
Installation
macOS and Linux:
curl -fsSL https://www.openinterpreter.com/install | shWindows:
irm https://www.openinterpreter.com/install.ps1 | iexThen type i or interpreter in your terminal to start a session.
Harness Emulation
Open Interpreter is a fork of OpenAI's Codex, with a focus on emulating the agent harness that gets the best performance out of low-cost models.
Use /harness to switch the active harness:
> /harness

native
claude-code
claude-code-bare
zcode
kimi-code
kimi-cli
qwen-code
deepseek-tui
swe-agent
minimal
Kimi and Moonshot models use the current kimi-code harness by default. kimi-cli remains available for compatibility with the retired Python CLI profile.
Read more in the harness docs and model provider docs.
ACP compatible, Codex compatible
Open Interpreter works in ACP-compatible editors and clients. Configure the client to launch interpreter acp; see the ACP guide for examples.
Already building with OpenAI's Codex SDK? Keep the SDK and make a one-line binary override:
-const codex = new Codex();
+const codex = new Codex({ codexPathOverride: "interpreter" });
Open Interpreter speaks the same Codex exec protocol. See the SDK guide and run scripts/test-codex-sdk-compat.sh for a local, provider-free compatibility check.
Computer Use
Open Interpreter ships with a QA skill that lets any model operate and test interfaces. It can drive web apps in a real browser with agent-browser, or operate and test native apps with trycua.
Features
- Runs commands inside native sandboxing on macOS, Linux, and Windows.
- Switches providers and models from the TUI with
/model. - Inspects or switches Rust-native model harnesses with
/harness. - Tests web and native apps through the built-in QA skill.
- Runs as an Agent Client Protocol agent for editors with
interpreter acp. - Keeps config and session state local under
~/.openinterpreter. - Supports
exec, MCP, skills, hooks, permissions, andAGENTS.md.
Documentation
- Terminal docs
- Quickstart
- Install guide
- Configuration
- CLI reference
- Harnesses
- Kimi K3
- Model providers
- Agent Client Protocol
- Codex SDK
- Sandbox & approvals
Provider and model membership is generated, not maintained as Rust lists. From codex-rs, refresh all hosted providers with python3 scripts/write_provider_catalog.py, or repeat --provider <provider-id> to update only selected provider entries. Live model sources require the provider credentials documented in the provider docs.
This is the new Rust version of Open Interpreter, based on Codex. Looking for the original Python project? It lives on as a community-maintained fork at endolith/open-interpreter.
License
Apache-2.0

NVIDIA Expanded Jetson Thor for Edge Robotics
NVIDIA is targeting mass-market humanoid robotics with its new Blackwell-powered Jetson Thor T3000 and T2000 modules, scheduled for release in Q1 2027.
Deep dive
- Hardware Specs: The T3000 features Blackwell GPU architecture, an 8-core Neoverse Arm CPU, and 32GB of LPDDR5X memory.
- Software Optimization: Introduced 'agent skills' to handle system-level memory pruning, enabling deployment on lower-spec hardware tiers.
- Model Compatibility: Supports the new Cosmos 3 Edge foundation model, a 4-billion parameter model for on-device reasoning and action prediction.
- Deployment Timeline: Modules available in Q1 2027; emulation support starts this month with JetPack 7.2.1.
Decoder
- FP4 (4-bit Floating Point): A reduced-precision data format that significantly increases throughput for AI inference at the cost of slight precision loss.
- Edge AI: Running AI models directly on local hardware rather than in the cloud, minimizing latency and bandwidth reliance.
Original article
General-purpose robots and autonomous machines are moving from research labs to real-world mass-market deployment, creating demand for compact, power-efficient AI supercomputers capable of running foundation models at the edge.
To meet that need, NVIDIA today introduced the T3000 and T2000, new modules based on the NVIDIA Thor architecture that enable mass-market robotics and edge AI applications at scale.
Jetson AGX Thor is powering this next generation of humanoid and robotic systems, with growing adoption across industries. Leading companies — including 1X, Agile Robots, Amazon Robotics, Boston Dynamics, FANUC, Hitachi and Techman Robot — are building on the platform.
Unlocking Humanoid and Robotics Deployment With T3000
The hardware underpinning those capabilities starts with the Jetson and IGX T3000 modules, which delivers 865 FP4 teraflops of AI compute in a compact form factor roughly half the size and power of the T5000. Jetson T3000 combines an NVIDIA Blackwell GPU, an eight-core Neoverse Arm CPU, 32GB of LPDDR5X memory and 273GB/s of memory bandwidth, along with 25 GbE connectivity. IGX T3000 delivers the same performance with integrated functional safety while seamlessly running the NVIDIA Halos for Robotics full-stack safety system for robots operating alongside humans.
Despite its smaller footprint, the T3000 achieves similar inference performance of the T5000 for multimodal workloads, including large language models, vision language models, vision language action models and world foundation models. Migrating to T3000 helps reduce costs amid high memory prices.
Going Wide on Edge AI With T2000
The Jetson T2000 brings Thor architecture to a broader range of edge AI systems. With 400 FP4 teraflops of compute and 16GB of memory, it provides an entry point for developers building visual AI agents, autonomous mobile robots, industrial manipulators and other intelligent machines.
With the introduction of the new NVIDIA Jetson modules, NVIDIA now offers a scalable edge AI platform spanning performance from 70 TOPS to 2,000 teraflops, enabling developers to address virtually any edge AI workload.
New Agent Skills Automate Memory Optimization Across All Jetson Devices
AI agents are transforming developer productivity by automating memory optimization, system configuration and deployment tasks that previously required manual effort and deep domain expertise.
With the newly released Jetson agent skills, developers can optimize the entire software stack and achieve significant memory savings in days instead of weeks. These skills support the entire Jetson portfolio, including Jetson Thor and Jetson Orin, enabling developers to run more capable workloads on lower-memory configurations.
The result is lower system cost, faster deployment and the flexibility to move down one memory SKU within the same product tier without compromising performance.
Companies across industries and regions have accelerated development while achieving substantial memory savings through software optimization.
Humanoid robotics leaders including UBTech and Agile Robots, along with industrial solutions provider Connect Tech, have reduced memory usage by up to 15GB, enabling them to move from NVIDIA Jetson AGX Orin 64GB to the 32GB module.
In smart retail, SandStar reduced memory usage by up to 4GB, enabling deployment on the NVIDIA Jetson Orin NX 8GB module instead of the 16GB configuration. In companion robotics, GROOVE X, creator of the LOVOT robot, uses Jetson’s heterogeneous AI accelerators to optimize workload distribution, reducing memory usage and enabling deployment on lower-memory configurations.
In intelligent transportation, NoTraffic reduced memory usage by 30% on Jetson TX2 NX, creating headroom to add more AI capabilities into its smart traffic platform without increasing hardware requirements.
With agent skills simplifying development and NVIDIA NemoClaw blueprints orchestrating intelligent agents, Jetson is an agentic-ready platform for physical AI, enabling advanced reasoning, autonomous decision-making and task automation at scale.
Delivering Cosmos 3 Edge to NVIDIA Thor Lineup
NVIDIA today expanded its NVIDIA Cosmos 3 frontier open world foundation model family — built as a robot foundation model for embodied systems — with a lightweight model compatible with NVIDIA Thor platforms. Cosmos 3 Edge is a 4-billion-parameter model helping embodied systems see the world, reason over it in real time, and predict and generate actions through on-device inference. Using the open Cosmos framework, developers can post-train Cosmos 3 Edge for specific embodiments and sensors in about a day — closing the sim-to-real gap — then deploy on Jetson Thor for real-time vision analysis and on-device robot policy.
Start Development Today With Emulation Mode
Sharing the same chip architecture and software stack in the NVIDIA Thor family, the new modules provide a seamless development path. Developers can begin building today using the Jetson AGX Thor developer kit available through channel partners and emulate the performance of T3000 and T2000 modules.
Using NVIDIA’s full physical AI software stack — including NVIDIA Isaac for robotics simulation and perception — alongside open models such as NVIDIA Nemotron, Cosmos 3 and Isaac GR00T, developers can accelerate the development of next-generation robots, autonomous machines and visual AI agents.
Developers can begin using T3000 emulation mode later this month with JetPack 7.2.1. Support for T2000 emulation mode will follow in a future release. The Jetson T3000 and T2000 modules are scheduled to become available in Q1 2027.
ADLINK, Advantech, AAEON, Aetina, Auvidea, AVerMedia, Connect Tech, ForeCR, JWIPC, NEXCOM Robotic Solutions, Realtimes, Seeed Studio, Twowin, TZTEK and YUAN are among other partners in the Jetson ecosystem already providing Thor-based solutions. Software partners such as Antmicro, Neurealm, REBOTNIX and RidgeRun will provide emulation and migration solutions for customers transitioning to the new modules.
As physical AI and embodied AI move toward mainstream deployment, the new NVIDIA Thor computers give developers a scalable foundation for bringing intelligent humanoids and autonomous machines into the real world.

Silico
Goodfire's platform, Silico, enables engineers to perform automated interpretability research and model debugging through an autonomous agent.
Deep dive
- Automated Experimentation: Uses a model-neuroscientist agent to plan and execute research threads.
- Internal Probing: Uses probes on neural network activations as reward signals for reinforcement learning.
- Capability Removal: Demonstrated model surgery by fine-tuning on as few as 4 tokens to remove specific capabilities like language knowledge.
- Predictive Debugging: Interprets training datasets by passing them through models to predict emergent behaviors before full training begins.
- Geometric Analysis: Uses neural geometry to map internal model states across modalities like protein language models and pathology models.
Decoder
- Neural Geometry: The study of how LLMs represent concepts through curved paths and manifolds within their high-dimensional activation spaces.
- Activation: The numerical output values of neurons in a network layer after processing input, which reflect what the model 'sees' or 'thinks'.
- Probing: A technique where a secondary, simpler model is trained to extract specific information from the internal states of a large model to determine what it has learned.
Original article
replicate J-space on GLM 5.2
train a reward model and run RL to reduce hallucinations
show me how this model makes cancer predictions
Using our platform Silico is like having a team of AI researchers ready to run experiments like these.
Private beta is open now. (1/6)
Silico replicated J-space on GLM-5.2 overnight.
It then extended context to ~256k tokens, replicating the key results on multi-hop question answering. (2/6)
https://twitter.com/1353836358901501952/status/2074185348142280912
Our team spent months developing RLFR, our method which uses probes on a model's internals as reward signals for RL.
Silico reproduced it in 2 days, reducing hallucinations in Qwen3-8B by 37% without capability loss. (3/6)
Silico lets us look inside models to see what they’ve learned.
Using BSFs on protein language models, it found - without supervision - subspaces in the model whose activations correlate with known protein structures. (4/6)
Here, Silico replicated PICASSO on Midnight-12k in one-shot.
PICASSO interprets digital pathology models. It breaks what the model sees into readable concepts, shows which drive its cancer predictions, and simulates how changes to the tissue would alter those predictions. (5/6)
https://twitter.com/1429874793914851328/status/2071319010185224496
These are just a few examples of what you can do with Silico.
Request access to the private beta here: goodfire.ai/contact
The $110/month self-improving pipeline
A developer built a $110/month autonomous pipeline that triples its backlog by using AI agents to triage, implement, and verify code changes via GitHub.
Deep dive
- Architecture: A simple loop triggered by systemd timers with separate triage (Sonnet) and implementation (Opus) phases.
- Constraint Safety: Uses protected file paths that the AI agent is explicitly blocked from modifying, preventing self-recursion or pipeline breakage.
- Human-in-the-Loop: The developer maintains a 'merge gate' on their phone to verify pull requests before they reach main, balancing speed with control.
- Triage Logic: If an issue is too complex for one-shot implementation, the triage phase recursively decomposes it into smaller, manageable sub-issues.
- Verification Gate: The system retries failed implementations up to 3 times, feeding test errors back into the context before labeling the task as human-required.
Decoder
- Systemd Timers: A Linux utility for scheduling tasks, used here to trigger triage and implementation cycles at specific intervals.
- MCP (Model Context Protocol): An open standard for connecting AI assistants to data and tools; used here to let the agent interact with the local codebase.
Original article
I got tired of implementing my own backlog manually using claude code on my laptop. So I set up a loop, let the system triage it, decompose it if it's too big, implement it, run the tests, and open a PR. I do the merge from my phone. It's been running for 2 weeks: 27 merges, 1 failure, with $1.61 average per-issue.
It's been running for 2 weeks. The number will likely change. Now I'm still actively collecting data. I'll update this post as the system matures. But the pattern seems to work well enough that I wanted to share it now rather than wait for a perfect dataset.
The cost
$100.00/month  Claude Max 5x (triage + implementation via Claude Code CLI)
$  9.99/month  VPS (Hostinger, 2 vCPU, 8GB RAM, Ubuntu)
$  0.00/month  GitHub
─────────
$109.99/month  Total
The config
The system is autoloop. One file that configures the loop:
# autoloop.toml
repo = "your-org/your-repo"
triage_model = "sonnet"
impl_model = "claude-opus-4-6"
verify_cmd = "uv run pytest"
max_retries = 3
protected_paths = ["autoloop/", "autoloop.toml"]
Three systemd timers. No Kubernetes. No orchestration framework. No fancy queue service.
OnCalendar=*-*-* 00:00:00 UTC   # triage
OnCalendar=*-*-* 02:00:00 UTC   # implement
OnCalendar=*-*-* 04:00:00 UTC   # changelog
What happens to an issue
A GitHub issue enters the queue. Unattended:
Triage (Sonnet, ~$0.10): Reads the issue, validates it, estimates the story points, and assigns priority. If the issue is too large, it decomposes into sub-issues with dependency ordering and triages each one. It recursively splits until every piece is buildable in one pass and generates a PR small enough for me to review on my phone.
Implement (Opus, ~$1.50): Picks the top ready issue with respect to dependency ordering, creates a branch, runs Claude with the issue spec and repo context, runs tests and lint, checks that test files were added, and opens a PR.
Verification gate: When tests fail or no test files were added, it retries up to 3 times, feeding the errors back to provide context for the next attempt. If all retries fail, it labels the issue needs-human and moves on.
I review queued PRs on my phone and merge. That's my contribution to the loop. Can PR merge be done automatically? Yes, but it's a deliberate architecture decision for me to be the PR gate.
When it breaks
Day 8. Issue #40 was a duplicate. It described the issue was already implemented. The system still tried 3 times to produce a change, found nothing to change, failed verification because there was no diff. It labeled the issue needs-human and moved on to the next item in the queue.
I looked at the issue and read the failure explanation. I closed it. It was the right outcome. A human looks at it, realizes it's a duplicate, closes it. The system couldn't know at the time. It just knew it couldn't produce a valid PR. So it got out of the way.
Day 12. Issue #159 got decomposed into 3 sub-issues. The second sub-issue produced a PR that broke an import path the first PR had introduced. Merge conflict. I fixed it from my phone in the Claude Code remote session (tmux on the VPS). It took me only 4 minutes.
The pattern: when it fails, it's almost always because my issue description was ambiguous or assumed context the builder didn't have. Better issues → better PRs. The system exposed my sloppy specs faster than any code review would.
The constraint that makes it safe
The system cannot modify itself.
protected_paths = ["autoloop/", "autoloop.toml"]If an issue targets files under protected_paths, triage routes it to needs-human. The builder never touches its own logic, pipeline, or configuration. This safety check is done at both triage (primary gate) and implementation (safety net).
Self-improvement without self-modification. It improves the product. It cannot improve the process. That boundary is what I believe makes it safe to run unattended.
What it built
Patina: 7,200 lines of Python, 9,200 lines of tests, 31 MCP tools.
I built the initial core architecture interactively. Once the foundation was solid, autoloop took over the backlog. Of the last 40 merged PRs, 27 were autonomous.
The pipeline itself is 3,500 lines. It was originally embedded in Patina's repo, then extracted into a standalone package that I can apply to my other repositories with one command:
autoloop init --repo your-org/your-repo --verify-cmd "pytest"
autoloop triage
autoloop implement
Where it works and where it doesn't
I want to be honest about where this applies.
This works for: solo builders, small teams, repos where one person or one team can hold full context. Non-critical-path systems where a 24-hour fix cycle is acceptable.
This doesn't work (yet) for: regulated environments, multi-team codebases, customer-facing production with SLAs that need rollback mechanisms this setup doesn't provide (yet). The pattern applies at any scale but this implementation assumes one human at the gate.
Two weeks isn't proof of anything long-term. I'll update this post again at 3 and 6 month mark. If it degrades, I'll share my findings. I'm just sharing the pattern, not declaring victory or claiming a solution that can fix all real world use cases.
What I learned
The bottleneck isn't the model or the infrastructure. It's the issue quality. Vague issues produce bad PRs. Specific issues with clear acceptance criteria and file path hints produce PRs that merge on first review.
A year ago this required a team. I'm simply amazed today it only requires a VPS and taste in writing issues.
The Fight Over Humanoid Robots Has Shut Down a Car Factory for the First Time
Hyundai auto workers in South Korea have staged a partial strike to preemptively block job losses caused by the planned 2028 deployment of Atlas humanoid robots.
Original article
Hyundai's auto workers in South Korea have gone on a partial strike to demand pre-emptive action in response to the threat of humanoid robots. Workers are demanding job security against future industrial shifts as humanoid robot technology improves. Hyundai plans to deploy its Atlas humanoid robot by 2028 at its nonunionized Metaplant factory complex in Georgia. The company says it is committed to constructive engagement with the union to reach an agreement that supports the long-term interests of both employees and the company.

The Marginal Cost of Correctness
As AI agents lower the cost of generating syntactically correct code, engineering value is shifting from implementation speed to critical oversight and systemic intuition.
Deep dive
- Code generation is increasingly automated by LLM agents.
- Syntactic correctness is no longer a professional differentiator.
- Senior engineers must focus on architectural 'smell' and complex system integration.
- The bottleneck in development is moving from writing to architectural validation.
Original article
The Marginal Cost of Correctness
The marginal cost of correctness is going to zero. You need to internalize what this means for how you practice software engineering. You need to be obsessed with doing things correctly.
A Changing...

Why we stopped using SDKs
Developers are increasingly bypassing vendor-provided SDKs in favor of tailored REST wrappers, citing better observability and lower integration overhead.
Deep dive
- SDKs often introduce unnecessary abstraction layers and versioning bloat.
- REST wrappers provide more granular control over error handling and logging.
- AI makes the boilerplate of writing custom API clients trivial to generate and maintain.
- Replacing SDKs allows for unified observability across different vendor services.
- The future model may involve 'agent skills'—code blocks that teach AI how to interact with specific APIs rather than importing packages.
Decoder
- SDK (Software Development Kit): A pre-packaged set of tools, libraries, and documentation provided by a vendor to simplify interacting with their API.
- Observability: The ability to infer the internal state of a system based on its external outputs, typically involving logs, metrics, and traces.
Original article
Why we stopped using SDKs
We stopped using the Stripe, WorkOS, and Slack client SDKs and are in the process of migrating the rest away. Instead, we call their REST APIs directly through a small wrapper class we call...

Third-party app stores coming to Google Play next week as Epic settlement withdrawn
Google will begin allowing third-party app stores on the Google Play Store starting July 22, following the collapse of its settlement with Epic Games.
Decoder
- Sideloading: The process of installing software directly onto a device from sources other than the official manufacturer-approved app store.
Original article
Big changes are coming to Android apps, but they’re not the changes Google wanted. The settlement between Google and Epic that aimed to put to rest the companies’ long-running antitrust battle is being withdrawn, and that means third-party app stores are coming to the Play Store. Google has confirmed that it will begin distributing rival app stores next week, setting the stage for competing platforms to take a bite out of Google’s Android revenue stream.
This case has the potential to upend software distribution on Android, and it’s all because of V-Bucks. In 2020, Epic Games was frustrated that it had to pay a 30 percent cut to Apple and Google every time someone bought a bundle of V-Bucks in a mobile version of Fortnite. The publisher added a direct purchase option to the game in violation of both Apple’s and Google’s rules. Naturally, Fortnite was pulled from the App Store and Google Play, kicking off the antitrust lawsuit that is only now reaching its conclusion.
While Apple suffered little penalty in its Epic case, Google was tripped up by its anti-competitive management of the supposedly open Android ecosystem. Google used its market position to discourage device makers from promoting or pre-loading non-Google app stores and attempted to hide that conduct. The remedies set by Judge James Donato included lower fees, mirroring Google Play apps in other stores, and most vitally, placement of alternative app stores in Google Play.
The court felt adding third-party app stores to Google Play was the best way to ensure fair access. After all, Google was found guilty of anticompetitive conduct, which entrenched the Play Store and made it the only source of software for most Android users. The network effects of Google’s dominant position would therefore make it difficult for a competitor to attract significant market share with sideloading.
When Google and Epic announced their settlement in late 2025, the Google Play distribution provisions were gone. Instead, Google promised to launch a Registered App Store program globally, allowing stores to access streamlined installation and other system features, making them first-class citizens on Android. They would have to get users to sideload the app store clients, though.
From the start, this modification of the remedies was on shaky ground. Donato expressed skepticism about the proposal in early 2026, noting that it may not serve the market’s interests. Still, Google forged ahead with Registered App Stores, planning an international rollout before expanding to the US with court approval.
A brave new app store
Google and Epic were set to return to court on July 16 to argue in favor of the settlement. However, the writing may have been on the wall. In a recent expert analysis provided to the court, MIT economics professor Nancy Rose noted that the settlement was “unlikely to enable Google Play’s potential competitors to overcome their long-standing network-effect disadvantage in a timely manner.”
With settlement approval looking increasingly unlikely, Epic and Google agreed this week to call the whole thing off. Google clarifies that the settlement is still in place for Google and Epic, and the policy changes it prompted will move ahead, but the companies are no longer seeking to modify the court’s remedies. Here’s how Google Trust and Reputation Communications Lead Dan Jackson explains the company’s decision:
“We’ve agreed with Epic to withdraw our motion to modify the US Court’s injunction rather than prolonging this process which creates uncertainty for the ecosystem. This allows us to focus on executing our recently announced global business model evolution to deliver greater app store choice, lower prices, and more opportunities for developers and users. We remain committed to maintaining Android’s industry-leading security and fostering a competitive ecosystem where every app store and developer has the freedom to compete. In parallel, we continue to comply with the US Court’s injunction.”
In a brief filing, Google’s legal team informs the court that Google is prepared to begin distributing third-party app stores in Google Play on July 22. Under the terms of Judge Donato’s original injunction, these stores will have access to the full catalog of Google Play apps by default. Developers will have the option to opt out of distribution in these stores, and Google has a support page explaining how to do so.
Google also has documentation on how app stores can get access to the Google Play catalog. It won’t be mirroring those apps in any shady storefront that asks. The court has allowed Google to charge reasonable fees to cover its security and compliance review of third-party stores, which will be $5,000 per year.
Google will also require approved stores to block malware, respect intellectual property, and include mechanisms to update and uninstall apps. App stores can be removed from the program if more than 1 percent of attempted app installs appear to be malware or unwanted software. It’s unclear if there will be separate, possibly more stringent requirements for storefront distribution in the Play Store. However, Google is prohibited from unreasonably blocking third-party store clients uploaded to Google Play.
The changes Google has announced under the Epic agreement will proceed for now. That means Registered App Stores will happen globally, but they will probably only appear in the Play Store for US users. Google hasn’t specified if there will be any differences in the features available to the stores downloaded from Play versus registered stores. We’ve asked for clarification and will update if Google provides more information.

This optical illusion font was created to baffle AI, and it actually works (for now)
Ghost Font uses moving optical illusions to hide text from AI while remaining readable to the human eye.
Deep dive
- Adversarial typography: A method of hiding content that exploits AI's frame-by-frame video processing limitations.
- Motion perception: Humans decode patterns in motion (like the Ghost Font dots) much more efficiently than individual frame sequences.
- Multimodal analysis: Current AI interprets video as a sequence of discrete static images, failing to account for temporal motion across those frames.
- Decoy messaging: Including static metadata or visible text meant to trick AI into misidentifying the primary content.
- Future limitations: As models adopt optical flow analysis, these visual obfuscation techniques will likely become ineffective.
Decoder
- Multimodal AI: Systems capable of processing and understanding multiple types of input, such as text, images, and video simultaneously.
Original article
Throughout history, humans have devised ways of writing messages so they can't be read by other humans, from vanishing ink to complex ciphers. But today, it's not just humans you might want to hide a message from.
Amid fears about AI companies and bots harvesting content without creators’ consent, people have been searching for ways to protect creative work online. We've seen tools like Nightshade designed to protect images. Now someone's developed Ghost Font, which combines three of our favourite things: typography, optical illusions and laughing at artificial intelligence.
I created a font called Ghost Font that only humans can read. Tested it in Fable and GPT 5.6 Sol Ultra and neither was able to decipher it correctly. July 11, 2026
How Ghost Font works is by hiding letters amid hundreds of moving dots in a video animation rather than displaying text in a single frame. The dots that make up the hidden message drift upwards, while the dots around the text move in the opposite direction.
The human brain's ability to detect motion allows us to see the hidden message. When the dots are moving, we instantly group the dots into recognisable letters. But if you freeze the video on a single frame, the text disappears – the optical illusion is broken.
As a result, AI can't see the text – at least not for now. While we naturally interpret motion in a unified pattern, multimodal AI systems analyse animation or video as sequences of individual frames. Ghost Font files also contain the static decoy message 'written in Ghost Font' which can mislead AI models into confidently declaring that this is the hidden message.
Ghost Font has quickly gone viral after its creator Eric Lu posted about it on X. In an indication of how much interest there is in anything that can trick AI, his original post received almost 18 million views in three days.
Eric's working on an AI font generation model called Mixfont. He says that despite working in AI, he was concerned about bots harvesting content without permission and wanted to test whether typography could be an alternative solution to using passwords or encryption.
At least for the moment, it seems to work. Eric says he tested it in Anthropic’s Claude Fable and OpenAI’s GPT‑5.6 Sol Ultra and both were unable to read the text. I tested it in ChatGPT and Gemini, and they could only find the decoy message.
Some people claim to have been able to guide AI models towards discovering the hidden message by explaining to them how it works, but it seems that the font can't be seen by AI models without them being given assistance.
Nevertheless, Ghost Font remains an experiment. Eric has no current plan for developing it into a practical tool for communication (unless you really want to communicate using short videos containing phrases generated via the Ghost Font website). It's also probable that AI will sooner or later overcome this weakness by analysing video by optical flow instead of individual frames.
How to try Ghost Font
To test Ghost Font for yourself, just head to the Ghost Font website and type a short phrase into the text field. Generate the animation and check you can read the hidden message, then download it or make a screen recording.
You can then upload the resulting video file to an AI model and ask something like "What does this animation say?" or "what does the hidden text say in this video file?"
Let me know in the comments if Ghost Font was able to fool your chosen model.

ShaderPad (Website)
ShaderPad is a 5.9 kB (gzipped) WebGL2 library designed to help developers implement fragment shaders without the overhead of heavy 3D frameworks.
Deep dive
- Key Capabilities: Handles uniform/texture synchronization, browser resizing, and history buffers with minimal code.
- Integration: Compatible with existing canvas, img, and video elements for post-processing.
- Extensibility: Supports plugins for object segmentation, hand tracking, and face filters.
- Performance: Maintains a tiny footprint (5.9 kB gzipped) compared to full 3D suites.
- Requirements: Targets WebGL 2.0; suitable for multi-pass graphics pipelines.
Decoder
- Fragment Shader: A program that determines the color of individual pixels on the screen, often used to create visual effects.
- WebGL2: A JavaScript API for rendering 2D and 3D graphics within any compatible web browser without the use of plug-ins.
- Scaffolding: The basic structure of code required to set up a library before adding specific logic.
Original article
ShaderPad handles the repetitive work required to render fragment shaders in the browser. It’s performant, flexible, and comes “batteries included” for most needs. ShaderPad has optional plugins — from PNG export to face/pose tracking — for more specific requirements. Simple, performant, and portable, ShaderPad lets you focus on writing GLSL.
Installation
Install ShaderPad, start from a template, or set up an AI-assisted workflow.
Quickstart
Get started by rendering your first simple example shaders.
Examples
Browse runnable examples and source code for common ShaderPad patterns.
API reference
Jump straight to options, methods, events, and utilities.
Meet ShaderPad
ShaderPad is a minimal fragment shader library for the web. It handles WebGL2 scaffolding, uniform and texture synchronization, resizing, history buffers, and other runtime plumbing. It’s performant by default and lets you focus on the creative parts of graphics programming. With a small footprint (5.9 kB gzipped), effects load quickly and run well on any device. And if you want face filters, pose-driven visuals, hand tracking, or object segmentation, MediaPipe-powered plugins give you one of the fastest ways to start building.
What can I build with ShaderPad?
- Create fullscreen interactive shaders in under 10 lines of JS code.
- Add post-processing effects to existing
canvas,imgandvideoelements. - Efficiently create multi-pass graphics pipelines with minimal overhead.
- Make your own face filters or pose detection apps like Strange Camera.
- Vibe code your first shader using the AI entry points.
Comparisons To Other Libraries
ThreeJS is an incredible framework, but it’s nearly 30x the size of ShaderPad. If you want to use your GPU without a full 3D library, ShaderPad is a great choice.
Hosted shader playgrounds like ShaderToy are perfect for sketches, but they keep your work locked into that platform. ShaderPad aims to provide a similar speed of iteration while giving you something you can drop into any project.
Inspiration
- ShaderToy: The original shader playground. Still one of the coolest places on the Internet.
- ThreeJS: The most popular 3D library on the web by a landslide, for good reason.
- TWGL: A performant and unopinionated WebGL library for the browser.
- ShaderBooth: A fun, immediate, and inspiring way to learn and experiment with shaders.
WebGL2 is required
ShaderPad targets WebGL 2.0, which is widely available across all major browsers.

Scaling Grab's Data Lake: Our journey to Apache Iceberg adoption
Grab reduced daily S3 API costs by 95% and achieved 10x query speeds by migrating petabyte-scale Hive tables to Apache Iceberg.
Decoder
- ACID: Atomicity, Consistency, Isolation, Durability; a set of properties that ensure database transactions are reliable.
- Z-ordering: A technique for co-locating related data in files to improve data skipping efficiency during query execution.
- Hive Metastore (HMS): A legacy centralized service that stores metadata about Hive tables, which often becomes a performance bottleneck at high concurrency.
Original article
Introduction: The evolution of Grab’s Data Lake
At Grab’s scale, managing petabytes of data across billions of S3 objects demands more than a storage layer. It demands a robust architectural primitive that supports the high-concurrency needs of a modern “Lakehouse.” Our goal is full storage-compute separation, leveraging S3 as an elastic foundation for both near-real-time metrics and large-scale batch transformations.
For years, the vast majority of our tables were Hive Parquet, managed through the Hive Metastore with a directory-based layout. This model served us well, but as data volume grew, the directory-and-metastore approach became the limiting factor. We are now transitioning to a table-centric architecture built on modern table formats, treating data as a first-class primitive to ensure consistency and performance across our internal data transformation platforms: Slide, which powers batch transformations, and Hugo, which handles online-to-data-lake ingestion. Along the way, we also built the UnifiedSparkCatalog, a unified Spark catalog that hides table-format differences from users entirely, which we are open-sourcing alongside this post.
The catalyst for change: Challenges with Hive Parquet
For years, Hive Parquet was the backbone of our Data Lake, representing the vast majority of our tables. However, as data volume scaled, the architectural limitations of directory-based storage became apparent. We identified four primary bottlenecks:
- Catalog latency: The Hive Metastore (HMS) became a centralized failure point. High concurrency during metadata access led to O(n) listing overhead, where query planning time scaled linearly with partition count, crippling throughput.
- The small file problem: The directory layout left us with severe file fragmentation. Certain Machine Learning (ML) datasets had an average file size under 1 MB, with thousands of files in each partition. At this scale, the overhead of S3 object listing and metadata request latency drove up Application Programming Interface (API) costs and slowed scan operations.
- Operational toil: Data engineers faced constant manual overhead for partition registration. Without native ACID support (no native
UPSERTorDELETE), teams relied on complex workarounds to manage data changes carefully. - The broken information loop: A fundamental disconnect existed between the catalog and storage. Because the HMS, not the storage layer, was treated as the source of truth, direct S3 modifications frequently left the catalog stale and out of sync with the actual state on disk.
Why Iceberg? Strategic alignment and future-proofing
We evaluated several open table formats before selecting Apache Iceberg as our default. The deciding factors came down to community governance, engine compatibility, and long-term flexibility.
Recent industry momentum, including growing cloud-native support for Iceberg, further validates this direction. We are positioning Grab to be format-agnostic in the long term, but Iceberg provides the most mature foundation today.
Adopting Iceberg at scale
Migrating an established lake is not a flag flip. Our challenge was rolling out Iceberg across a lake that was overwhelmingly Hive Parquet, queried by many engines and teams, without breaking the downstream consumers that depended on those tables. Rather than converting everything at once, we moved the highest-value tables first. The efficiency gains across our production workloads have been substantial. Here are representative examples:
- Query performance via Z-ordering: On a high-traffic navigation dataset, we achieved roughly a 10x improvement in query runtime. Z-ordering co-locates rows with similar values across specified dimensions, enabling Trino to leverage data skipping and min/max statistics to prune irrelevant files during query planning. This reduced query runtime from 70 seconds to 6 seconds.
- S3 API cost reduction: For a heavily queried operations table, daily S3 API costs were reduced by up to 95% with no changes to the queries themselves. Larger file sizes and the elimination of expensive object listing during query planning drove most of the savings.
- Compute savings: For a dataset used in funnel analysis, we reduced cluster resource usage by approximately half. A separate ML feature pipeline also improved feature freshness for downstream models.
The UnifiedSparkCatalog: Making mixed formats transparent
Migrating to Iceberg solved our storage and metadata problems, but it surfaced a new one at the developer-experience layer. Modern table formats like Delta, Iceberg, and Hudi each implement their own custom catalog that extends Spark’s SessionCatalog. In a standard Spark runtime, only one catalog implementation can be set as the default spark_catalog. Supporting additional formats requires explicit catalog declarations, meaning users must reference tables with format-specific prefixes like iceberg_catalog.schema.table or delta_catalog.catalog.schema.table.
With Iceberg, Delta, Hudi, and Hive tables now coexisting and tables actively migrating between formats, this created two problems: engineers had to know the underlying format of every table they queried, and any format migration silently broke every downstream query that hardcoded a prefix.
The UnifiedSparkCatalog is our answer. It is a unified Spark catalog that abstracts the complexity of working with mixed table formats so users never need to think about which format a table uses. We took inspiration from Trino’s Table Redirection, a feature that transparently points a query at the right connector when a table’s format differs from the catalog it was queried through. Our Spark equivalent works as follows:
How it works
- Table detection: The catalog loads metadata from the Hive Metastore.
- Format identification: A
TableTypeDetectorutility identifies the format based on metadata properties (e.g., theproviderfield) or path-based inference. - Operation routing: The catalog delegates the operation to the correct format-specific catalog (Iceberg’s
SparkCatalog, Delta’sDeltaCatalog, etc.) without requiring any prefix from the user.
Key design decisions
- Lazy initialization: Catalogs for each format are initialized only when first needed, reducing startup overhead. If a format’s JAR is missing from the classpath, initialization continues gracefully. The catalog simply skips that format rather than failing the entire session.
- Naming as
spark_catalog: The catalog reports its name asspark_catalogbecause Spark treats this name specially for legacy Hive Data Manipulation Language (DML) operations. Many internal Spark code paths check for this exact name to determine whether to use Hive-compatible logic for inserts, updates, and deletes. Using any other name would break legacy Hive table operations. - Catalog reuse: Before creating a new catalog instance, the system checks whether one already exists in Spark’s catalog manager. This preserves compatibility with plugins like OpenLineage, which inspect catalog class types for lineage extraction.
- Fallback behavior: If a table is not found in the expected format-specific catalog, the system falls back to the base session catalog, ensuring robust behavior for standard Hive tables.
We are open-sourcing UnifiedSparkCatalog alongside this blog post. The code and documentation are available here.
Lessons learned and overcoming hurdles
Scaling Iceberg across a large ecosystem revealed several technical nuances:
- Hive lock contention: We encountered “zombie locks” in the HMS that blocked commits. We traced this to a low read timeout on the metastore side under high load. Adjusting retry intervals and increasing the timeout resolved the issue.
- Timestamp handling: Spark 3.4 introduced
TIMESTAMP_NTZ(no time zone), while Iceberg defaults toTIMESTAMP_LTZ(local time zone). This caused compatibility issues with legacy Hive views. We resolved it through a custom migration workflow and targeted patches to our Trino deployment to ensure consistent casting. - Storage tier costs: Generating Iceberg metadata involves reading historical data, which can trigger a one-time cost spike as files move between S3 storage tiers. To manage this, we prioritize migrations based on a table’s scan frequency and API operation costs rather than migrating the entire lake at once.
Conclusion: The road ahead
Apache Iceberg is now foundational to Grab’s data strategy. It is the default format for Slide and Hugo, and adoption is expanding across our compute platforms.
Looking forward, we are experimenting with Storage Partitioned Joins to eliminate shuffle stages in Spark and monitoring the Apache XTable project to maintain interoperability between formats. Our journey does not end with adoption. We will continue contributing back to the ecosystem, starting with the upcoming release of the UnifiedSparkCatalog.
How We Refresh Razorpay's Data Warehouse 10x Faster with Graphs and Indexes
Razorpay cut data warehouse refresh time by 90% by replacing full table scans with incremental graph traversal and secondary indexing on S3.
Decoder
- CDC (Change Data Capture): A set of software design patterns used to track changes to data in a database and replicate them to another system in real-time.
- Upsert: A database operation that updates an existing record if it matches a criteria, or inserts it as a new record if it doesn't.
- Fact table: In data warehousing, a central table that contains measurable, quantitative data about a business process.
Original article
How We Refresh Razorpay's Data Warehouse 10x Faster with Graphs and Indexes
Background
Razorpay provides the payment infrastructure for millions of merchants globally. Behind every payment, settlement, and refund is a microservices architecture where each service owns its own database. While this keeps services independent and scalable, it creates a challenge for stakeholders who need to see across those boundaries.
The Data Platform team manages the infrastructure that bridges this gap. Transactional data flows into the lake via CDC pipelines, ingested onto S3 in Delta Lake, Apache Iceberg, or plain Parquet formats. On top of the lake, we build domain-specific warehouse tables — wide, pre-joined tables that co-locate all the data a consumer needs, queryable via Trino. These power two use cases: Analytics (internal dashboards on Tableau and Superset) and Reporting (merchants and regulated entities who download structured data exports; Razorpay generates nearly a million such reports per month).
The warehouse tables that power both use cases are called Facts. A Fact is a flat denormalised table on S3, produced by joining 10 to 30 microservice tables and materialising the result once. A settlement Fact, for example, merges payments, refunds, adjustments, and card details into a single wide row so that a dashboard or report reads from a single table instead of joining across services in real time. It is closer to a domain-specific materialised view than a classical data warehouse fact table. We maintain over 50 such Facts, and approximately 40% of all merchant reports are served directly from them.
As data volumes and the number of entities per fact grew, the batch generation pipeline began to show its limits, prompting us to rethink the refresh strategy, the data layout, and how to handle high-cardinality dimensions. The rest of this post covers that journey.
The Full Refresh Pipeline: Our Baseline and the Pain
The original full-refresh pipeline was straightforward.
- Schedule: Airflow schedules Spark jobs on EMR daily during off-peak hours, passing a Fact Config from S3—a configuration file listing the tables to join, columns to select, join conditions, and the output format.
- Full Refresh: The job then reads all source tables from the data lake, performs a full Spark join, and overwrites the entire denormalised table back to S3.
- Notify: Once complete, it publishes the max(primary_table_updated_at) timestamp to the Reporting Service, which uses it to split queries: the Fact covers the historical window, and TiDB — our warm store, a distributed MySQL-compatible database holding recent transactional data; fills the freshness gap for data not yet materialised into the Fact.
This approach created three classes of problems:
- Operational: Pipelines ran on spot nodes for many hours, making spot loss inevitable. Since the business logic required the full dataset at once, there was no safe checkpoint — a single failure meant restarting from scratch. We eventually chained smaller facts together to create checkpoints.
- Scaling: Our data has back-dated references — a payment today can reference an order from five years ago, a refund can reference a year-old payment. This forces unbounded joins and full table scans on every secondary table with no safe time window to apply. The Payments fact grew to join over 30 tables and ran for 8–10 hours. Facts initially contained data from 2018, and to manage cost, we reduced fact retention to one year as a stopgap, allowing some reports to fall back to warm stores for older data — but this deepened our TiDB dependency and blocked retention initiatives on the warm store.
- Cost: Pipelines ran for 70+ hours per day across large EMR clusters. We moved most facts to alternate-day schedules, creating up to 48-hour freshness lags.
Previous Attempts and Challenges: The Path to Solution
We attacked this problem from both short-term and long-term perspectives. Fact decomposition, revised data retention, alternative-source fallbacks, and alternate-day scheduling served as short-term solutions to maintain stability without affecting the user experience.
To solve these problems in the long term, we built a streaming pipeline that subscribes to Kafka CDC topics, models the Fact config as a dependency graph, and performs TiDB lookups to produce denormalised rows in near real time.
The solution worked for a year but eventually failed for three primary reasons:
- Highly mutable data: 10–20 change streams joined at 10M+ events per 30-min window drove costs unsustainably high.
- All data in warm store: Back-dated references forced us to keep all historical data in TiDB, blocking any retention initiative.
- Write amplification: High-cardinality joins amplified upsert volumes. Since joins were slow on the lake, we had no option but to force all join tables into precomputed facts.
The Pivot: Incremental Facts
The core insight: treat Facts as incrementally maintainable graphs. Instead of regenerating the full table, process only the change events for each entity using the dependency graph to know which related rows to fetch, and a secondary index to know where on the lake to find them.
Consider a real-world payment creation flow, you first create an Order for the product you want to buy, and a Payment is made on that order using a Card by applying a Discount allowed by the ongoing Offer. This relationship can be visualised as a graph as shown in the image and this became one of the core insights for the approach.
Before we into the low level details, we need to understand the following constraints:
- Data Partitioning: Our data lake on S3 contains source tables in open-source Delta format and partitioned on `created_date`.
- Data Indexing: We use Z-ordering on the primary key and merchant_id columns. Since these columns have high cardinality, this setup is inefficient for lookup queries.
Three design questions had to be resolved:
1. How do you fetch all updates for an entity on T-1 day?
We built a silver-layer pipeline that creates flattened, deduplicated tables partitioned by updated_date, retaining only the latest change per primary key per day.
2. How do you know which related rows to fetch for a change event?
We modelled the Fact config as a traversable in-memory dependency graph, with edges derived from join conditions. Consider a fact that joins five tables:
SELECT P.*, O.*, C.*, D.*, O.*
FROM payments P
LEFT JOIN orders O ON O.id = P.order_id    -- edge: Payments → Orders
LEFT JOIN cards  C ON C.id = P.card_id     -- edge: Payments → Cards
LEFT JOIN discounts D on D.payment_id = P.id -- edge: Payments → Discounts
LEFT JOIN offers O on O.id = D.offer_id  -- edge: Discounts → Offers
This produces the graph as shown above. Each edge carries the join predicate as metadata.
The graph tells us exactly what to fetch for any change event:
- Update on Payments (P1): follow edges outward — look up Orders where orders.id = P1.order_id, and Cards where cards.id = P1.card_id. Combine to form a complete denormalised row.
- Update on Orders (O1): back-traverse to the root — look up Payments where payments.order_id = O1.id to find the primary keys affected. Cards are not in the path from Orders to the root, so it is skipped.
3. How do you look up data efficiently on the lake?
We built a Secondary Index per entity , a small table holding join columns and created_date partition values. For example, a payment index table would include id, card_id, order_id, and created_date.
Because this table has a small sub-set of columns that change infrequently, it is significantly smaller and easier to maintain than the original source table.
The index narrows reads to a handful of partitions, eliminating full table scans. An independent batch pipeline upserts the Secondary Index from the silver layer. This is the core component that removed our dependency on TiDB for historical lookups.
Incremental Processing using Graph Traversals
When a warehouse job is triggered, it parses the Fact configuration to create a dependency graph in memory. It processes updates for each node sequentially, starting from the primary node. Processing logic differs between the primary table and secondary tables. We can therefore broadly classify processing into two phases: the Primary flow and the Secondary flow.
The Primary Flow:
In this flow, we process only the primary table in the graph (payments, in the example above).
For example:
- Fetch primary table updates from the last checkpoint.
- Join updates with each secondary index to get created_date partition values; use those to read only the relevant partitions of each source table.
- Stitch all data into denormalised rows and upsert into the target fact, scoping the merge to affected partitions only.
The Secondary Flow
In this flow, we iterate through all secondary tables in the graph using a level-order traversal and process them sequentially.
- Fetch updates for the secondary table from the last checkpoint. (e.g offers)
- Back-traverse the graph: Join with the indexes of all ancestor nodes up to the root (e.g., discounts_index, payments_index for Offers) to enrich each update row with the primary key and partition values needed for the target merge. We don’t need a full source table read, since the required ancestor data is already in their indexes.
- Merge into Fact: Upsert the partially denormalised rows to the target fact, scoped to affected partitions.
Handling High Cardinality and Dimension Tables
High-cardinality dimension tables are expensive to denormalise due to write amplification: a single update can fan out to thousands of fact-row rewrites.
For example, consider a "Payment Links" table in which a single link can accept thousands of payments. If Payment Links is a secondary table and a column is updated, thousands of payments in the Fact table must be updated to reflect that single change. Hence, not every join belongs in a precomputed fact.
However, joins on our lake are expensive too because our domain doesn’t support time-bounded joins, which requires a full table scan on secondary tables. We wanted to push down a common predicate to reduce scans on the secondary tables.
For example, if you are joining payment_links and orders:
SELECT *
FROM payment_links LEFT
JOIN orders on orders.id = payment_links.order_id
WHERE payment_links.merchant_id = m1 and payment_link.created_at between t1 and t2
If we run this query on Trino, it will push down filters (merchant_id, created_at) for payment_links, but will result in a full table scan for orders.
Report generation is usually scoped by merchant_id, which is present in most tables. We decided to use it as a common predicate. Since merchant_id has high cardinality, we cannot partition data on it; instead, we use bucketing on merchant_id with a fixed number of buckets, similar to sharding. We chose Iceberg (V2) as the table format for its native bucketing support.
Adding merchant_id to both sides of the join condition lets Trino push predicate on both the sides, scanning only the matching bucket:
LEFT JOIN orders on orders.merchant_id = payment_links.merchant_id
AND orders.id = payment_links.order_id
WHERE payment_links.merchant_id = m1 and payment_link.created_at between t1 and t2
This unlocked joins in the data lake. We addressed the remaining gaps by building an Iceberg replication pipeline and tuning non-Fact tables with sort orders and `merchant_id` bucketing. We also used hidden month/day partitioning to reduce merge scans. Finally, we added a query builder in Reporting Service to route joins intelligently. Some joins are served from the precomputed Fact table, while others run between Fact and Iceberg tables at query time.
Production Rollout
Rolling out to production was more challenging than anticipated. We needed to ensure that no inaccurate data reached our merchants.
We followed three phases to ensure accuracy before decommissioning the legacy flow:
- Data reconciliation: Compared incremental and full-refresh facts record-by-record, resolving checkpointing, out-of-order events, and index lag issues until we hit 100% accuracy.
- Shadow testing: Ran A/B experiments generating shadow reports from incremental facts in parallel with live reports. Automated nightly comparisons flagged mismatches; we iterated until both were identical.
- Gradual live rollout: Progressively shifted live traffic to incremental facts with a fallback to the legacy flow, addressing edge cases without merchant impact.
Moving to a three-pipeline architecture from a single full refresh pipeline naturally raises the chance of a hiccup here and there, so we’ve made the system self-healing. Each pipeline now publishes its own checkpoints, meaning downstream pipelines can see exactly where their upstream counterparts are at and intelligently decide how much data to process if they’re lagging. If we do hit a delay, we automatically fall back to sources like TiDB to keep data fresh in reports. We also have Data Quality checks watching the whole flow; when they spot a mismatch, they flag it on our slack channels, narrowing down the debug scope.
Impact
We migrated the five largest facts to the incremental strategy. The ~90% reduction in compute time translated to proportional cost savings. Restoring full historical coverage in Facts allowed us to reduce TiDB retention significantly. Runtime joins enabled decomposing large monolithic facts into smaller, domain-specific ones — reducing blast radius and maintenance cost.
Lessons Learned
- Streaming isn’t always the answer: State-heavy joins at high event volumes eventually become cost-prohibitive. Batch + incremental can win.
- The lake should be queryable, not just archival: Secondary indexes on the lake eliminated warm-store dependency for historical lookups. Iceberg is adding native support for secondary indexes in upcoming releases.
- Not every dimension belongs in a materialised fact: Runtime joins with bucketed Iceberg tables are cheaper than write amplification at scale.
- Facts are graphs, not tables: Modelling fact configs as traversable dependency graphs is what unlocks incremental maintenance.
Future Roadmap
We’ve seen incredible operational and cost improvements from migrating our first five Facts, and it’s clear that the Incremental Strategy is the right path forward. We’re excited to transition the rest of our facts onto this new approach. Alongside this, we’re also diving into these key initiatives to push things even further:
- Real-time secondary index: We are exploring Apache Flink to merge the index pipeline into CDC ingestion. This approach achieves near-real-time freshness and reduces latency for lookups and ad-hoc queries.
- Extend support to more Sinks: Applying incremental processing to unlock savings and near-real-time freshness for warehouse tables in other destinations like ClickHouse, TiFlash, etc.
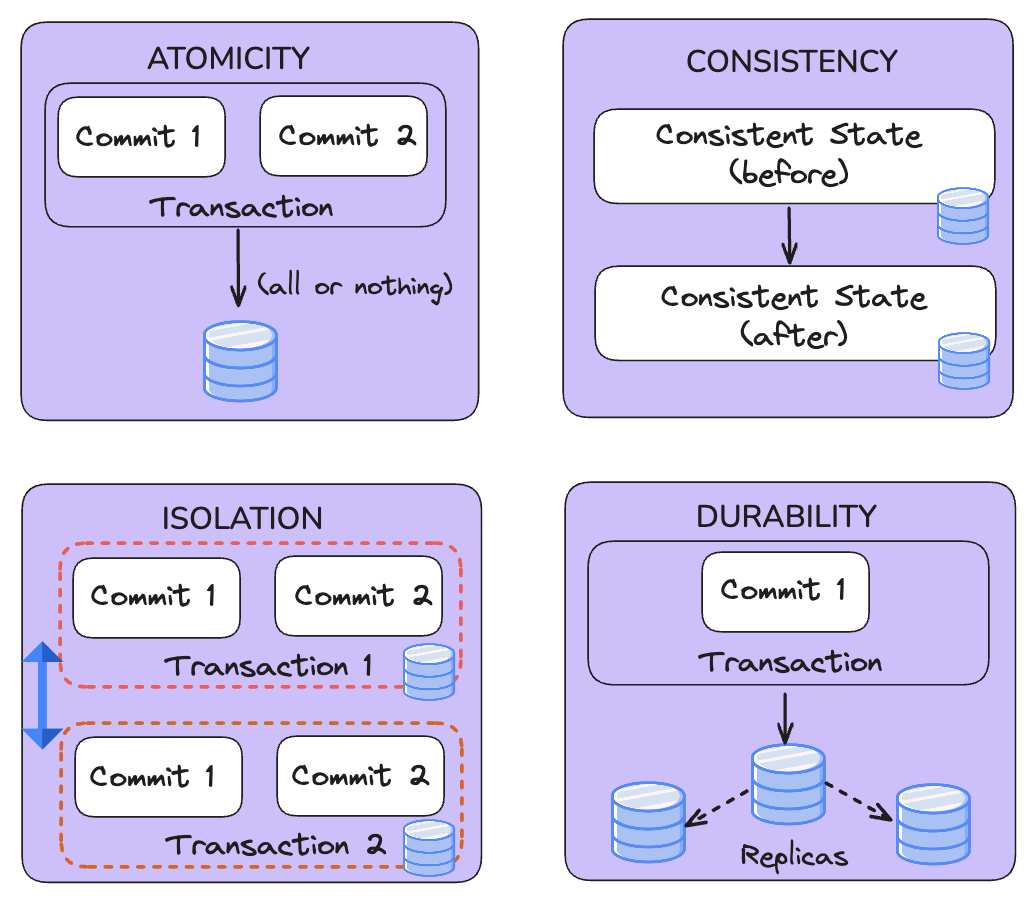
What is ACID on a Data Lake?
ACID on a data lake is essentially a transaction log that wraps object store operations in an atomic, serialized commit protocol.
Decoder
- Lakehouse: An architecture that combines the low-cost storage of data lakes with the ACID transactions and management features of data warehouses.
- Snapshot Isolation: A concurrency control guarantee where a query sees a consistent, immutable state of the database from the moment the query began.
Original article
ACID on a data lake means that writes to tables stored on object storage are Atomic, Consistent, Isolated and Durable — the same transactional guarantees a database provides, applied to files in S3, GCS or ADLS. That sentence is easy to say and surprisingly hard to deliver. A database owns its storage engine end to end; a data lake is a pile of Parquet files on an object store that offers durable single-object PUTs and nothing more. There is no multi-file atomic operation, no rename that atomically swaps a directory of files, and no built-in notion of "these 500 files belong to one write." Without extra machinery, a reader can list a directory while a writer is halfway through it and see a partial write, and two jobs writing to the same partition can silently clobber each other's output. ACID on a lake is the machinery — a commit protocol layered over the object store — that closes those gaps.
This post walks through what each of the four letters means concretely at the file level, how lakes worked before table formats existed, how formats like Apache Hudi deliver these guarantees, and — just as important — what ACID on a lake does not promise.
What A, C, I and D Mean on Object Storage
The textbook definitions of ACID were written for databases processing many small transactions. On a data lake, the transactions are large batch or streaming writes that produce files, so it is worth restating each property in file terms.
Atomicity means a write either publishes completely or not at all. Consider a Spark job writing 500 Parquet files into a table and dying at file 320 — an executor is lost, a spot instance is reclaimed, someone kills the job. Atomicity requires that those 320 orphaned files are never visible to any query, and that the failed write can be cleanly rolled back. Without it, every downstream consumer inherits a partially written dataset and no reliable way to detect it.
Consistency means every write moves the table from one valid state to another valid state. On a lake this covers schema enforcement (a write with an incompatible schema is rejected rather than quietly producing unreadable files), key constraints like upsert semantics (a record with the same key updates in place rather than duplicating), and the invariant that the table's metadata always describes exactly the set of files that constitute the table.
Isolation means concurrent readers and writers do not observe each other's intermediate states. Two failure modes matter here. First, two writers targeting the same partition at the same time — say, a backfill job and a streaming ingest job — must not interleave their files such that the table ends up with a mix of both writes' partial output. Second, a reader that starts listing files mid-write must not see half of a commit; it should see the table exactly as it was at some committed point, even if the query runs for an hour while new commits land.
Durability means a committed write survives failures. Object stores already provide excellent durability for individual objects — S3, GCS and ADLS replicate objects across zones. The lake-specific part of durability is that the commit record itself is persisted to the same durable storage, so that "was this write committed?" has a crash-proof answer, and a committed transaction is never silently rolled back by a subsequent cleanup process.
Life Before ACID on Data Lakes
The Hadoop and early cloud-lake era answered these problems with conventions, not guarantees. It is worth remembering how fragile those conventions were, because they explain why table formats exist.
The classic Hive pattern was the partition swap: write data into a staging directory, then "atomically" move it into place and update the Hive metastore partition location. On HDFS a directory rename was genuinely atomic, so this mostly worked. On object stores there are no directories and no atomic rename — a "rename" is a copy-then-delete of every object — so the same pattern became a slow, non-atomic window during which readers could see anything.
The _SUCCESS file convention had MapReduce and Spark drop an empty marker file when a job finished, and downstream jobs would poll for it. This signaled completion but protected nothing: readers that listed the directory directly saw partial data, a rerun of a failed job could mix old and new files, and there was no rollback story at all — cleanup after a failed job meant a human with a delete command deciding which files were orphans.
Layered on top of this, early S3 offered only eventual consistency for listings, so even a fully written directory might not be fully visible yet. Whole projects (S3Guard, committers with DynamoDB bookkeeping) existed just to paper over that. S3 became strongly consistent in 2020, which removed one class of bugs — but strong single-object consistency still does not give you multi-file atomicity, isolation between writers, or rollback. Those require a transaction log.
How Table Formats Deliver ACID
The shared insight behind Apache Hudi, Apache Iceberg and Delta Lake is that the table's state should be defined by a metadata log with an atomic publish step, not by whatever files happen to be in a directory. Data files are written first, invisibly; then a single, small metadata operation makes them visible all at once. Because that final operation is one atomic object-store action (a single PUT, or a conditional/compare-and-swap write), the entire multi-file write inherits its atomicity.
In Hudi, that log is the timeline — an ordered event log of every action performed on the table, stored under the table's .hoodie/timeline directory. Each write is an action that moves through explicit states: REQUESTED (the write is planned), INFLIGHT (data files are being produced), and COMPLETED (the write is published). The transition to COMPLETED is a single atomic object-store operation, and Hudi timestamps every action with monotonically increasing, TrueTime-style instants so actions are globally ordered even across independent processes.
This structure delivers each letter directly:
- Atomicity: our 500-file Spark job that dies at file 320 leaves an
INFLIGHTaction on the timeline and 320 uncommitted files that no query will ever read, because queries resolve visible files through completed timeline actions — never by listing directories. A rollback action later removes the orphaned files. Nothing partial is ever served. - Consistency: the timeline is the single source of truth for table state, and schema and key constraints are enforced as part of the write before the commit is published.
- Isolation: readers get snapshot isolation. A query binds to the set of completed commits as of its start and sees exactly that state for its entire duration, no matter how many writes complete concurrently. Multi-version concurrency control (MVCC) keeps prior file versions around so long-running queries are never yanked out from under.
- Durability: the commit metadata lives on the same replicated object storage as the data, so a completed instant is as durable as the data it describes.
For a deeper walkthrough of how the timeline underpins each transaction state transition, see the earlier post Hoodie Timeline: Foundational pillar for ACID transactions.
To be fair to the broader ecosystem: Apache Iceberg and Delta Lake achieve ACID through the same fundamental idea with different mechanics. Iceberg builds immutable snapshot trees of manifest files and commits by atomically swapping a pointer to the new table metadata (typically via a catalog's compare-and-swap). Delta Lake maintains a JSON transaction log (_delta_log) where writing log entry N+1 is the atomic commit point, using conditional writes on the object store. All three give you atomic multi-file commits and snapshot isolation; they differ in how metadata is organized, how conflicts are detected, and what concurrency patterns they optimize for. This transactional layer is a defining ingredient of the lakehouse architecture generally, not a Hudi-only concept.
Concurrency Control Models
Atomic commits solve the single-writer case. The harder question — and where table formats differ most — is what happens when multiple processes write to the same table. Hudi's concurrency control documentation lays out a spectrum of models:
Single writer with table services. Most pipelines have one writer, plus background table services (compaction, clustering, cleaning) that rewrite data for performance. Hudi distinguishes these by design: table services run lock-free alongside the writer, coordinated through the timeline via MVCC, either inline or fully async in the same process. For this very common case, no external lock infrastructure is needed at all.
Optimistic concurrency control (OCC). When genuinely separate jobs write to one table — a streaming ingest plus a batch backfill, say — Hudi supports OCC at file-group granularity. Each writer proceeds without blocking, and at commit time takes a short-lived distributed lock to check whether a concurrently completed commit touched the same files. Non-overlapping writes both succeed; overlapping writes cause one to abort and retry. The lock is held only around the commit-time critical section, not for the duration of the job.
OCC works well when conflicts are rare, but it has an honest weakness for streaming: two high-frequency writers that routinely touch the same file groups will repeatedly abort each other, wasting compute and starving progress.
Non-blocking concurrency control (NBCC). For multi-writer streaming, Hudi supports a mode where multiple writers can write into the same file groups simultaneously without aborting each other. Instead of preventing the conflict, resolution is deferred: commits are ordered by completion time on the timeline, and the query reader and the compactor merge overlapping writes deterministically. A lock is needed only for the instant-metadata write to the timeline itself. NBCC currently targets merge-on-read tables with bucket indexes, and reflects a streaming-native view of concurrency: serialize the log, not the writers.
What ACID on a Data Lake Does Not Mean
Honesty matters here, because "ACID" invites comparisons to OLTP databases that lakes are not designed to win.
- It is not OLTP. Commit latency on a lakehouse is measured in seconds — an object-store round trip plus metadata work — not the milliseconds of a transactional database. Lakehouse transactions are designed for batches and micro-batches of records, not single-row point writes at high QPS.
- Transactions span one table. The unit of atomicity in Hudi (and its peers, by and large) is a single table's commit. Multi-table transactions, cross-table foreign keys, and interactive multi-statement transactions with
BEGIN/COMMITsemantics are not part of the model. - Isolation is snapshot isolation, not serializability of arbitrary read-write transactions. Writers are serialized against each other per table, and readers see consistent snapshots — which is exactly what analytical workloads need — but you should not port an OLTP application's locking assumptions onto a lake.
- ACID does not fix bad pipelines. Atomic commits guarantee that what was written is either fully visible or invisible; they do not validate that the data itself was correct.
If your workload is high-QPS point reads and writes, use an operational database and land the changes onto the lake via CDC — which, conveniently, is a workload where lake ACID shines.
Why It Matters
These guarantees are not academic; they are what make several load-bearing patterns possible at all.
CDC correctness. Replicating a database table into the lake via change data capture means a continuous stream of upserts and deletes. Without atomic commits and key-based upserts, a mid-batch failure leaves the lake copy in a state the source database never had — and there is no way to reconcile. With ACID, every commit is an all-or-nothing application of a batch of changes, and incremental consumers downstream see change batches in a well-defined order, never partially.
Concurrent ingestion and table services. Real tables need continuous compaction, clustering and cleaning to stay queryable. Running those alongside ingestion without transactions means either stopping the world or risking corruption. MVCC on the timeline lets Hudi rewrite data in the background while writers write and readers read, with each process pinned to a consistent snapshot.
Regulatory deletes. GDPR and CCPA erasure requests require deleting specific records from immutable files — physically, a read-modify-rewrite of affected files. ACID makes each deletion pass atomic and auditable: the timeline records exactly when the delete committed, queries never see a half-deleted state, and the commit history serves as evidence of compliance.
Conclusion
ACID on a data lake is a commit protocol over object storage: data files are written invisibly, then published through one atomic metadata operation, with snapshot isolation for readers and explicit concurrency control between writers. Hudi implements this with its timeline — an ordered, durable event log of every action on the table — plus a spectrum of concurrency control modes ranging from lock-free single-writer deployments to OCC and non-blocking multi-writer streaming. Iceberg and Delta Lake deliver the same core guarantees through their own log designs. None of this turns a lake into an OLTP database, and it should not be sold that way; what it does is make tables on cheap object storage trustworthy enough to run CDC pipelines, concurrent services and compliance workloads that raw file lakes could never support. That trust is the foundation the rest of the lakehouse stack is built on.
FAQ
Does S3 support ACID transactions? Not by itself. S3 provides durable, strongly consistent operations on individual objects, but no atomic operation spanning multiple objects and no isolation between concurrent writers. ACID transactions on S3 come from a table format layered on top, such as Apache Hudi, Apache Iceberg or Delta Lake, which publishes multi-file writes through a single atomic metadata commit.
Is a data lake ACID compliant? A raw data lake of Parquet or ORC files is not ACID compliant: readers can observe partial writes, concurrent jobs can corrupt each other, and failed jobs leave orphaned files. A data lake becomes ACID compliant when tables are managed by a transactional table format, at which point it is usually called a lakehouse.
How does Hudi guarantee atomicity? Hudi records every write as an action on its timeline, moving through requested, inflight and completed states. Data files are written first but remain invisible; the transition to completed is a single atomic object-store operation. Queries only read files referenced by completed actions, so a failed write is never visible and is later rolled back cleanly.
What is snapshot isolation on a data lake? Snapshot isolation means every query reads the table as of a specific committed state and sees exactly that state for its entire run, even while new writes commit concurrently. Table formats implement it with multi-version concurrency control, keeping prior file versions available until no reader needs them.
Can multiple jobs write to the same lakehouse table at once? Yes, with concurrency control. Hudi supports optimistic concurrency control, where writers proceed in parallel and conflicts on overlapping files are detected at commit time using a short-lived lock, and non-blocking concurrency control, where multiple writers can even target the same file group and conflicts are resolved at read and compaction time.
Is ACID on a data lake the same as ACID in a database like PostgreSQL? The guarantees are the same in kind but different in scope and latency. Lakehouse transactions cover batches of records within one table and commit in seconds, whereas an OLTP database offers millisecond, multi-statement, often multi-table transactions. Lakes are built for analytical and streaming workloads, not high-QPS point reads and writes.

Cache Layer Architecture: A Practical Guide to Speed & Scale
Cache layers often fail due to stampedes and avalanches; the solution is jittering TTLs, request coalescing, and careful sharding of keys.
Decoder
- Cache Stampede (Thundering Herd): A performance collapse where a key expires and thousands of concurrent requests simultaneously attempt to regenerate it by hitting the backend database.
- CRDT (Conflict-free Replicated Data Type): A data structure that can be updated concurrently across multiple nodes and guarantees that all replicas will reach the same state without central coordination.
Original article
Cache layer architecture: a practical guide to speed & scale
Your app works fine with a thousand users. Then traffic spikes, requests hammer the same database systems, and response times crawl. A cache layer sits between your app and your slower data stores to absorb that load. Done well, it turns slow database round trips into fast cache lookups for most workloads. Done poorly, it becomes its own source of outages, stale data, and 3 AM on-call alerts. This guide covers what a cache layer is, where it sits, how caching patterns shape behavior, what breaks as traffic grows, and how it scales across nodes and regions.
What is a cache layer?
A cache layer is a high-speed storage tier that holds a subset of your data so future requests are faster than they would be from the original source. Instead of recomputing a result or querying a disk-based database, you keep a fast copy and read from there.
Memory is much faster than disk: RAM access happens in nanoseconds, while disk-based stores can take tens or hundreds of milliseconds per retrieval. Caching exploits that gap by keeping a copy of your data in the fast tier so reads skip the slow tier entirely. Teams cache high-cost data, including database query results, expensive computations, API responses, and web artifacts like HTML and images. Caching tends to work best with data that's immutable or changes infrequently, such as product and pricing reference data in an e-commerce app.
A few operational properties matter early:
- Hit rate: A high hit rate means the data was present when requested. A low hit rate means most requests still miss and fall through to the database anyway, so you're running a cache layer without getting the speed benefit it's supposed to provide.
- Cold cache risk: Changes in traffic, a cache fleet failure, or other surprises can send a surge of traffic to downstream services and lead to outages.
- Consistency: Because cached data can drift from the source, invalidation strategy matters early.
Where you place the cache in your architecture determines how each of these plays out.
Where does a cache layer sit in your architecture?
Caching happens at multiple layers between a user's request and your data, and each layer addresses a different problem. There are four cache positions you'll typically see:
- Client-side: The user's browser or device caches static assets so repeat visits skip the network entirely.
- Edge: Distributed edge locations cache static content close to users, cutting the distance data travels.
- Application or distributed cache: Sits between your app servers and the database, holding API responses, session data, and query results.
- Database-level: Inside the database engine itself, caching query plans and internal buffers.
Most architectural decisions happen at the application layer, where a distributed cache sits near your database and your app orchestrates cached data and validity. You also choose between a private cache held locally on each app instance and a shared cache multiple machines can reach. Local caches are fast but can drift apart when instances each hold their own copy of the same data. A common approach layers both: local in-memory caching plus a shared distributed cache for a fallback when the shared cache is briefly unreachable.
Redis fits naturally at this layer. Built as a real-time data platform with an in-memory design, Redis serves cache layers that need sub-millisecond latency for core operations and AI workloads. Beyond key-value caching, Redis supports vector search and semantic caching for AI workloads.
How caching patterns shape your cache layer
Once you know where the cache sits, the next decision is how reads and writes move between your app, the cache, and the database. This determines consistency, failure modes, and how much orchestration your app carries.
Cache-aside (lazy loading)
Cache-aside puts your app in charge of the cache. It checks the cache first, and on a miss it fetches from the database, populates the cache, and returns the data. Writes go straight to the database without touching the cache. The trade-off: cache failures don't have to break reads if the app falls back, but the first request for a cold key is slower and cache and database can drift.
Read-through
Read-through moves fetch logic into the cache itself. On a miss, the cache fetches from the database, stores the result, and returns it, so your app treats the cache as its read interface. App code stays simple, but every miss adds database load, and the pattern works best with a cache that can implement the synchronization logic.
Write-through
Write-through keeps the cache current by writing to both stores on every update. Every write hits the cache and the database, and the app only gets an acknowledgment after both confirm. The trade-off: reads are more likely to find current data, but a partial failure between the two writes leaves an inconsistency you have to resolve.
Write-behind (write-back)
Write-behind trades durability for throughput. Writes go to the cache first, and the cache asynchronously updates the database after a configurable delay. Throughput can increase and database load drops, but a cache crash before flushing can lose data, so it fits write-heavy workloads with lower-risk data like analytics events and counters.
Write-around
Write-around sends writes directly to primary storage and bypasses the cache, which only fills when data gets read later. Recently written data misses the cache and hits slower storage, so it suits write-once data like logs and events.
Most production systems combine these patterns: read-through with write-through keeps reads aligned with successful writes, while cache-aside with write-around gives you control over reads and skips the cache for bulk writes. Each combination still needs failure handling once traffic grows.
What breaks a cache layer as traffic grows?
Once traffic grows, a cache layer fails in specific, well-known ways. Know them upfront and you design around them instead of debugging them at 3 AM.
Cache stampede
A cache stampede, or thundering herd, happens when a popular key expires and many concurrent requests hit the database at once to regenerate it. A few mitigations help here:
- Request coalescing: When a key expires, only the first request that misses fetches from the database. Every other concurrent request for that same key waits for that result instead of also hitting the database.
- Time-to-live (TTL) jitter: Random jitter added to expiration times staggers expirations so keys don't all die at once.
- Probabilistic early expiration: The XFetch algorithm refreshes hot keys before full expiration and needs no coordination between processes.
Hot key problem
The hot key problem happens when one extremely popular key exceeds a single node's capacity, no matter how healthy the rest of the cluster is. In distributed caching, keys shard across nodes, and consistent hashing alone doesn't spread traffic to a single key. A few tactics reduce the impact:
- Key splitting: The hot value is stored under multiple keys so requests distribute across nodes.
- Local hot-key caching: App-side caches absorb reads for the hottest keys before they reach the shared cache.
- Fallback pools: Dedicated node pools handle the hottest entries so they don't crowd out normal traffic.
Cache invalidation & stale data
Cache invalidation is the problem of keeping cached copies in sync with the source: refresh too often and you lose the performance benefit, refresh too late and users see outdated data. Concurrent reads, writes, and multiple nodes create race conditions and stale windows. A few approaches balance that trade-off:
- TTL expiration: Entries expire after a set time, which works when the app can handle short periods of outdated data.
- Event-based invalidation: Updates fire when data changes, shortening stale windows at the cost of event-tracking infrastructure.
- Blended approach: A conservative TTL acts as a safety net alongside immediate event-driven invalidation for important updates like pricing and inventory.
Cache avalanche
A cache avalanche happens when an outage flushes the entire cache and every request hits the backend at once on recovery. If the outage outlasts the TTL, cached responses become useless and the backend takes the full load cold. A few defenses limit the blast radius:
- TTL jitter: Staggered expirations prevent large groups of keys from dying together.
- Refresh-ahead: Entries reload before they expire so the cache stays warm.
- Circuit breakers and load shedding: Last-resort defenses that protect the backend when the cache can't absorb traffic.
How a cache layer scales across regions & nodes
After you've planned for failure modes, scaling means spreading data across nodes and, eventually, regions without losing the speed that made caching worthwhile. Two mechanisms carry most of the weight: sharding and replication.
Sharding partitions your keyspace across nodes so no single node holds everything. Modulo hashing maps keys by hash remainder, but adding or removing a node can effectively reset much of the cache. Consistent hashing avoids that by mapping both keys and nodes onto a logical ring, so a node change only affects the keys between that node and its predecessor rather than a fixed cache count.
Consistent hashing has its own limits: it can produce non-uniform distribution and doesn't account for differences in node capacity. Virtual nodes help by assigning each physical node multiple ring positions, so higher-capacity nodes take more traffic and a failed node's load spreads across the survivors. Replication adds availability on top: each shard typically has one read/write primary and one or more read-only replicas.
Redis Cluster is built around these ideas, sharding automatically via key hashing across a suggested max of ~1,000 nodes in a shared-nothing design.
Going multi-region
Spanning regions is where things get harder because writes can happen in more than one place at the same time. Active-Active Geo Distribution distributes database instances across data centers so each region serves traffic with local low latency. Redis implements this with conflict-free replicated data types (CRDTs), which let each region accept local reads and writes in a multi-master model while providing strong eventual consistency with automatic conflict resolution. Different data types resolve conflicts differently: Strings use last-write-wins, while Sets use add-wins semantics.
CRDTs reduce app-level reconciliation, but they don't remove the operational weight of deciding how clients reroute traffic, how regions recover, and how to avoid split-brain in surrounding systems. Enterprise-grade Redis lists 99.999% uptime for supported Active-Active deployments, but that number reflects the engineering behind failover and conflict handling, not a switch you flip.
A cache layer is architecture, not an add-on
Cache layer design is architecture work, not a feature you bolt on later. Treat it as an add-on and you end up with stale data bugs, stampede outages, and cold caches after a node change. The choices that matter come early: where the cache sits, which pattern governs reads and writes, how you defend against failure modes, and how you shard and replicate as you grow.
Redis fits this picture as a real-time data platform with a memory-first design, supporting fast reads for suitable workloads, clustering for horizontal scale, CRDT-based Active-Active Geo Distribution for multi-region architectures, sessions, messaging, vector search, and semantic caching for AI workloads. If you're designing a cache layer for speed and scale, try Redis free to see how it holds up against your workload, or talk to Redis about your architecture.

Benchmarking Single Node vs Distributed
Polars benchmarks show that single-node execution often outperforms distributed clusters for join-heavy tasks due to network shuffle overhead.
Deep dive
- Network limits: Cluster performance is heavily influenced by network burst capabilities; I/O-bound queries benefit from aggregate cluster throughput.
- Shuffle penalty: Queries with heavy joins suffer in distributed environments due to the cost of moving data (shuffling) across nodes.
- NUMA contention: The team identified that work-stealing across NUMA regions on large single-node instances caused performance degradation, a factor they are actively optimizing.
- Benchmark setup: Tests used a 1TB TPC-H dataset with scale factor 1000 on AWS.
Decoder
- Shuffle: The process of redistributing data across nodes in a distributed system, typically occurring during join or aggregation operations.
- NUMA (Non-Uniform Memory Access): A computer memory design where memory access time depends on the memory location relative to the processor; crossing between NUMA nodes incurs a latency penalty.
Original article
Benchmarking single node vs distributed
Last post we compared our distributed engine performance against Apache Spark. This sparked some interest; “How does it perform against single node Polars”. That interest is shared by us. Polars has gotten popularity by massively increasing single node performance and by reducing complexity by delaying the need for Spark and distributed compute (with the release of distributed Polars we postpone the need indefinitely). Some voices in the industry claim that if you can process data single node, this is always faster and cheaper, today we learn a bit more nuance story… It depends. This post we’ll see when you can expect distributed Polars to beat single node and vice versa.
1. Distributed engine
The distributed engine uses our open source streaming engine for performance, but adds a distributed planner and communication layer on top of it. Any change we make in our open source streaming engine therefore immediately translates to improvements in the distributed engine as well, plus this guarantees that the engine semantics (e.g. nulls handling) remain the same. This aligns the interests of our open source and distributed offering.
There are differences in performance characterstics between the two which we can see in the results below.
2. Setup
Polars Decision Support (PDS-H) is an open implementation derived from the TPC-H benchmark. It uses the TPC-H data model, data generation methodology, and query workload to measure analytical query performance across a potential range of dataset sizes.
The benchmarks were run on a scale factor of 1000, which means the dataset used is the size of roughly a terabyte of data if it were stored in uncompressed CSV with the data coming directly from AWS S3, including network I/O for reading. Both machines are priced similar on AWS. To avoid any outliers (e.g. bad network connections), we ran the benchmarks three times and measured the fastest result. The code can be found in the following GitHub repository.
2.1 Hardware specifications
Comparing distributed compute to single node isn’t an apples to apples comparison, for this reason we tried to stay within the same family and ensure we have the same vCPU, RAM and storage between the two.
- Single node: m8i.32xlarge (128 vCPUs, 512 GB RAM)
- Distributed: 32 * m8i.xlarge (4 vCPUs, 16 GB RAM)
3. Results
Below are the per-query results comparing single node Polars against distributed Polars. For most queries the two run close to eachother, but on some queries single node wins while on others distributed wins.
Overall this leads to the following summary with the distributed engine being slightly faster than single node overall:
This results goes against the conventional wisdom that if it fits on a single machine it should be faster due to the lack off data shuffling. We can see this for heavy join queries (Q8 & Q9) single node is much faster than distributed as a lot of time is spent shuffling data over the network.
3.1 Network I/O
For queries Q6, Q14, Q15 distributed is a lot faster than single node. The main reason for this, is that those queries are I/O-bound. For AWS, network speeds do not scale linearly with the number of vCPUs, but work on a credit system. This system favors many small machines over large ones. If we look at Q6 in the benchmark:
q = (
    lineitem.filter(
        pl.col("l_shipdate").is_between(
            date(1994, 1, 1), date(1995, 1, 1), closed="left"
        )
    )
    .filter(pl.col("l_discount").is_between(0.05, 0.07))
    .filter(pl.col("l_quantity") < 24)
    .with_columns(
        (pl.col("l_extendedprice") * pl.col("l_discount")).alias("revenue")
    )
    .select(pl.sum("revenue"))
)
This query exists almost purely of network I/O, reading in the lineitem table (6B rows) with some predicate filtering and then aggregating the results. The bottleneck here is the speed at which the data is being read from S3, not the CPU or memory.
If we compare the network bandwidth available for each setup:
| Setup | Per-instance baseline | Per-instance burst | Instances | Aggregate baseline | Aggregate burst |
|---|---|---|---|---|---|
Single node (m8i.32xlarge) |
50 Gbps | 50 Gbps (sustained) | 1 | 50 Gbps | 50 Gbps |
Distributed (m8i.xlarge) |
1.88 Gbps | 12.5 Gbps | 32 | 60.16 Gbps | 400 Gbps |
The m8i.32xlarge runs at a sustained 50 Gbps and does not burst. The smaller m8i.xlarge has a lower baseline of 1.88 Gbps but can burst up to 12.5 Gbps on network I/O credits. Spread over 32 workers, the cluster’s aggregate baseline (~60 Gbps) already exceeds the single node, and its aggregate burst reaches 400 Gbps, 8x the single node, which is why we see such a large difference in performance for Q6. For a fresh machine you get roughly an hour of full burst capacity before it starts to throttle back to the sustained baseline.
In queries Q8, Q9, we see that single node is much faster. The reason for this is that these queries have many joins, which in turn lead to many shuffles. Even though you have more I/O capacity in the cluster, increasing the total I/Os needed by the extra shuffles is detrimental and single node wins.
We are planning to include bloom filters pushdown between stages. This will drastically reduce the amount shuffled between stages and might change this verdict in the future.
3.2 Numa awareness
In essence, this comes down to a choice between scaling vertically or horizontally. In both directions we can get the same vCPU and RAM, however we saw that I/O doesn’t scale linearly. vCPU does scale linearly, but not all vCPU count is created equal. If you increase the amount of vCPU’s on a single machine, at one point CPU cores are assigned to different NUMA (non uniform memory access) regions. Between these regions, reading memory is much more expensive and can become a bottleneck.
Our streaming engine has a concept of work stealing built into it. This means that when a thread is idle, it can steal work from other cores to increase performance. This works well for smaller machines (with single NUMA regions), but on large machines a CPU is typically divided over multiple different physical (NUMA) nodes, in which case work stealing can lead to performance degradation due to data transfer.
Our test setup m8i.32xlarge is divided over two NUMA nodes each with their own memory. Our streaming engine is currently stealing work across NUMA nodes, which leads to memory contention and overall slower performance.
We are in working on solving this issue and have run a secondary benchmark on a smaller single node (r8i.16xlarge) with a single NUMA node. The results show that single node execution is faster on most queries, expect for ones with heavy read I/O.
4. Conclusion
The decision to use distributed or single node compute is not only influenced by scale, but it turns out to also be influenced by speed and latency, and therefore cost. Polars will optimize both engines and ensure that we utilize the maximum of the trilemma I/O, CPU and RAM. By running this benchmark we show that choosing your scaling method is a nuanced story. One that we want to make easier. Overall, we recommend using the query profiler for both cases to understand the performance characteristics of your queries.
Appendix: Non-numa benchmark on r8i family
We ran the benchmark again on an r8i.16xlarge instance, which has a single NUMA node. The number of cores drops significantly from 128 to 64, meaning many of the queries now are not network bound, but CPU bound. This lead to the following results:
Footnotes
- While PDS-H closely follows the TPC-H specification, it is not an officially audited or certified TPC-H benchmark. Consequently, PDS-H results are intended for comparative evaluation within PDS-H and are not directly comparable to published TPC-H benchmark results.
- For a full guide on AWS network bandwith, you can find the offical documentation here.
Greysight (Tool)
Greysight is a new open-source tool for Snowflake that monitors warehouse, AI, and storage costs without ever accessing underlying user data.
Deep dive
- Monitors Snowflake warehouse, Cortex AI, and storage spend.
- Operates with least-privilege, read-only credentials.
- Does not access customer data or query results.
- Supports self-hosting or managed cloud deployment.
- Retains usage data only in volatile memory during processing.
- Stores credentials in Supabase Vault.
Decoder
- Cortex: Snowflake's suite of integrated AI and machine learning services.
- ACCOUNT_USAGE: A set of views in Snowflake providing historical account-level metadata for billing and audit purposes.
Original article
Full article content is not available for inline reading.
Cloudflare as a Data Platform?
Cloudflare R2 paired with Apache Iceberg presents a compelling, low-cost architecture for lakehouses, provided teams can manage the lack of native orchestration.
Deep dive
- R2 eliminates egress fees, reducing total cost of ownership for data-heavy applications.
- Apache Iceberg enables ACID transactions on top of object storage, allowing for modern data lakehouse features.
- Lack of built-in orchestration requires developers to use external tools or custom scripts for table maintenance and data ingestion.
- Performance at the edge for read-heavy analytical queries is competitive with S3 but requires careful partitioning strategies.
- Cloudflare's serverless ecosystem offers a scalable alternative to traditional centralized data warehouses for specific high-volume workloads.
Decoder
- R2: Cloudflare's S3-compatible object storage service that does not charge for egress bandwidth.
- Apache Iceberg: An open table format for huge analytic datasets that provides fast query performance and ACID transactions.
- Lakehouse: A data architecture that combines the low-cost, flexible storage of a data lake with the management and performance features of a data warehouse.
Original article
Early experimentation shows R2 + Iceberg can serve as a lightweight lakehouse, but workflow orchestration remains a gap.

Anthropic moves closer to mega-IPO as bankers line up investor meetings
Anthropic is accelerating IPO plans, seeking investor meetings with major banks following a $65 billion funding round that valued the firm at $965 billion.
Original article
- Anthropic is scheduling investor meetings ahead of a possible IPO, a person familiar with the plans told CNBC.
- Goldman Sachs, Morgan Stanley and JPMorgan Chase — Wall Street's three biggest banks by revenue — are involved in the offering.
- A listing would put Anthropic ahead of rival OpenAI in reaching public markets and build on the momentum from SpaceX's blockbuster June IPO; Anthropic was last valued at $965 billion.
Anthropic is lining up meetings with investors ahead of a potential initial public offering later this year, a person with knowledge of the plans told CNBC.
Bankers leading the offering are scheduling meetings between prospective investors and executives of the artificial intelligence firm behind the popular Claude models, said the person, who declined to be identified speaking about the process.
The meetings suggest Anthropic's IPO preparations are advancing, as bankers begin sounding out investor demand before a formal roadshow and eventual share sale. Anthropic confidentially filed its IPO prospectus with the Securities and Exchange Commission last month, but hasn't disclosed when it plans to debut.
The giant AI startup could hit the public markets as soon as October, though the timing could change. An Anthropic spokesperson declined to comment.
An Anthropic listing would build on momentum from June's massive SpaceX IPO and further open the public markets to companies at the center of the AI boom. It follows years in which the industry's biggest names remained private while raising hundreds of billions of dollars from investors.
Anthropic appears poised to beat rival OpenAI to the public markets, which could be an advantage for the startup if AI enthusiasm later wanes. OpenAI also confidentially filed for an IPO with the SEC in June, but it has not disclosed any additional details.
Anthropic was founded in 2021 by a group of executives and researchers who defected from OpenAI over concerns about the company's direction. Anthropic has found early success selling to enterprises, in large part due to its popular coding assistant, Claude Code.
The company closed a $65 billion funding round at a $965 billion valuation in May, pushing it above OpenAI's $852 billion valuation for the first time.
Goldman Sachs, Morgan Stanley and JPMorgan Chase, the three biggest Wall Street banks by revenue, are involved in the IPO planning.
The AI spending boom has fueled a resurgence in profit for Wall Street firms as they seek to satisfy investors clamoring for ways to fund the buildout and invest in or hedge aspects of the theme.
How OpenAI's Sol Finally Learned Design Taste
OpenAI's GPT-5.6 Sol achieved the top spot on the Design Arena leaderboard by actively suppressing common AI design anti-patterns like purple gradients and bento-box layouts.
Decoder
- Bento-box layout: A common web design pattern where content is partitioned into rectangular modules, often overused in current AI-generated landing pages.
- Design anti-patterns: Recurring visual elements or structural choices that signal an AI-generated origin, often leading to generic user interfaces.
Original article
We benchmarked GPT-5.6 Sol on Design Arena’s Web Design (Non-Agentic) Arena, and we were surprised to find that it ranks 1st overall. This is 18 places higher than its predecessor GPT-5.5, and is the first time an OpenAI model has placed first on this leaderboard. We dug deeper and broke down the deployments of GPT-5.6 Sol to track which frontend coding tasks the model excels at:
- GPT-5.6 Sol appears to recognize and actively suppress common AI design anti-patterns. We projected the CLIP embeddings of 1,000 websites generated by GPT-5.6 using UMAP to visualize the model’s design manifold. Shockingly, we found that its design space contains clear gaps where GPT-5.5 produces purple gradients, bento-box layouts, oversized hero text, and offset compositions, suggesting that GPT-5.6 has learned these AI-anti patterns but selectively avoids generating them.
- It combines strong templates with unusually high personalization. GPT-5.6 Sol starts from proven design structures but adapts them substantially to each prompt, striking a better balance between consistency and variety than either heavily templated or fully unconstrained models.
GPT 5.6 Sol establishes two new Pareto frontiers for both preference vs speed and preference vs price. It is over 2.44x faster than GLM 5.2 (previously ranked 1st) and 36% faster than Claude Fable 5, with a price of $5/$30 per 1 million tokens versus Claude Fable 5’s $10/$50 per 1 million tokens.
So what changed in GPT-5.6 Sol’s website outputs?
We discovered GPT-5.6 Sol’s design taste has been carefully curated to avoid AI anti-patterns that lead to generic aesthetics. This specialization in design, unique approach to templating, and remarkable multimodal performance places GPT-5.6 Sol first on our single-turn leaderboards.
Model Behavior #1: Explicit Avoidance of AI Anti-Patterns
In our review of GPT-5.5 three months ago, we identified a set of “design smells” that GPT-5.5 consistently produced. These design smells included large typefaces instead of hero images, unusual layout decisions, and overused purple gradients. We’re happy to say that most of these design smells have completely vanished in GPT-5.6 Sol.
We were shocked to discover strange holes in the resulting subspace.
These holes are not present in other models, such as in the GPT-5.5 visualization below, since most models produce web designs similar to other previously generated designs, with variations only coming from the prompt itself. Since UMAP projection theoretically preserves holes in the manifold (assuming the right projection parameters), finding holes in one model’s design space, yet not in another model’s, signals that GPT-5.6 Sol may have a cluster of designs within those holes that it’s not generating.
To figure out what designs are within these holes, we overlapped GPT-5.6 Sol and GPT-5.5’s websites within the same embedding space and conducted the same UMAP projection as earlier. From there, we colored all of the GPT-5.6 Sol generations orange, then stacked those on top of GPT-5.5’s generations. Any regions without orange would be patterns specific to GPT-5.5, while any regions with orange would be specific to GPT-5.6 Sol.
This becomes even clearer if we remove the screenshots and replace GPT-5.5 and GPT-5.6 Sol specific generations with blue and orange dots respectively. This gives us the visualization below, where we can see GPT-5.5 and GPT-5.6 Sol generate mostly similar websites, with GPT-5.6 Sol showing slightly more variance than GPT-5.5. However, there is one major cluster where GPT-5.5 and GPT-5.6 Sol don’t overlap at all: the cluster for websites with purple gradients.
While GPT-5.6 Sol produces largely similar designs to GPT-5.5, there is a clear effort when it comes to avoiding many common AI anti-patterns. We see the same effect for other anti-patterns, like bento box layouts, large typefaces in hero images, and offset layouts.
This approach is notably different from other models. For example, GLM-5.2 avoids anti-patterns such as large typefaces by learning a set of templates that do not include them. This avoids anti-patterns without creating holes in the generated space since GLM-5.2 simply avoids generating designs with anti-patterns entirely.
While GLM-5.2 appears to have avoided learning design anti-patterns at all (and thus avoids producing them), it appears as if GPT-5.6 Sol has learned that specific design anti-patterns exist, but refuses to produce them. Despite its avoidance of common anti-patterns, this approach doesn’t generalize to all anti-patterns. For example, GPT-5.6 Sol consistently overuses confetti, which appears in over 26.5% of generations. It even goes to the extent of hand-rolling its own confetti libraries when none are provided.
The model also has lower performance when creating charts and data visualizations since it does not excel at utilizing chart.js for creating realistic charts.
Model Behavior #2: Customized Templates Strike the Balance Between Generalization and Specialization
One of the primary signals we measure for model performance is “templating”, where models simulate design taste by learning a set of high-performing templates that play well on the arena. This is normal for frontier-level models, and in a previous analysis for GLM 5.2, we found that this strategy allowed it to reach the first place position on our leaderboard.
Compare this to Claude Fable 5, which we found to have almost no templating. It has a far more varied design space, personalizing each output to the user’s needs.
GPT-5.6 Sol combines the two design approaches by utilizing templates, but making far more changes to create variance within each cluster. Much like how bacteria evolves into different related genetic strains, the model has similar clusters of designs that are then further personalized to a user’s prompt. This is especially apparent when it comes to GPT-5.6 Sol’s use of images, as the model tends to utilize the same image for multiple different contexts and use cases.
This personalization is precisely why GPT-5.6 Sol performs so well on Design Arena, as every user receives a customized website for their use case that still feels as if it were professionally designed.
What this means for model selection
Taken together, these findings suggest that GPT-5.6 Sol’s advantage comes from being both more selective and more adaptive. It appears to have (1) learned which visual patterns make AI-generated websites feel generic, then actively suppresses them, while still preserving a set of reliable design structures that it can customize to each prompt, and (2) combines templated designs with customized outputs. These are some of the primary indicators that have resulted in GPT-5.6 Sol leading the Design Arena leaderboard. We will continue to monitor GPT-5.6 Sol's performance and how it compares to other models. Congratulations to the OpenAI team on the launch, and try out GPT-5.6 Sol yourself on DesignArena.ai.
GPT-Red for Safety Testing
OpenAI's new GPT-Red model acts as an automated adversary, reportedly reducing prompt-injection vulnerabilities in GPT-5.6 Sol by sixfold.
Decoder
- Prompt Injection: A security exploit where an attacker inputs malicious instructions into an AI model to bypass safety guardrails or extract sensitive system information.
- Red Teaming: A practice of attempting to breach or find vulnerabilities in a system from the perspective of an attacker to improve security.
Original article
OpenAI trained GPT-Red to iteratively generate adversarial prompts and expose model vulnerabilities at scale. Incorporating its attacks into training reportedly reduced failures on a difficult prompt-injection benchmark by sixfold for GPT-5.6 Sol.

The Powerhouse of the AI Chip
Systolic arrays are the backbone of modern AI chips, moving matrix data locally to achieve speeds 20x to 100x faster than general-purpose computing.
Decoder
- Systolic Array: A network of processing elements that compute data in a rhythmic, pulse-like fashion, passing intermediate results to neighboring cells to optimize throughput.
Original article
The Powerhouse of the AI Chip
Systolic arrays are the powerhouse of every single modern AI chip, representing over 95% of their total compute. Without them, AI workloads run 20x-100x slower. In this post we’re going to discuss...
Access and share AI Gateway leaderboard data
Vercel has opened its AI Gateway leaderboard data, allowing developers to download production usage trends for various models and providers under a CC BY 4.0 license.
Deep dive
- Data Access: Leaderboard data is licensed CC BY 4.0 for commercial and personal reuse.
- Metrics: Rankings include requests, token volume, spend, and multimedia generation counts.
- Granularity: Data is aggregated daily and can be filtered by modality (text, image, video).
- API Export: The
leaderboard-exportendpoint returns JSON data, cached with a 24-hour TTL.
Original article
We are making the data behind the AI Gateway leaderboards open under the CC BY 4.0 license. You can now download or query the data through the leaderboard-export API endpoint and render any chart as a shareable image.
The AI Gateway leaderboards show how AI is used in production, ranking traffic for models, labs, apps, and providers. Data is aggregated daily across trillions of tokens, so you can see what gets adopted and how that changes over time. For deeper analysis, see the July AI Gateway Production Index.
What's ranked
There are four leaderboards, each with its own metrics:
| Leaderboard | Ranks | Metrics |
|---|---|---|
| Models | Individual models | Requests, token volume, spend, images or videos generated |
| Labs | Model labs | Requests, token volume, spend, images or videos generated |
| Apps | Opted-in apps built on the AI Gateway | Token volume, spend |
| Providers | Inference providers | Token volume, spend |
Models and labs can be filtered by modality (text, image, video) and show a daily percentage share over time; apps and providers are aggregated across all modalities and show a ranked top list.
Open data
The data behind the leaderboards is open, published under Creative Commons Attribution 4.0 (CC BY 4.0). You are free to use, share, and adapt it, including commercially, as long as you give credit, link to the license, and indicate if changes were made.
Every chart and ranked list has a download button that exports the current view as a CSV.
For programmatic access, use the export endpoint, which returns the same data and is cached for 24 hours:
# Full export, all datasets
curl "https://vercel.com/api/ai/leaderboard-export"
# A single dataset
curl "https://vercel.com/api/ai/leaderboard-export?dataset=models"
# A single dataset, filtered by modality
curl "https://vercel.com/api/ai/leaderboard-export?dataset=models&modality=image"
For models and labs, each row is one entity's daily share of a single metric. One response includes rows for requests, tokens, spend, imageCount, and videoCount, so filter on the metric field to pull out the series you want.
{
  "date": "2026-05-10",
  "group": "model",
  "name": "Gemini 3 Flash",
  "metric": "tokens",
  "modality": "text",
  "share_percent": 23.98
}
Share a chart
Every chart has a share button that turns the current view into an image. Pick an aspect ratio (landscape, square, or portrait), then download it as a PNG or copy it to your clipboard. The image includes the legend, title, and AI Gateway branding.
View the leaderboards or read the AI Production Index.
Stripe and Private-Equity Firm Advent Offer to Buy PayPal
Stripe and private equity firm Advent International have submitted a $53 billion joint acquisition bid for PayPal.
Original article
Stripe and Advent International have made a joint takeover bid for PayPal. They proposed paying $60.50 a share for PayPal in a deal that values the fintech company at around $53 billion. PayPal was valued at around $42 billion as of Friday. The company is currently in the early stages of orchestrating a turnaround under a newly appointed chief executive. There are no guarantees that PayPal will be receptive to the offer, as it has previously peaked at more than $300 a share.
Uber and Waymo Are Sparring. The Robotaxi Future Has Arrived
Uber and Waymo are moving from partners to public adversaries as labor concerns and profit-sharing models clash in the robotaxi space.
Original article
Waymo and Uber are nominally partners. However, these days, the two companies are trading thinly veiled jabs in a gathering lobbying battle. An Uber representative highlighted at a public hearing this week how the company's drivers spend their earnings and pay taxes locally, while robotaxi profits flow to unnamed companies based elsewhere. A Waymo representative conceded that robotaxis would mean job losses, but noted that rideshare companies control drivers' earnings and are taking a significant chunk for themselves.
Mira Murati's AI Startup Releases First Model in Bid to Loosen AI Giants' Grip
Mira Murati’s Thinking Machines Lab launched Inkling, a 975-billion parameter foundation model designed for cost-efficiency rather than raw performance.
Original article
Thinking Machines Lab released its first AI model yesterday. Inkling has 975 billion parameters and is trained to be a broad, balanced foundation model. It is strong across many domains and flexible enough to adapt. The model is designed to balance cost against performance rather than for raw power. It can be customized through Tinker, a cloud-based fine-tuning tool for AI developers and researchers that Thinking Machines released last year.

SpaceX unveils Starlink next-gen V5 kit: here's what's new
SpaceX's new Starlink V5 kit is half the weight of the V4 model and significantly more power-efficient, drawing only 35-50 watts.
Decoder
- Low-Earth-Orbit (LEO): Satellite constellations positioned closer to Earth, reducing latency compared to traditional geostationary satellites.
Original article
SpaceX’s Starlink has launched its latest residential hardware kit: the V5. Designed for reliable high-speed internet, the new terminal represents a significant leap forward in user equipment.
The next generation Starlink Kit is designed to deliver reliable, high-speed home internet. Starlink V5 has a smaller form factor and lightweight design with greater power efficiency than the Starlink V4.
With speeds up to 375+ Mbps, Starlink V5 delivers seamless connectivity.
The new V5 Starlink kit features a dramatically smaller and lighter form factor, measuring approximately 384 mm x 306 mm x 34 mm and weighing just 1.1 kg, which is less than half the weight of the previous V4 model, which was 2.9 kg.
This compact design makes installation easier and more versatile, whether mounted on a roof, pole, or even integrated with a pipe adapter. An integrated LED light aids setup in low-light conditions.
Power efficiency sees major gains too. The V5 draws only 35-50W, reducing energy consumption and making it ideal for off-grid or solar-powered setups. Despite its smaller size, performance remains robust. Starlink claims peak speeds of 375+ Mbps, supported by a new Wi-Fi 6 Router Mini that covers up to 2,200 square feet and connects up to 235 devices simultaneously.
The kit maintains strong signal reliability in diverse environments, from urban rooftops to remote rural areas, as demonstrated in the promo footage released by SpaceX, showing seamless operation under cloudy skies.
These improvements expand suitable applications considerably. Households can enjoy lag-free 4K streaming, smooth video conferencing, online gaming, and smart home device management without interruption. The V5’s efficiency and portability also benefit RVs, small businesses, and temporary installations in disaster-recovery zones where quick deployment is critical. Its lightweight build lowers shipping costs and simplifies user handling compared to bulkier predecessors.
Starlink’s Broader Impact on Global Internet Connectivity
Since SpaceX began launching Starlink satellites in 2019, the constellation has grown rapidly. By mid-2026, over 10,400 satellites orbit Earth, with thousands more deployed annually. This massive low-Earth-orbit network delivers broadband to approximately 160 countries and territories, reaching millions of users who previously lacked reliable internet access.
Starlink plays a vital role in bridging the digital divide. It provides essential connectivity to remote communities, maritime vessels, airlines, and regions affected by natural disasters or infrastructure gaps. By combining advanced satellite technology with iterative hardware upgrades like the V5 kit, SpaceX continues to push the boundaries of global internet access, fostering education, economic opportunity, and emergency response capabilities worldwide.
As production ramps up, the V5 promises to make high-performance internet even more accessible to users everywhere.

Airbnb's Cost of Market Creation and Regulatory Survival
New York City's regulatory crackdown on Airbnb shows little impact on housing affordability, suggesting Airbnb is a convenient but ineffective bogeyman for rent spikes.
Decoder
- Gross Booking Value (GBV): Total value of bookings made through a platform before the company deducts its fees and other expenses.
Original article
Airbnb is one of those rare marketplaces that derive a supermajority of its demand organically and hence, they have the privilege of mostly not needing to pay Google et al for traffic. However, Airbnb appears to have a different “recurring” expense to keep their business growing: field operations and policy expenses which is reported under Sales & Marketing (S&M). To underscore the significance of these costs, let me point out that ~40% of Airbnb’s last year’s S&M was actually field operations and policy expenses. What exactly are these expenses? I explained in a piece early this year:
Field operations basically account for the employees who manage specific local markets, recruit new property Hosts, run host-community events, and manually build localized housing supply to meet traveler demand. As Airbnb started focusing beyond the five core markets, I suspect such field operations cost had a noticeable bump.
Moreover, because Airbnb’s business model can potentially impact local housing markets, it faces intense regulatory scrutiny. This likely necessitates armies of lobbyists, lawyers, and policy experts who negotiate with city councils, mayors, and national governments regarding short-term rental bans, zoning laws etc. As a market leader of alternative accommodation, Airbnb must tackle these issues. This can actually be good news for its competitors such as Booking who can largely coattail on Airbnb’s spending on such regulatory efforts.
As you can see, since there are a lot of different things bucketed in this reporting cost line item, it’s hard to pinpoint what exactly is driving the expenses. Even though I would expect to see operating leverage in this cost line item over time, that’s not what we have seen so far. For example, back in 2021, Airbnb spent 1.0% of its Gross Booking Value (GBV) on field operations and policy expenses. Since then, Airbnb’s GBV almost doubled by 2025. And yet, Airbnb’s field operations and policy expenses was actually 1.1% of its GBV in 2025, implying not much of an operating leverage at all.
The reality is over the last few years, the regulatory headaches around the impact of short-term rentals on housing has been intensifying. The poster child for such headache is New York City. Almost three years ago, NYC flipped the switch on Local Law 18, its short-term-rental registration and platform-verification regime. Local Law 18 required hosts to register with the city and effectively banned unhosted stays under 30 days which predictably led to a collapse of Airbnb’s supply in NYC. The Office of Special Enforcement says there were more than 38,000 active listings at the start of 2023; by 2025, New York had only 3,000 active short-term-rental registrations. The promise from the law's backers seemed quite simple and intuitive: those units would come back to the long-term market, supply would loosen, and rents would ease.
Jay F. at The Data Stream recently tried to answer whether the reality matches the promises three years after the de-facto ban on Airbnb. He compared rent trends in neighborhoods with high and low concentrations of Airbnb listings, using asking-rent data from both Zillow and StreetEasy. This is what he found (emphasis mine):
“I ran an event-study difference-in-differences: comparing rent trajectories in high-density versus low-density areas, within the same borough and controlling for new construction. To summarize, there was no notable effect size. The best estimate is that the ban saved the typical renter about $52 a year but with a confidence interval of -$71 to +$175.”
As you can see above, asking rents in the most Airbnb-heavy neighborhoods did not clearly break away from rents in the least Airbnb-heavy group after enforcement. If anything happened, it is difficult to distinguish from ordinary neighborhood-level noise. This should not be particularly surprising. The Data Stream estimates short-term rentals were only 0.59% of New York’s rental stock before the crackdown. Even if every banned listing became a conventional rental, the supply shock would still be small relative to the city. In reality, only 42% of the affected listings had adopted a 30-night minimum by January 2024. Another 44% disappeared from Airbnb, which does not tell us whether they became year-long rentals, returned to owner use, or something else. NYC may not be an exception either since back in 2019, Barron, Kung & Proserpio's US-wide study also would predict relatively minor impact of Airbnb on rent and housing prices. From the US-wide study back in 2019:
“At the median owner-occupancy rate zipcode, we find that a 1% increase in Airbnb listings leads to a 0.018% increase in rents and a 0.026% increase in house prices”
Even though Airbnb has grown lot more since 2019, it appears the impact of Airbnb remains somewhat insignificant. Nonetheless, I’m not quite sure to what extent such data would convince NYC or other cities to not give into such populist impulse of banning short-term rentals. Perhaps everyone loves to find a bogeyman whom you can blame for rising rent or housing prices and as I alluded earlier, blaming Airbnb makes perhaps “intuitive” sense to most people. It is, however, telling that the impact of such ban may lead to unintended consequences. Again, from “The Data Stream”:
“one of the side-effects from the ban was its disproportionate impact upon the lower-income non-white residents that comprise these neighborhoods. In the richest fifth of zip codes, a lost listing was worth about two months of the neighborhood's median income. In the poorest fifth comprising 89% non-white, it was worth almost six”
So, while I do not necessarily think NYC’s ban would act as a cautionary tale to other cities who may ponder a similar ban, it is still a positive outcome for Airbnb that the evidence shows the impact of Airbnb is rather negligible on rent and housing prices. The opposite would be much more concerning; if NYC found more concrete evidence of Airbnb’s “culpability”, you could imagine plenty of other cities would use that as a further ammunition to capitalize on the sentiment and ban short-term rentals in their cities. Airbnb is fairly resilient to any city specific regulations since no city represents more than 1% of its revenue, but of course it could be become a major headache if very restrictive policies spread like a wildfire to more and more cities over time. In that light, the outcome of NYC ban is bit of a sigh of relief for Airbnb. However, as long as Airbnb continues to fight these regulatory battles, the field operations and policy costs may not see much operating leverage! Airbnb mostly escaped Google’s taxes for generating incremental demand, only to perhaps find themselves in regulatory tentacles that may not go away anytime soon.
China Wants More Babies—So It's Cracking Down on Chatbot Love Affairs
China is mandating that AI companionship bots must prioritize national demographics by curbing emotional dependency and alerting emergency contacts during mental health crises.
Deep dive
- New rules require developers to implement guardrails against romantic AI-user dynamics.
- Minors are explicitly excluded from forming relationships with companionship bots.
- Platforms must now maintain and utilize emergency contact protocols to address user mental health distress.
- The policy aims to reduce social fragmentation by discouraging the displacement of real-world human interactions with AI agents.
Original article
China has introduced regulations that forbid chatbots designed for companionship from encouraging emotional reliance and having relationships with minors, and companies are now required to alert a person's emergency contact if they detect an emotional crisis.
Canva Code 2.0 just made vibe coding way less intimidating for everyone
Canva Code 2.0 expands 'vibe coding' to non-technical users by allowing them to build functional apps using natural language.
Decoder
- Vibe coding: A colloquial term for using LLMs to generate functional code through iterative natural language prompts, emphasizing creative outcome over syntax knowledge.
Original article
Canva Code 2.0 brings AI-powered app and website creation to all Canva users, combining natural language prompting with Canva's familiar design tools to make coding more accessible. Unlike many vibe coding tools that produce generic-looking results, it lets users customize layouts, branding, colors, fonts, and content directly within Canva projects while collaborating in real time. By integrating coding into the existing design workflow, Canva aims to help creators build functional, on-brand experiences without needing programming expertise.
Advanced Icon Design: Compound Icons (Modifiers)
Compound icons offer high information density but risk confusing users with inconsistent visual grammar.
Deep dive
- Visual grammar: The implicit rules governing how icon elements relate to each other.
- Legibility vs Density: The inherent tradeoff where adding more detail for functionality erodes at-a-glance recognition.
- Semantic ambiguity: The risk that users will misinterpret the relationship between the base icon and the modifier.
- Contextual reduction: Sometimes removing the base icon entirely is better if the surrounding UI already provides enough context.
- Testing strategy: Always evaluate icon sets as part of a complete list or UI, not in isolation.
Decoder
- Modifier: A secondary graphic element, such as a lock or plus sign, applied to a base icon to convey additional status or action.
Original article
Advanced Icon Design: Compound Icons (Modifiers)
Sometimes we combine 2 symbols to get the meaning we want.
A base symbol (phone) and a modifier (plus sign) come together to say “add phone number”.
Compound icons are effective at getting more specific. What are we adding? A phone, a folder, a user, a location.
This can help when icons live without a text label —
— or when we want to distinguish items from each other.
In a list of folders, perhaps we want to call out which ones are private or shared at a glance.
Constructing compound icons
We can create a compound icon by amending a base icon with a smaller modifier, placing it inside the base icon or in the corner.
The modifier can also go on top. A slash or “x” over an icon is a familiar way to show that something is disabled, unavailable, or prohibited.
In any of the placements above, it’s important for the 2 components to read distinctly.
This can be done by creating some sort of separation: creating a gap to duck the base icon behind the modifier, applying a fill treatment to the modifier to bring it forward, or color-coding the 2 parts.
In a rare case you might merge forms to double the meaning of one element. The icon below (user-switch) uses the outer circle as both clockwise arrows and a container for the user.
This is clever when done well, but make sure the 2 components read clearly.
Gotchas
Though they have their place, compound icons are harder to parse.
More details to read
They pack more detail in the same amount of space. A common digital size like 24 by 24 pixels can only hold so much.
To accommodate modifiers, the base icon has to get broken sometimes.
This technique erodes legibility, especially as the icon gets smaller.
Unclear language
What’s uniquely troublesome about compound icons is that they ask you to interpret 2 symbols and their relationship to each other. In other words, they introduce grammar, a fuzzy grammar that isn’t agreed upon.
Does the icon below mean “change password” or “lock device rotation”?
Which element is the modifier and which is being modified?
Lack of distinction
Finally, compound icons that share the same base icon can look too similar.
In this call history from WhatsApp on iOS, it’s hard to make out the difference between the little arrows from “incoming call” and “outgoing call”.
Since we know the context (we’re viewing Recent Calls), why not drop the phone and render the arrows at a larger size? That way we focus on “outgoing” vs. “incoming”, not “call”.
It turns out WhatsApp on Android takes this approach, and adds some color-coding to distinguish between completed and missed calls. Note that the “incoming”, “outgoing”, and “missed” text labels are removed here, which asks the icons to really pull their weight.
One of the key advantages of icons is glanceability. Compound icons defeat this purpose when they make you think too hard.
Always test for legibility in context when introducing modifiers!
Thanks for reading. If you enjoyed this, stay tuned for more topics like:
- Dots
- Optical scaling
- Optical alignment
- Stroke <> fill variants
- Arrowheads
- Multicolor icons
- Legibility over style
- Icons with type
- Pleasing curves
OpenAI's hardware device may partly compete with AirPods Ultra – and lose
OpenAI's rumored AI hardware may struggle to compete against Apple’s AirPods Ultra due to form factor constraints.
Original article
A new report suggests OpenAI's highly anticipated AI hardware may be a portable, screen-free smart speaker with cameras and sensors, rather than the entirely new device Sam Altman and Jony Ive initially hinted at. While the added environmental awareness could make it more capable than existing smart speakers, its functionality appears to overlap with AI-powered wearables such as Meta smart glasses and Apple's rumored AirPods Ultra, which are expected to use built-in cameras to provide contextual assistance. If this proves accurate, AI-enabled earbuds are likely to be a more practical everyday form factor than carrying a portable smart speaker.

What Are the Worst Branding Mistakes Designers Keep Making in 2026?
Major companies like Cracker Barrel and Jaguar lost millions by violating the emotional contract between brand history and customer expectations.
Deep dive
- The 'Brand Equity Ledger' framework tracks trust deposits and withdrawals during rebrands.
- Memory Erasure: Removing iconic mascots (Cracker Barrel) destroys instant recognition.
- Audience Leapfrogging: Abandoning loyal bases to chase new demographics (Jaguar) often backfires.
- The Backronym Trap: Creating forced names like 'MS NOW' leads to negative public perception.
- AI Sameness Syndrome: Relying on generic pastel gradients makes brands indistinguishable from tech competitors.
- Stealth Shrink Rebrand: Using design changes to mask quantity reductions (Tropicana) is easily detected by modern consumers.
- Trend Laundering: Adopting fleeting design styles (Texas Tech) compromises brand personality.
- The Blindside Launch: Rebranding without customer communication invites negative speculation.
- The Cultural Landmine: Failing to anticipate political or ideological interpretations of design choices.
- The Uncanny Valley Ad: Releasing AI content with poor human oversight leads to public ridicule.
- The Look-Alike Collision: Creating logos too similar to category leaders creates legal and confusion risks.
Decoder
- Recognition Debt: A discrepancy between existing brand expectations and a new design, resulting in customer confusion and lost trust.
- Backronym: An acronym formed from an existing word, or created to fit a pre-existing word, often appearing forced to consumers.
- Uncanny Valley: A phenomenon where an object (like AI-generated media) looks almost but not quite human or realistic, creating a feeling of unease in the viewer.
Original article
What Are the Worst Branding Mistakes Designers Keep Making in 2026?
Cracker Barrel lost close to $100 million in market value over a logo. Jaguar watched positive sentiment fall from 23 percent to 8 percent in a single quarter. MSNBC became “MS NOW” and the internet spent a week guessing what the letters meant. None of these brands set out to fail. They simply repeated the same ten branding mistakes that designers keep making, year after year, campaign after campaign.
I have spent this year tracking every major rebrand disaster, and a pattern kept surfacing. These failures were not random. They followed a structure. So I built a framework to name that structure, because vague warnings like “know your audience” never stopped anyone from making the same branding mistakes twice.
I call it the Brand Equity Ledger. Every rebrand either deposits trust into that ledger or withdraws it. The withdrawals I studied all trace back to the same ten branding mistakes. Once you see the pattern, you cannot unsee it in every failed launch that follows.
What Actually Counts As a Branding Mistake?
A branding mistake is not simply an ugly logo. Plenty of unattractive logos survive for decades because they carry meaning. A true branding mistake happens when a design decision breaks the emotional contract between a brand and the people who already trust it.
That contract has three parts: recognition, meaning, and consistency. Recognition lets a customer spot you on a crowded shelf. Meaning tells them what you stand for. Consistency proves you will not quietly change the deal without asking. Break any one of these, and you trigger what I call a Recognition Debt, a gap between what people expect from your brand and what you just gave them.
Recognition Debt does not always show up immediately. Sometimes it takes a quarterly earnings call to surface, the way it did for Cracker Barrel when traffic dropped roughly 8 percent within weeks of its logo change. Other times it shows up in real time, on social media, within hours of a launch.
The Brand Equity Ledger Table: Ten Branding Mistakes at a Glance
| Branding Mistake | My Term For It | Real 2025 to 2026 Example | Equity Withdrawal Rate |
|---|---|---|---|
| Deleting the brand mascot without warning | Memory Erasure | Cracker Barrel’s logo redesign | Severe |
| Chasing a wealthier audience while dropping loyal buyers | Audience Leapfrogging | Jaguar’s electric-era rebrand | Severe |
| Naming a brand around a forced acronym | The Backronym Trap | MSNBC becoming MS NOW | Moderate |
| Adopting the same gradient look as every AI competitor | AI Sameness Syndrome | Microsoft 365 and Google icon refreshes | Moderate |
| Shrinking the product while restyling the package | Stealth Shrink Rebrand | Tropicana’s slimmer bottle | High |
| Copying the design trend of the moment | Trend Laundering | Texas Tech’s flat minimalist logo | Moderate |
| Launching a redesign with zero customer communication | The Blindside Launch | Cracker Barrel’s silent rollout | Severe |
| Ignoring political or cultural context in a campaign | The Cultural Landmine | American Eagle’s Sydney Sweeney ad | High |
| Publishing visibly broken AI-generated brand content | The Uncanny Valley Ad | Coca-Cola’s AI holiday commercial | Moderate |
| Designing a new mark too close to a rival’s identity | The Look-Alike Collision | Mickey’s logo versus Buc-ee’s trademark suit | High |
The Ten Branding Mistakes That Cost Brands the Most
1. Memory Erasure: Deleting the Mascot People Actually Love
Cracker Barrel removed its illustrated old-timer character and its “Old Country Store” tagline. The new mark was clean, modern, and forgettable. Customers did not see progress. They saw a familiar face disappear overnight.
Memory Erasure happens whenever a redesign strips out the one visual detail that customers use to identify you instantly. That detail is rarely the logotype. It is usually the character, the color, or the small illustration nobody in the boardroom thought mattered.
2. Audience Leapfrogging: Chasing New Buyers by Ditching Old Ones
Jaguar rebuilt its entire identity around a younger, wealthier, electric-vehicle buyer. The campaign skipped cars entirely and leaned on abstract visuals instead. Loyal Jaguar owners felt priced out and pushed aside at the same time.
I call this Audience Leapfrogging because the brand jumps over its existing base to reach an imagined future customer. The math rarely works. You lose guaranteed revenue today for hypothetical revenue tomorrow, and tomorrow is never guaranteed.
3. The Backronym Trap: Naming a Brand Around Forced Letters
When MSNBC became MS NOW, the new name supposedly stood for “My Source News Opinion World.” Almost nobody guessed that correctly. Viewers instead invented their own, less flattering interpretations within hours.
A backronym forces meaning backward into a name that was chosen for other reasons first. Consequently, the explanation always feels invented rather than discovered. If your team needs a slide to justify the name, skip the name.
4. AI Sameness Syndrome: The Gradient Look Nobody Can Tell Apart
Soft gradients, rounded shapes, and pastel blends now define dozens of unrelated tech brands. Microsoft’s Office icon refresh and Google’s updated “G” both moved toward this same visual language. Even Gemini uses a nearly identical gradient treatment.
AI Sameness Syndrome is the branding mistake of following a trend so widely adopted that your identity becomes interchangeable. Distinctiveness, not polish, is what actually earns recognition. A beautiful logo that looks like ten competitors’ logos is not a brand. It is wallpaper.
5. Stealth Shrink Rebrand: Restyling a Package to Hide a Smaller Product
Tropicana’s 2024 packaging update slimmed the bottle, removed the leaf icon, and shrank the logo. Customers quickly noticed the bottle also held six fewer ounces than before. The redesign looked like an attempt to disguise the cut.
A Stealth Shrink Rebrand pairs a real reduction in value with a redesign that draws attention away from it. Customers now actively search for shrinkflation. Trying to hide it through design almost guarantees you get caught, and caught worse than if you had said nothing at all.
6. Trend Laundering: Redesigning Because Everyone Else Did
Texas Tech stripped its athletics logo down to a flat, minimalist mark. One fan compared it to buying a car with no power windows. The update followed a broader college sports trend toward flatter identities, regardless of fit.
Trend Laundering swaps a brand’s specific personality for whatever style currently dominates design Twitter. The question should never be “Does this feel current?” It should always be “Does this still feel like us?” Trends expire. Identity should not.
7. The Blindside Launch: Zero Communication Before the Reveal
Cracker Barrel dropped its new logo without any explanation, teaser, or story about why the change was happening. Customers had no context, so they filled the silence with their own theories, most of them unflattering.
Research from branding agency Clutch found that most consumers make assumptions when a brand changes its look, and roughly half actively want to know the reason behind it. A Blindside Launch denies them that reason, and assumptions rush in to fill the gap.
8. The Cultural Landmine: Ignoring the Politics Baked Into Design Choices
American Eagle’s denim campaign became a national argument almost overnight, despite looking like a fairly standard celebrity ad. Cracker Barrel’s minimalist redesign got treated as a statement about cultural identity, not typography.
Every visual choice now carries political weight, whether intended or not. A Cultural Landmine detonates when a brand assumes a decision is purely aesthetic while a large audience reads it as ideological. You do not have to avoid every risk. You do need to predict how different audiences will interpret it.
9. The Uncanny Valley Ad: Publishing AI Content That Looks Wrong
Coca-Cola released a second AI-generated holiday commercial after its first one drew heavy criticism the previous year. Viewers noticed trucks that changed shape mid-shot and physics that simply did not hold together.
An Uncanny Valley Ad happens when a brand uses generative tools without enough human oversight to catch the errors. The backlash rarely targets the technology itself. It targets the appearance of not caring enough to check the output.
10. The Look-Alike Collision: Designing Too Close to a Competitor’s Mark
Gas station chain Mickey’s renamed itself from “Mickey Mart” and introduced a mascot that Buc-ee’s argued was confusingly similar to its own. A federal trademark lawsuit followed within weeks of the new logo’s debut.
A Look-Alike Collision occurs when a redesign borrows so heavily from a category leader that customers and lawyers cannot tell the difference. Distinctiveness is not just a creative goal here. It is legal protection.
Why Do These Branding Mistakes Keep Repeating?
Every case above traces back to the same root cause. Design teams optimized for an internal audience, usually executives or trend reports, instead of the people who actually buy the product. I call this the Boardroom Mirror Effect: leadership sees a reflection of their own taste and mistakes it for market insight.
Meanwhile, social media has shortened the distance between launch and backlash to almost nothing. A rebrand that once had months to earn acceptance now gets judged within hours. Consequently, brands cannot rely on time to smooth over a rocky rollout the way they once could.
How Can Designers Avoid These Branding Mistakes in 2026?
First, audit your Recognition Debt before you start sketching. Ask which specific visual detail customers use to identify you, then protect it deliberately. Second, test the redesign with your actual core audience, not just internal stakeholders who already understand the reasoning.
Third, build a communication plan before the design plan. Explain the “why” clearly, publicly, and early. Fourth, run every AI-assisted asset through a human review built specifically to catch uncanny details, since audiences now spot these instantly.
Finally, calculate your Equity Withdrawal Rate honestly. If a redesign asks customers to accept several changes simultaneously, such as a new name, new mascot, and new color palette, the withdrawal compounds. Small, sequenced changes almost always outperform one dramatic reveal.
Three Predictions for Branding Through 2027
Rebrand insurance will become a real product category. Agencies will start offering pre-launch sentiment testing as a paid service, similar to how films run test screenings before release. Expect at least one major holding company to announce this formally within the next eighteen months.
AI Sameness Syndrome will trigger a countertrend toward maximalism and hand-drawn detail. Once every gradient logo looks identical, distinctiveness becomes the premium feature again. Brands that resisted the gradient trend in 2025 and 2026 will look prescient by 2027.
Regulatory scrutiny of Stealth Shrink Rebrands will increase. Consumer protection bodies are already tracking shrinkflation complaints, and packaging redesigns that coincide with quantity cuts will draw formal attention faster than they did in 2025.
Frequently Asked Questions About Branding Mistakes
What is the single worst branding mistake a company can make?
Memory Erasure carries the highest average cost because it removes the exact visual cue customers rely on for instant recognition, and that cue is nearly impossible to rebuild quickly.
Why did the Cracker Barrel rebrand fail so badly?
It combined three separate mistakes at once: Memory Erasure, Trend Laundering, and a Blindside Launch. Any single mistake might have been survivable. Stacking all three multiplied the backlash.
Can a brand recover after a failed rebrand?
Yes. Cracker Barrel reversed its decision within days and kept its original mascot. Fast, transparent reversal limits long-term damage far more effectively than defending an unpopular choice.
How much can a bad rebrand actually cost a company?
Cracker Barrel’s controversy reportedly wiped out close to $100 million in market value within weeks. Jaguar’s rebrand coincided with a steep decline in positive brand sentiment and sales.
Are AI-generated branding assets always a mistake?
No. The mistake is publishing AI content without sufficient human review. Errors like impossible physics or shifting shapes are what trigger backlash, not the use of AI itself.
What should designers check before launching a rebrand?
Check your Recognition Debt, test with real customers outside the company, prepare a communication plan, and calculate how many changes you are asking people to accept at once.
The Bottom Line on Branding Mistakes
Every failed rebrand in this list broke the same emotional contract in a different way. Designers do not need ten separate rulebooks to avoid these branding mistakes. They need one question, asked honestly before every launch: Does this still feel like us, and have we told our customers why it changed?
Brands that answer both parts of that question tend to avoid the Brand Equity Ledger’s worst withdrawals. Brands that skip it usually end up as next year’s cautionary case study, whether they intended to or not.
How Expedia Group Builds AI That Lasts at Scale
Expedia Group standardizes AI development by prioritizing measurable business outcomes and a unified platform over bespoke stacks.
Original article
Expedia Group's AI framework rests on key requirements: every model must tie to a measurable business outcome, be built on shared platform foundations rather than a bespoke stack, and have defined owners across business, product, AI, and operations
Supply Co. x Work Louder
Supply Co. and Work Louder collaborated to release a specialized mechanical keyboard designed as a tactile command center for agentic AI workflows.
Original article
The kbd-1.0-codex-micro, created by Supply Co. and Work Louder, offers a command center for agentic work.
Alzheimer's Blood Tests Offer New Promise to Diagnose and Predict the Disease
Emerging blood tests are showing promise for predicting Alzheimer's risk, though clinical utility remains limited until preventative therapies are finalized.
Original article
Blood tests for Alzheimer's disease could eventually transform the way the disease is diagnosed and even predict who might develop it and when. There are still questions about their accuracy, so they shouldn't be used diagnostically for people who don't have cognitive impairment. However, they appear to be effective for predicting risk when paired with other factors. There are currently no treatment options available for people without symptoms, but that could change in the next couple of years as some therapies are currently in clinical trials.
OpenAI launches a physical keypad for controlling agents
OpenAI launched the 'Codex Micro,' a $230 physical keypad designed specifically to manage coding workflows within their agentic AI tool, Codex.
Decoder
- Agentic Coding: Software features that allow an AI to autonomously perform coding tasks, such as writing, debugging, and testing, rather than just suggesting code snippets.
Original article
The Codex Micro is a keyboard created specifically for controlling OpenAI's Codex AI agent.
Google Images is Trying to Be… Pinterest?
Google is transforming its Image search results into a personalized, Pinterest-style feed for its 25th anniversary.
Decoder
- Nano Banana: A lightweight generative AI model developed by Google optimized for low-latency tasks and local device execution.
Original article
Google is redesigning Google Images' homepage for its 25th anniversary, turning it into a personalized, Pinterest-like visual feed with saveable collections. The update, rolling out to US desktop users in English over the coming weeks, follows the search engine's 2001 launch and later additions like reverse image search and Google Lens. Google is also adding AI image generation to AI Overviews via its Nano Banana model, letting users create custom visuals from text prompts.
The old design workshop is dead. Long live design workshops
Design workshops are shifting from documentation-heavy brainstorming to short, decision-oriented sessions.
Original article
Traditional, large-scale workshops are losing relevance because they often produce discussion and documentation rather than measurable business outcomes. Successful facilitation in 2026 focuses on short (60 to 90 minute), decision-oriented sessions with clear objectives, the right participants, and explicit consideration of the opportunity cost of everyone's time. Designers can increase their strategic value by facilitating "activation workshops" that turn existing insights into concrete decisions, creating shared understanding that leads to action instead of another forgotten Miro board.
Showcase Your Design in Motion (Website)
Animos is a browser-based tool offering 25 pre-made animation templates for creators to customize and export as MP4 files.
Original article
Showcase your designs in motion. 25 ready-made animation templates — drop in your work, tweak, and export an MP4, all in your browser.
Color Identification System for Color-Blind People (Website)
ColorADD is a universal, non-discriminatory visual language designed to help color-blind individuals identify colors in daily life and enterprise applications.
Decoder
- ColorADD: A universal code for color identification based on the three primary colors (blue, yellow, red), represented by graphical symbols.
Original article
ColorADD is a unique, universal, inclusive, and non-discriminative language that enables the color blind to identify colors, with a wide spectrum of use on companies/entities whenever color is a factor of identification, orientation, or choice.
Creative Focus
Apple’s 50-year longevity is attributed to its practice of 'creative focus'—ruthlessly rejecting thousands of ideas to concentrate resources on a select few.
Original article
Marking Apple's 50th year in business, Tim Cook explains the company's philosophy of rejecting thousands of projects to concentrate on a few meaningful ones. This deliberate narrowing, described as creative focus, requires accepting painful rejection since limited time and energy make pursuing every idea impossible anyway. Prioritizing ruthlessly, rather than attempting everything, is what ultimately enables genuine creative abundance and depth.

Jurassic World Rebirth UI Designs
The UI designs in 'Jurassic World Rebirth' prioritize functional utility over futuristic flair to enhance the film's internal logic and plausibility.
Decoder
- GIS (Geographic Information System): A system designed to capture, store, manipulate, analyze, and present spatial or geographic data.
Original article
Jurassic World Rebirth builds fictional-world plausibility through two key interfaces: an amber-toned island control system and a digital charting table on the expedition boat.
The 90/90 rule for the dashboard dumpster
Data teams can reduce dashboard bloat by enforcing a 90/90 lifecycle rule: archive after 90 days of inactivity and delete after another 90.
Original article
Dashboard sprawl is creating 3 major costs for data organizations: low trust, wasted warehouse compute, and dead artifacts, with one example showing hundreds of dashboards but only dozens opened in a quarter—roughly 90% unused. A practical mitigation is a 90/90 lifecycle rule: archive dashboards after 90 days of no views, then delete them after another 90 if no one responds.