Devoured - July 20, 2026
The industry is shifting from pure model-building toward infrastructure-heavy AI engineering, as evidenced by tools like GitLab 19.2 and k8s-aibom that prioritize agent observability, automated evaluation, and cost management. As platforms like Databricks and AWS refine low-latency data access for inference, developers are increasingly focused on replacing manual RAG workflows with portable, context-aware harnesses to achieve production-grade reliability.
How Netflix Built Its LLM Serving Stack
Netflix built its own LLM serving stack on vLLM and NVIDIA Triton to avoid silos, moving away from closed-source inference engines.
Deep dive
- Engine Selection: Switched from TensorRT-LLM to vLLM to support custom architectures and native extensibility for decoding logic.
- Packaging: Adopted dynamic I/O tensor spec generation in Triton's vLLM backend to allow frontend and model evolution to occur independently.
- API Design: Exposed an OpenAI-compatible HTTP frontend alongside standard gRPC to maintain consistency with industry tooling.
- Deployment: Used 'Versioned' deploys for breaking I/O changes and 'Red-Black' for stable updates to ensure zero-downtime rollouts.
- Observability: Built a custom HTTP proxy to merge vLLM-on-disk Prometheus metrics with Triton’s server-level metrics into a single endpoint.
- Decoding: Implemented batch-level logits processors in C++ to replace serial Python code, eliminating performance bottlenecks in constrained decoding.
Decoder
- vLLM: An open-source library for high-throughput LLM inference that optimizes memory management using PagedAttention.
- Triton Inference Server: An open-source software by NVIDIA that standardizes AI model deployment and execution across multiple frameworks.
- Constrained Decoding: A technique that forces an LLM to generate output following specific formats or rules, such as valid JSON, by intercepting and masking tokens during generation.
- Logits Processor: A function that modifies the probability distribution of the next token before the sampling step, used here to enforce constraints.
Original article
In-House LLM Serving at Netflix
By AI Platform’s Model Runtime team and Inference team
Introduction
Most organizations consume LLMs through hosted APIs. Netflix went further — we run the full stack ourselves, from model deployment through inference, inside our existing production environment rather than a separate ML silo. Some of those decisions weren’t obvious, and a few revealed their trade-offs only under production load.
This post focuses on the choices where alternatives were seriously considered: engine selection, model packaging, API surface design, deployment strategy, and output constraints enforcement. The goal is to share not just what was built, but why — and what production revealed that the design phase didn’t anticipate.
Architecture Overview
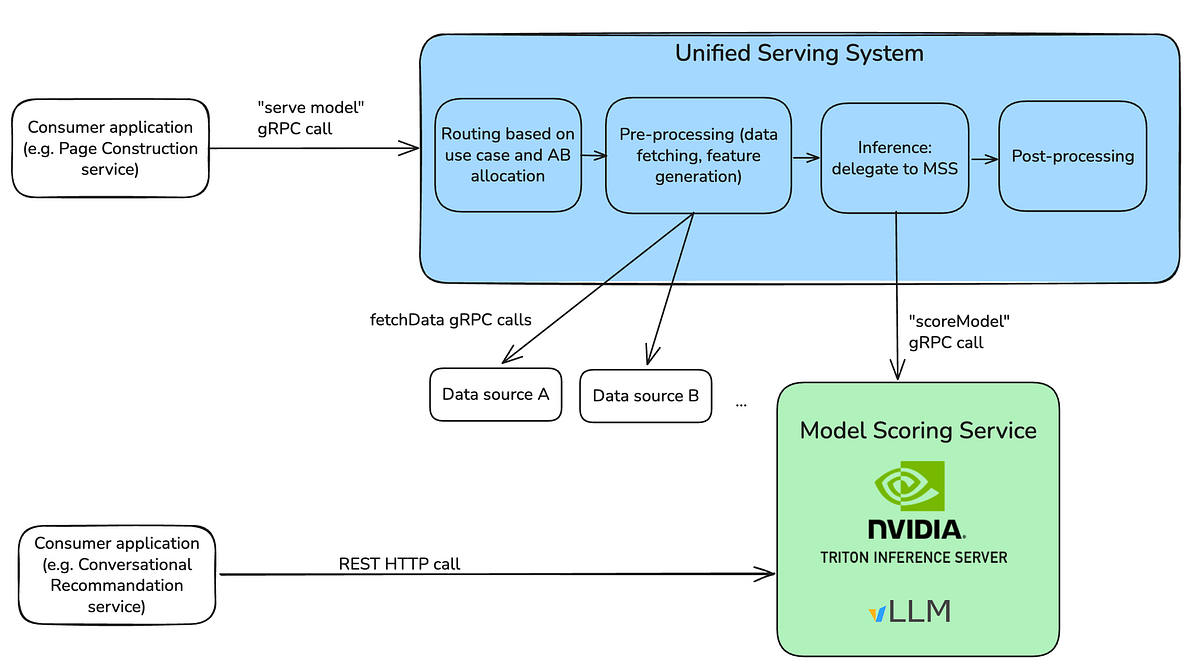
Member-scale ML at Netflix is fronted by a unified JVM-based serving system that handles the end-to-end flow for downstream consumers: routing and A/B test logic, candidate generation, feature fetching, inference, post-processing, and logging at each stage. Both real-time and cached batch paths are supported. There are two ways callers reach inference today: the gRPC path through this serving system and a direct HTTP path used by newer LLM-driven applications.
Where inference runs depends on the model. Small CPU models run in-process, avoiding remote-call overhead. Larger models need GPUs — the serving system handles pre- and post-processing locally but delegates inference to a remote service, Model Scoring Service (MSS). MSS is the shared inference backend, supporting XGBoost, TensorFlow, PyTorch, and LLMs behind a unified interface, with NVIDIA Triton Inference Server underneath managing model loading, batching, and GPU scheduling.
On top of Triton sits a Java control plane that handles deployment, versioning, health checking, autoscaling, and multi-region rollout. Model authors package their artifacts and configure the deployment; the control plane provisions GPU instances, configures Triton, and orchestrates zero-downtime upgrades.
Design Decisions and Implementation
Four decisions shape this platform — engine, packaging, API surface, and rollout — presented in dependency order, since each one constrains the next.
vLLM as the Paved-Path Engine
The platform was originally built on TensorRT-LLM, a performant inference engine at the time and already integrated with Triton — the compute backend in use within MSS.
By summer 2025, two things had shifted: open-source engines had largely closed the performance gap with specialized stacks, and our workload mix had broadened to include embedding generation, prefill-only inference for ranking and retrieval, autoregressive decoding, and custom models with non-trivial per-step constraint logic. We re-benchmarked against this mix and selected vLLM as our paved-path engine on operational fit:
- Loads custom model architectures without a multi-step compilation pipeline — faster iteration on non-standard models.
- Extensibility hooks for custom decoding logic — necessary for the constrained-decoding work described later.
- Debuggability — easier to inspect failures and intermediate state than with a compiled engine in earlier TensorRT-LLM.
- Familiarity — many ML practitioners were already using vLLM in research, which cut the research-to-production handoff cost.
Integrating vLLM into Triton
With vLLM picked, the next decision was how to package models for it. Triton supports two ways, and the choice has significant implications for maintainability — specifically, how tightly model artifacts are coupled to frontend upgrades.
- Python backend. The author defines explicit input/output tensor specs at packaging time. These specs are frozen in the artifact and must match what the third-party vendor’s frontend’s request builder expects, so every frontend upgrade that touches I/O specs requires a coordinated change to packaging code; otherwise, requests fail at runtime.
- vLLM backend. The artifact is just a JSON config pointing to the model weights and tokenizer. Triton’s vLLM backend reads this config and generates I/O tensor specs dynamically at deployment time — the author never defines them. Models and frontend evolve independently.
The vLLM backend is the architecturally correct default. Two things bit us in production:
- Triton/vLLM version mismatch. Triton’s vLLM backend is compiled against a specific vLLM API surface. When the two drift — for example, Triton 25.09 importing vllm.engine.metrics, a module removed in vLLM 0.11.2 — the backend fails to load entirely. The platform has to pin compatible versions when baking the service image, and prevent model authors from overriding the vLLM version at packaging time.
- Custom model logic. The vLLM backend expects a standard HuggingFace-compatible model and handles the full inference lifecycle. Models needing custom preprocessing, postprocessing, or non-standard execution — ensemble pipelines, custom tokenization — must use the Python backend, which gives full control over execute(). This escape hatch will likely remain necessary for a subset of models.
Ecosystem-Compatible HTTP Frontend
With engine and packaging settled, the next question is how callers reach the system. A key design goal of our system was that LLM models should NOT be special snowflakes. Every model — XGBoost ensemble or large-scale LLMs — is scored via the same gRPC call, so we reuse the same client libraries, health checking, and deployment pipelines. Given that the OpenAI-compatible API interface has become the de facto interface for the LLM ecosystem — inference engines, orchestration frameworks, evaluation tools, and client libraries all speak it — so we expose the OpenAI-compatible API as an additional frontend alongside gRPC.
The payoff shows up in the experimentation-to-production path: graduating from a hosted model to a fine-tuned self-hosted one — for quality, latency, cost, or data privacy — is nearly seamless. Same API, minimal code changes.
Behind the API, the implementation reuses NVIDIA’s Triton OpenAI-compatible frontend. It starts an embedded Triton server, wraps it in a TritonLLMEngine that converts request schemas into Triton inference requests, and serves responses through FastAPI. KServe HTTP/gRPC frontends are enabled alongside, so the same Triton instance remains accessible to the Java control plane over gRPC. Adopting Triton’s frontend directly exposed one gap: response_format — accepted by the schema — was silently dropped before reaching vLLM, so that a caller requesting JSON output proceeded without guided decoding constraints and could receive malformed JSON with no error surfaced by the platform. We git-subtreed and patched the frontend to translate response_format into vLLM’s guided decoding parameters at request time.
Deployment Strategies
With API surface and engine in place, the question that remains is how new versions roll out without dropping requests. GPU deployments take longer to bring up than CPU services, and the I/O schema may change between model versions — adding a coordination problem on top. The platform offers two strategies:
- Red-Black deploys a new version alongside the current one. Once the new instance passes health checks, traffic shifts in phases — the new version scales up while the old scales down at the same rate. If any step fails, the system triggers an atomic rollback. Red-Black is the right choice when the model interface is stable. Production revealed a coordination gap when a new version requires an I/O schema change (e.g., new tensor dimensions): the upstream consumer can’t update its config until the new model is fully live, so it inevitably sends “old” requests to a “new” deployment during the migration window, and those fail.
- Versioned solves that gap by maintaining an independent deployment for every (modelId, modelVersion) pair. Multiple versions serve simultaneously, decoupling model deployment from consumer updates: the consumer waits for the new version to be fully ready before switching its config, while the old version keeps serving legacy traffic. The platform cleans up older deployments after inactivity but always preserves the latest. The trade-off is a temporary increase in GPU cost during the transition overlap.
We recommend embedding variable configurations (e.g., tensor shapes) directly into the inference model to make it version-agnostic, so it can use the cheaper Red-Black path. Versioned is reserved for the rare cases where a breaking interface change is unavoidable.
Operational Notes
Beyond those four decisions, two operational details are worth flagging — both hit production gaps the design phase didn’t anticipate.
Boot sequence
Bringing a vLLM-on-Triton instance up involves several coordinated steps before the gRPC port opens. Two are non-routine.
- Model caching. Downloading large LLMs directly from S3 or Hugging Face at startup is slow enough to inflate cold-start latency past what schedulers tolerate. We materialize models on Amazon FSx at the time of model announcement, so warm starts hit a high-performance file system instead of object storage.
- Embedded vs standalone Triton. When consumers need the OpenAI-compatible API, Triton runs as an embedded server inside the OpenAI-compatible frontend process; otherwise, it runs standalone. This is configured per-deployment at packaging time.
Unified metrics endpoint
The Prometheus cleanup above hints at a wider observability gap. vLLM writes metrics to PROMETHEUS_MULTIPROC_DIR as .db files; Triton reports server-level metrics through its own Prometheus endpoint. Neither is aware of the other, and Triton’s built-in bridge surfaces only 9 of 40+ vLLM metrics — missing critical ones like token throughput, KV cache utilization, and prefix cache hit rates.
We added a lightweight HTTP proxy that merges both into a single /metrics endpoint: it fetches Triton metrics via HTTP, reads vLLM metrics from disk using Prometheus’s MultiProcessCollector, and returns the combined output. Existing dashboards and alerts work without modification.
Deep-Dive: Constrained Decoding at Scale
Some Netflix production workloads rely heavily on fine-grained control over token generation. Rather than applying business logic after inference — paying for invalid generations, then retrying or repairing — we push constraints inside the decode loop, so the model generates outputs that are compliant by construction. We implement this via vLLM’s custom logits processor interface, modeling each constraint as a state machine that evolves with the generated token history and emits token-eligibility masks at each step. Each request gets its own configured processor, since different requests apply different rules.
Why the first implementation didn’t scale
Our initial pure-Python implementation worked functionally but hit a scaling bottleneck. In vLLM V0, custom logits processors run per-request: the GPU produces logits for the whole batch, the CPU copies them across and waits for the transfer, and then constraint logic runs sequentially for each request — sequentially because the GIL prevents Python from parallelizing the per-request work. CPU time in logit processing therefore grows linearly with batch size, hitting tail latencies. End-to-end latency becomes CPU-bound even though the model’s forward pass is batched efficiently on GPU.
vLLM V1 enabled a batch-level design
The structural fix arrived in vLLM V1, which moved logits processing to batch level. We rewrote our custom processor to operate on batch-level data structures, computing masks across many requests together, and reimplemented the hot path in C++ with multi-threading to step around the GIL. The V1 API requires explicit tracking of batch membership changes via update_state(batch_update) — more complex than V0’s per-request interface, but necessary to maintain correct state in a dynamically evolving batch.
Operational hardening
- Partial prefills. V1 performs chunked prefilling, so a request can be prefilled over multiple engine steps. BatchUpdate lacks the granularity to tell whether a request was fully or only partially prefilled, so we added internal tracking.
- Preemption. Under memory pressure, vLLM may evict a partially completed request’s KV cache and reschedule it later with a different prompt and output token list. This breaks the state machine’s assumption that the output token list grows monotonically. We detect when the token history shrinks between decode steps, reset the state machine, and reinitialize from the new prompt.
Wrap up
We set out to build an LLM serving platform for broad production ML requirements — low latency, deep customization, and integration with existing infrastructure. The result is a system on vLLM and Triton, unified behind a consistent API, designed to give ML practitioners a fast path from experimentation to production.
The lessons were often in the details — version pinning, silent API gaps, packaging trade-offs — but addressing them has made the platform meaningfully more robust and the developer experience smoother.
Contributions
This system is the result of close collaboration and contributions from many teams within the AI Platform org at Netflix. In particular, Liping Peng designed and developed the model packaging workflow and drove the integration of Triton and vLLM with MSS to enable a unified pathway for serving LLMs. Hakan Baba, Nicolas Hortiguera, and ZQ Zhang led GPU capacity planning, system performance tuning, application integration and observability, as well as A/B test readiness and operational excellence efforts for all production models. Santino Ramos enabled vLLM for production models and optimized constrained decoding performance. Binh Tang developed the initial version of custom model serving and benchmarked different LLM serving frameworks. Lanxi Huang and Daneo Zhang built the serving development tools to enable user self-service. Lingyi Liu drove the overall system architecture and core technical decisions. Abhishek Agrawal and Shaojing Li provide management leadership to ensure alignment, prioritization and execution.
Acknowledgements
This work heavily leverages open-source ML libraries, such as Triton, vLLM and PyTorch, etc. We’re especially grateful to the teams and contributors from the community. We also thank our partner teams in Netflix AI for Member Systems for their close collaborations and innovation on the modeling side.
I burned all my tokens researching how to save tokens
Efficient AI research requires a tiered model pipeline where cheap models find information, accurate models verify claims, and heavy models handle synthesis.
Deep dive
- Cost Optimization: Using specific models for discrete tasks significantly extends research duration compared to using one frontier model for everything.
- Hallucination Prevention: Implement strict rules requiring every claim to be backed by a URL and quote, verified by a different model than the one that found it.
- Context Compaction: Automated context reduction can trigger recurring billing of the same tokens if thresholds are too aggressive, leading to unexpected invoice spikes.
- Harness Dependency: The agentic harness (code structure) impacts performance; thin, optimized harnesses can outperform heavy ones on the same model.
- Tool Change Costs: Adding or changing a tool schema mid-session invalidates cache, causing the entire prefix to be re-billed at full input prices.
Decoder
- Tokenomics: The economic study of token usage and costs associated with running AI models, including latency, context windows, and model orchestration.
- Context Compaction: A process used by AI agents to summarize older conversation history into a smaller prompt to save space in the model's limited context window.
- Inference Pipeline: A sequence of automated steps where data flows through different AI models or tools, each performing a specific transformation or check.
Original article
At Quesma we are researching the economics of AI agents: what agentic coding really costs and what you can do about it. For this research I am running my own deep research setup, a pipeline of agents that builds a knowledge base I can actually trust. The first version of this setup burned the whole limit of my Claude Max 5x plan in 30 minutes. This post is the story of how I fixed the cost and the trust, using only subscriptions I already pay for, and how you can build the same.
My goal was to understand the entire state of so-called tokenomics. I wanted to know what monitoring systems exist, how teams govern their AI spend, and which optimization tools and practices actually work, both in the papers and in the real world.
I started the usual way, with /deep-research. I gave it the big open question and let it run. After around 30 minutes of research, I hit a limit and had to wait a few hours for it to reset. And I had no results. The run launched 111 agents and queued 123 claims for verification, but only 25 got verified before the limit hit, and the final synthesis never ran.
So, it hit me personally. And this is a bit funny: from the very first day I had to optimize tokens while still discovering how to optimize tokens. Learning by doing.
Using every subscription I already pay for
If Claude Fable 5 is out after 30 minutes and /deep-research is consuming so many tokens without giving me any results, what can I do to make the research more effective? I started thinking about what kind of tools I already have and pay for. Claude, Codex, and Antigravity: 3 subscriptions, and in theory 3 times more tokens without paying anything extra. What if I use all of these tools together, with shared memory?
Since I am already using the claude-mem plugin I extended it to support Codex and Antigravity locally, so that all 3 tools can use shared memory during sessions. Whatever one tool learns, the others can use.
Cheaper models as subagents
My default setup is Claude Code, so I used it as the main harness. While doing the research manually, I discovered a model-orchestration pattern, which was exactly what I needed at that moment. We don’t really need Fable for everything: Claude Opus 4.8, Claude Sonnet 5, GPT-5.5, and Gemini 3.1 Pro are already excellent models for many tasks.
So I checked a few benchmarks and cost analyses, mostly Terminal-Bench for terminal and agentic work, SWE-bench Pro for end-to-end software engineering, and Artificial Analysis for a general view of performance and prices. I did not treat any of them as the final truth; benchmarks measure their own thing and the numbers move every month. I just needed a loose starting point for who is good at what, and using several different models was part of the experiment from the beginning; I expected to adjust the split after real runs anyway:
| Role | Model | Why this one |
|---|---|---|
| Find | Claude Sonnet 5 | Strong on agentic benchmarks and cheap enough to run in bulk |
| Verify | Claude Opus 4.8 | The most accurate Claude worker; checking needs more accuracy than searching |
| Judge & plan | Claude Fable 5 | The most expensive one, so it only plans, decomposes, and resolves disputes |
| Small stuff | Claude Haiku 4.5 | Cheap and fast for extraction and formatting, too weak for multi-step work |
| Run tools | Codex (GPT-5.5) | Very strong on terminal benchmarks; clones, installs, runs, and inspects tools |
| Second opinion | Antigravity (Gemini 3.1 Pro) | A different model family, so it does not share the same blind spots |
This split was not my first version; I adjusted it a few times when live runs showed weaknesses, and the fallback rules came from those failures.
The best thing here is that I prepared Codex and Antigravity to be used as Claude subagents, orchestrated by Fable, using the headless nature of both. Why is it cool? Because tokens are taken from the Codex and Antigravity subscriptions, so I was not paying extra, but I instantly had much more intelligence to use.
The whole trick is one small Bash script that my Claude agents can call like any other command:
# run-cli: call another vendor's CLI as a headless subagent
# usage: run-cli <codex|antigravity> "<prompt>"
VENDOR="$1"; PROMPT="$2"
case "$VENDOR" in
  codex)       OUT="$(codex exec --sandbox read-only "$PROMPT")" ;;
  antigravity) OUT="$(agy --model "Gemini 3.1 Pro (High)" -p "$PROMPT")" ;;
esac
echo "$OUT"
echo "$OUT" | claude-mem-save -s "$VENDOR" # save to shared memory (my locally extended claude-mem)
The wrapper also watches the output for “usage limit” and “out of credits” messages and returns a special exit code, and this is exactly how the automatic fallback to Claude models works: the orchestrator sees the signal and does the work with a Claude agent instead.
One more thing that really matters is to pin the model per role, because subagents inherit their parent’s model by default, and that is exactly how I burned my Fable limit in 30 minutes.
With this technique I was able to run the research continuously for roughly 10 times longer than initially with Fable only, measured simply as how long I can keep the agents working before any of the 3 subscriptions hits a limit. Before it was 30 minutes of research, now it is a few hours, without paying a single penny more. And when Codex or Antigravity hits its own limit, the framework simply falls back to Claude models, so the research does not stop.
Reducing hallucinations
Cost was only the first problem, the second one was trust. Before my research framework, when everything was done by Fable, I was sometimes getting findings that looked solid but were not true. For example, a wrong license on a repo, a savings figure with no source, or a number that was not on the cited page. To reduce hallucinations, I implemented explicit rules in the research framework that every finding must pass before it can be shared. A few of them:
- Whoever finds a claim never verifies it, a different model or agent checks the links, quotes, and numbers.
- Nothing lands in the knowledge base without a URL and a quote from the primary source.
- Never state a number the source page doesn’t contain.
This list was not designed upfront. It grew during the research, because every time verification caught a new class of mistake, the rule went back into the prompts. And such a framework is really effective only if you keep tuning it, so review the findings, flag the useless ones, and feed that back.
/deep-research goes last
With cost and trust handled, the last piece was the /deep-research tool that started this whole story. It is still in the pipeline, but as the last step, not the first. At the end of each day I run it over the findings that already survived verification, so instead of researching blindly it goes through the existing findings, deepens them, eliminates the mess, and tries to fill the gaps that the framework missed. It also uses fewer tokens this way, because it works through a fixed list of claims instead of exploring the internet. The last run used 61 agents and took 22 minutes. Compare that to day one, when 111 agents burned the whole limit in around 30 minutes and never produced the report. Same tool, just a much smaller job.
The result: a knowledge base I can trust
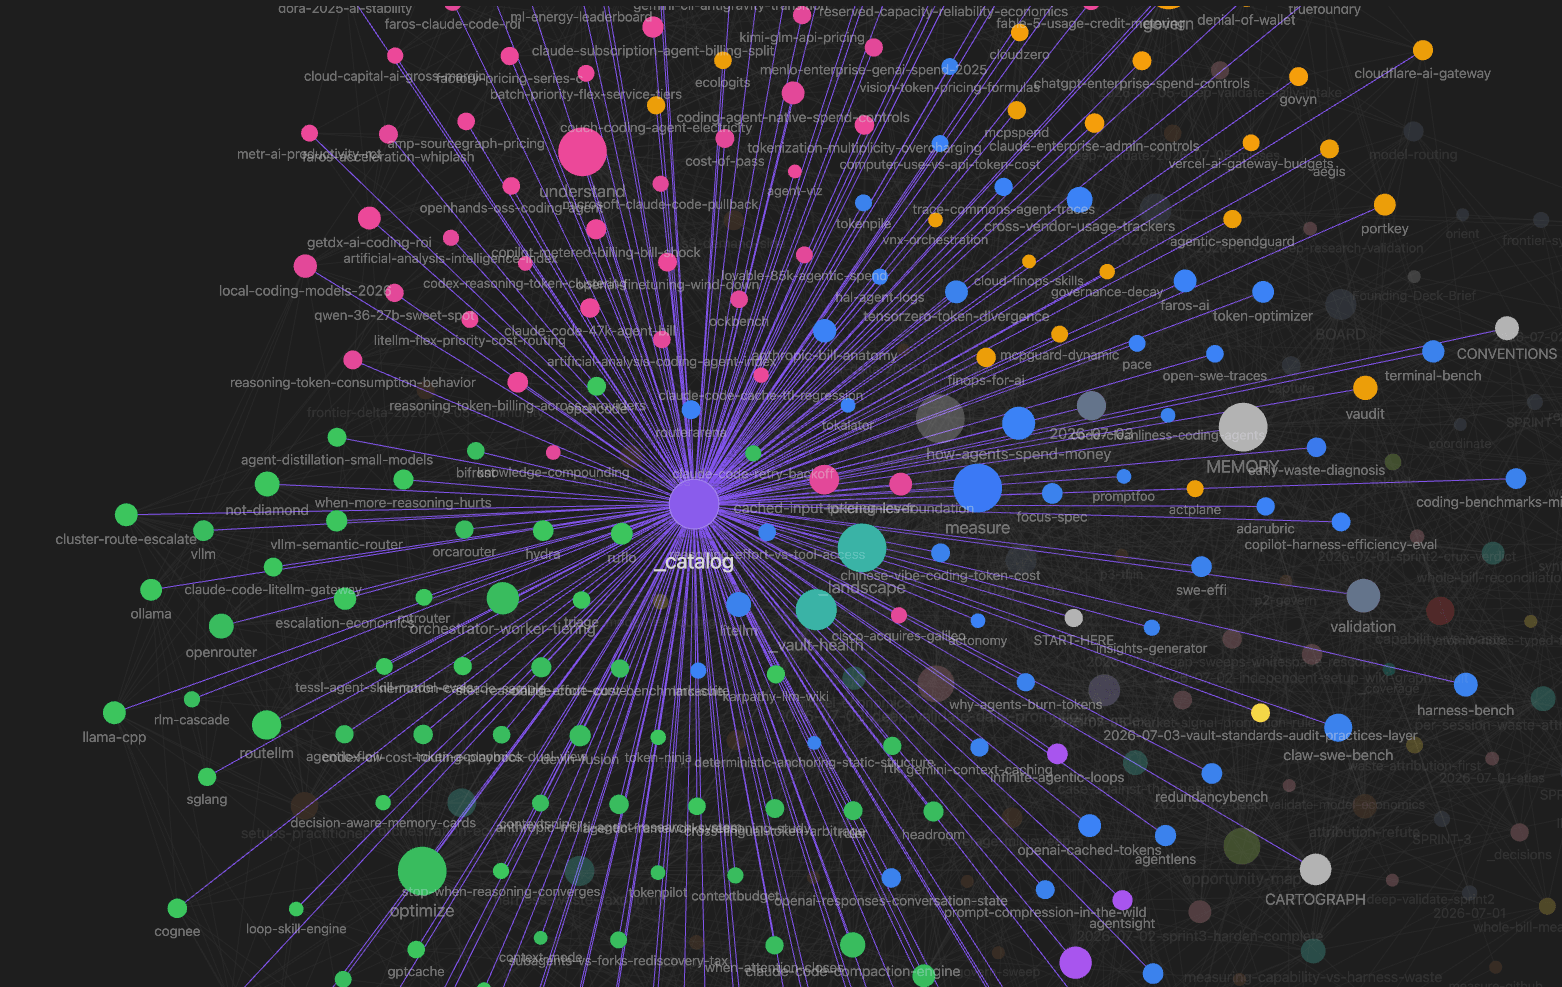
Everything that survives verification lands in an LLM wiki I keep in Obsidian, inspired by Karpathy’s LLM wiki pattern: linked atomic notes, agents doing the sweeps, and me setting the rules. One week in, it holds hundreds of validated notes on pricing, tools, benchmarks, and practices.
Automated checks aren’t enough on their own. Once, my triage rule quietly rejected Headroom, a 56k-star project and one of the biggest in its category. The agents did everything right, verification confirmed the project is legit, and a claim check correctly flagged that its headline savings numbers were not quality-controlled. But my rule said “unvalidated claims mean no entry”, so a project half the industry uses was invisible in my knowledge base. I only noticed 2 days later, when I asked “how did we miss this?” The fix was a new rule: reject the claim, not the project. Agents can do the searching and checking, but no agent will ever tell you that your own rule is the bug.
If you want to build a quality knowledge base, human verification and research supplementation are mandatory. AI-only research can be really poor quality. Human-only research is too slow. The best way is a hybrid one: agents do the heavy research work, but they run on a pipeline crafted and constantly improved by a human. The human also verifies the results and fills the gaps.
A few findings from the knowledge base
The token economics topic turned out to be much larger than I expected. Here is a small sample of what is already inside, the findings that surprised me the most:
- Your harness can matter as much as your model. On Terminal-Bench the same model shows a ~66x token spread across different harnesses, and the thinner setups actually score higher, not lower. Another study measured a swing of about 54 percentage points on the same model, changing only the harness. We saw a small version of this ourselves when we checked the true cost of saying “Hi” to an AI agent.
- Context compaction can double your bill instead of saving it. Compaction sounds like compression, so it is easy to assume it is always good, but it is not free: the model has to summarize your history and that summarization call consumes tokens too. It can also evict files the agent still needs, so the agent re-reads them, the context fills up again, and compaction fires again. One documented regression shows how bad this loop can get: after a harness retuned its compaction threshold, it went from 4 to 12-26 compactions per session, and token usage on identical tasks went from 89 million to 160-185 million.
- One mid-session tool change silently re-bills everything. Cache reads cost about 0.1x of the base input price, but the cache invalidates as a hierarchy (tools, then system, then messages). Add or reorder a single tool schema in the middle of a session and the entire cached prefix re-bills at full price. You get no error, just a bigger invoice.
- Your token counter is not your invoice. In one documented case a calculated $3.60/month landed as a $25-40/month invoice, a 7-11x gap coming from context accumulation, retry amplification, framework overhead, and evaluation calls that a simple token estimate never captured.
Our framework tags most of these as medium confidence, usually 1 or 2 solid sources, and we keep that visible instead of pretending it is settled.
Before you burn your next limit
If you are burning your limits on deep research today, try reversing the order. Cheap models find, accurate models verify, and deep research goes last. And check how much intelligence you already pay for. A few subscriptions with a clear role for each model give you much more than one frontier model used blindly.
And if you are building your own research pipeline, or your AI bill grows faster than your usage, we would really like to hear from you. Join the discussion on Hacker News or LinkedIn.
Moonshot AI Plans Hong Kong IPO After Kimi K3 Model Debut
Moonshot AI is moving to list on the Hong Kong Stock Exchange after its Kimi K3 model triggered a global market sell-off.
Deep dive
- Moonshot AI is planning a Hong Kong IPO within 6 months.
- The Kimi K3 model features 2.8 trillion parameters and a mixture-of-experts (MoE) architecture.
- The model supports a one-million token context window.
- The launch caused significant declines in regional AI stocks, with Z.ai dropping 30% and MiniMax 16%.
- Moonshot is targeting a $30 billion valuation, up from $4.3 billion in December.
- Annual recurring revenue is estimated at $200 million as of April.
- The company is shifting from a VIE structure to a joint venture to comply with regulatory requirements for a domestic listing.
Decoder
- VIE (Variable Interest Entity): A legal structure often used by Chinese tech companies to allow foreign investment while technically maintaining domestic ownership in sensitive sectors.
- Mixture-of-Experts (MoE): An architecture that routes inputs to specific specialized sub-networks within the model rather than activating the entire neural network for every query.
- Open-weight: Models where the internal parameters are made public for developers to use and host independently, distinguishing them from closed-source or API-only models.
Original article
Moonshot AI Plans Hong Kong IPO After Kimi K3 Model Debut
Moonshot AI plans to list on the Hong Kong Stock Exchange within six months, people familiar with the matter say. The Beijing-based startup behind the Kimi chatbot has circulated a shareholder resolution to secure investor approval for the offering.
The filing follows a turbulent week for Moonshot, whose new Kimi K3 model briefly rattled global technology markets. Investors now watch whether the company can turn that momentum into a successful debut.
Kimi K3 AI Model Shakes Global Markets
Moonshot released Kimi K3 on July 16, an open-weight model built on roughly 2.8 trillion parameters. Its design uses a mixture-of-experts (MoE) architecture, which splits tasks across specialized sub-networks.
A one-million token context window helped it match several leading US models on coding benchmarks.
The launch triggered what traders called a fresh DeepSeek moment. Taiwan's benchmark index fell more than 6%, and Japanese equities dropped 4%. The Nasdaq slid 1.5% in its worst session of the week, according to Fortune.
As a result, Hong Kong-listed rival Z.ai lost as much as 30% of its value. That marked its steepest single-day decline since its January listing. MiniMax Group shares dropped 16%, and Alibaba fell 4%, Bloomberg reported.
AI Funding Round Targets $30 Billion
Moonshot is simultaneously finalizing a round that could value the firm at more than $30 billion, sources told Bloomberg. That figure marks a nearly sevenfold jump from the $4.3 billion valuation it held in December, according to MLQ News.
In turn, the startup's annual recurring revenue reportedly doubled to about $200 million by April. That is up from roughly $100 million in early March.
Rapid growth has fueled investor appetite even as Beijing restricts Chinese AI firms from taking foreign capital without clearance.
Restructuring Paves Way for Listing
To qualify for a Hong Kong listing, Moonshot is dismantling its offshore VIE structure. Chinese firms use that legal setup to route foreign investment around ownership limits. A joint venture model will replace it, following guidance from China's securities regulator toward mainland-linked structures.
Moonshot is not the only lab eyeing a public debut. Rival DeepSeek is weighing an IPO after closing its first external funding round.
Meanwhile, the market reaction shows how closely AI headlines now move traditional risk assets. That echoes a June selloff that pulled Bitcoin toward $62,000.
However, Wall Street remains split on how to price the competition. JPMorgan has urged buying the dip in AI chip stocks, while Morgan Stanley favors hyperscalers instead.
If Moonshot's listing proceeds on schedule, it will land amid Chinese developers' continued gains. That trend is already challenging assumptions about who leads the global AI race.

How Anthropic runs large-scale code migrations with Claude Code
Anthropic is using its own Claude Code tool to execute million-line code migrations in weeks rather than years.
Deep dive
- Rulebook-first approach: Define translation policies and dependency maps before starting implementation.
- Adversarial reviews: Utilize multiple agent classes where reviewers challenge the output of implementer agents.
- Mechanical verification: Use compilers and test suites as the sole source of truth for whether code is ready to merge.
- Parallel workstreams: Break migration tasks into independent units of files to allow agents to work simultaneously.
- Loop refinement: If an error occurs multiple times, update the translation rulebook rather than patching individual files.
Decoder
- Adversarial review: A workflow pattern where one agent writes code while a separate, specialized agent acts as a critic, identifying bugs or violations of the rulebook.
Original article
How Anthropic runs large-scale code migrations with Claude Code
A step-by-step guide to running large code migrations with AI agents — including Bun's million-line Zig-to-Rust port.
Code migrations, projects that port a production codebase to a new language, were multi-year endeavors until recently.
In the last month, individual developers at Anthropic migrated 10 code packages consisting of tens to hundreds of thousands of lines of code using Claude Fable 5, Claude Opus 4.8, and dynamic workflows. In this article we’ll cover two examples along with best practices from these projects.
Jarred Sumner, co-founder of Bun and Member of Technical Staff at Anthropic, used Claude Code to migrate Bun from Zig to Rust. A million lines of code were produced in less than two weeks, with 100% of Bun's existing test suite passing in CI before merge. Nineteen regressions surfaced after merge and have all been fixed. The Rust port was shipped inside Claude Code in June.
Mike Krieger, co-lead of Anthropic Labs, migrated a Python codebase to 165,000 lines of TypeScript over a weekend. This included hundreds of agents, eight phase gates, three adversarial review rounds, and a final parity check that diffed every command's output against the Python original.
Claude Code’s new capabilities change the math for these long-deferred projects. Below is the six-step process we now use, drawn from what these migrations taught us.
The core insight is that you don’t fix the code. You fix the process (loop) that produced the code.
Why and when to migrate languages
Before going straight into the how, it’s worth discussing the when and why because the assumptions around these projects have evolved.
Teams launch migrations because of landscape changes between their initial build and current project. Either a known trade-off has become limiting, a better approach has emerged, or the original ecosystem is shrinking.
For example, Jarred originally chose Zig because it offered C-level performance with radical simplicity, ideal for a solo founder “writing Bun in 1 year in a cramped Oakland apartment pre-LLM.” This simplicity came with known tradeoffs.
Fast forward to 2026. Bun's CLI is getting over 10 million monthly downloads and is used extensively within Claude Code.
As recently as last quarter, those tradeoffs wouldn’t have been enough to justify freezing the roadmap and committing resources to a multi-quarter project. Migrating languages can deliver smaller, faster, and safer systems, but no one wants to pay for them.
Software engineers have also had to contend with the career risk inherent in these formerly mega-projects. You could maintain two parallel code bases for quarters or years, and if the end result was 90% parity, you had a bigger headache than when you started.
Now, the worst case scenario is you delete the branch and try again.
There still needs to be a justifiable business case. While million line migrations no longer cost $3 to $4 million in engineering resources over the course of a four year project, they still cost tens to hundreds of thousands of dollars or more to execute. The Bun migration, for example, consumed 5.9 billion uncached input tokens and 690 million output tokens — around $165,000 at API pricing. The main portion of Mike’s port was 27 million tokens.
However, the migration case no longer needs to be existential. A year of memory-bug patches in the changelog, or one chronic bottleneck, can now justify it.
The compile step was the impetus for Mike's project. The internal tool his team works on ships to users as a single binary. Producing that binary with the Python toolchain took roughly eight minutes per platform, totaling a 30-minute wait across the build matrix on every release. After the port, the same compile now takes about two seconds, the binary starts 6x faster, and the team was able to retire a separate deployment pipeline.
Why AI changes the code migration math
Claude Fable 5 is our most capable, generally available model. Fable and Opus 4.8 are particularly good at delegating, directing, and verifying parallel workstreams with subagents while finding multiple paths towards stated goals.
Large code migrations are a particularly effective use case for these advanced models because:
- The work is parallel. Work can be executed across thousands of independent units such as files and crates, so agents can work at the same time rather than have one waiting on the other.
- Context is clear and comprehensive. The old code serves as a great spec for the model. It also serves as a core reference to help build the guide for translation agents to follow.
- There is a built-in referee. Many large codebases will include a test suite that agents can use to verify their work. Agents perform their best when verification is objective, because the model can grind against a ground truth for days without a human arbitrating quality.
- The queue writes itself. When a compiler or test run fails, that becomes the next item for an agent to fix.
- They require consistency and edge case handling: The process is built so drift has nowhere to hide: reviewers cite the rule behind every finding, so a violation becomes a queue item instead of a quiet divergence. And when an agent does hit an edge case, the fix becomes a rule every subsequent agent follows.
Six steps for large code migrations
The process below has been generalized to be relevant to multiple languages and scenarios.
Prerequisites
A prerequisite before starting on your migration project is to have a strong judge in place, otherwise you won’t have an exit condition or measure of success.
The judge must be able to evaluate both the original code and the target code on equal terms. Test suites written in the original language will often depend on internal functions that won't exist in the target code.
To build this judge:
- Categorize existing tests. Use Claude to identify which tests are expressible as external calls and which depend on internals that won't port.
- Rewrite for portability. Convert the external-facing tests into assertions that can run against both the original and the port. Use adversarial agents to verify the rewritten tests don't weaken the assertions.
- Validate the judge. Run it against the original code to confirm it passes. Then run it against deliberately broken code to confirm it fails — a judge that doesn't catch breakage isn't a judge.
Step 1 — Create the rulebook, dependency map, and gap inventory
In this stage we are creating the foundations of our migration: an inventory of places where code will need to be refactored rather than just translated, a rulebook for how to translate our code, and a dependency map to order our migration implementation workstreams.
Rulebook
The exact shape of the rulebook depends on key architectural decisions you must make at the start. Chief among them, if the new code will follow the same structure, or if it will be completely redesigned.
Dependency map
You need to understand file dependencies to effectively break up workstreams for a parallel migration so you know which files to migrate first and which files to contain in the same batch.
Gap inventory and skeptic reviewers
The new language has different requirements from the old language that must be met. Both Jarred and Mike created gap inventory files capturing this implicit knowledge.
Step 2 — Stress-test the rules
This step involves a mini-migration that serves as a “shakedown cruise” for the larger migration. Regardless, throw out any translated files. The goal is to refine the rules, not make incremental progress.
Step 3 — Translate everything
For the remaining steps, you run the same multi-agent loop architecture: implement, review, and fix. You can offload implementer work to smaller models and keep reviewers on larger ones.
The work queue should be mechanical. A batch script decides what’s done by checking whether the translated file exists on disk, then slices the pending files into batches for the implementer agents. Because the queue is rebuilt from disk every time, the migration is resumable by construction.
Steps 4, 5, 6 — Compile, run, and match behavior
These three steps share the same loop architecture and need progressively less human judgment. You fix errors from the compiler, resolve crashes from smoke tests, and run the test suite to compare program behavior across the two codebases.
Code migrations best practices
- Don't follow this guide blindly. Each migration is different. Treat this as a starting point, and plan your specific migration with Claude before committing to it.
- Don’t focus on individual failures. Individual failures are the loop's job. Fixer agents burn those down. Your attention belongs on the patterns.
- Make review adversarial and verification mechanical. Adversarial review allows for longer running tasks and is often worth the token consumption. Let scripts — a compiler, a diff, a test suite — be the referee.
- Don't use the largest model for everything. Token spend concentrates in your loops, so design them deliberately. Smaller models handle the high-volume implementation fan-out well; save your largest model for reviewers and for anything that writes rules other agents will follow.
- Front-load the human hours. The rulebook and the stress test are the most time-consuming. Everything after is mostly queues burning down.
- Make the work queue mechanical and resumable. Done should mean "the output file exists on disk."
Review loop results, not code
Jarred’s Bun migration is now in production, although every migration has tradeoffs. The new codebase is measurably better. Every memory leak the team's tooling can detect has been fixed. The binary is smaller and faster.
Consider whether it’s time to re-run the math of your long deferred migration. Pick the codebase you've been tolerating and ask Claude what the migration process looks like for it.

GitLab 19.2 release notes
GitLab 19.2 launches with general availability for GitLab Duo CLI, custom AI flows, and automated security vulnerability remediation.
Deep dive
- GitLab Duo CLI: Now generally available for interactive and headless agent-driven terminal operations.
- Custom AI Flows: Generally available, enabling YAML-defined multi-agent orchestration for GitLab events.
- Security Improvements: Added Security Review Flow (beta) for logic vulnerability detection and automated dependency patching.
- CI/CD Enhancements: Generally available CI Expert Agent for pipeline optimization and scheduled execution policies.
- Governance: New fine-grained personal access tokens (PATs) and AI audit logging for governance compliance.
Decoder
- MCP (Model Context Protocol): An open standard for connecting AI assistants to systems, data, and tools.
- CI Expert Agent: An AI tool designed to automate pipeline configuration, debugging, and optimization.
Original article
Full article content is not available for inline reading.

Cloudflare WAF protects WordPress applications from two high-severity vulnerabilities
Cloudflare has released emergency WAF protections for two high-severity WordPress vulnerabilities that allow unauthenticated remote code execution.
Deep dive
- CVE-2026-60137 is a SQL injection flaw in versions 6.8+.
- CVE-2026-63030 allows unauthenticated RCE via the REST API batch endpoint in versions 6.9+.
- WordPress is forcing automatic updates for these issues.
- Cloudflare WAF managed rules are now blocking requests matching these exploit patterns.
- The RCE vulnerability is only exploitable when a persistent object cache is not in use.
Decoder
- RCE: Remote Code Execution, a vulnerability allowing an attacker to execute arbitrary commands on a target server.
- SQL Injection: An attack where malicious SQL statements are inserted into entry fields for execution.
Original article
Cloudflare has deployed new Web Application Firewall (WAF) protections for two critical vulnerabilities affecting WordPress. The protections address an Unauthenticated Remote Code Execution (RCE) vulnerability in WordPress's REST API and a related SQL Injection vulnerability.
The WordPress security team disclosed the vulnerabilities to Cloudflare before public release so that we could prepare protections for customers. Cloudflare has deployed the new rules to protect all customers, including those on free and paid plans, as long as their application traffic is proxied through the Cloudflare WAF. The rules were deployed at 17:03 UTC on July 17 2026.
WAF protections reduce exposure while customers update, but they are not a substitute for patching. WordPress has released fixes in version 7.0.2, with backports to affected earlier branches: 6.9.5, 6.8.6, and 7.1 Beta 2. Versions earlier than 6.8 are not affected. WordPress is treating this as its highest-severity, highest-priority class of issue and is forcing automatic updates to affected sites, so most sites will be updated automatically. We still recommend confirming that you are on a patched release or the backports for your branch and follow the guidance in the official WordPress security release announcement.
What you need to know
The vulnerabilities affect different parts of the request path:
- CVE-2026-60137: SQL injection. A vulnerability in WordPress version 6.8 and later allows crafted input to alter a database query. Rating High.
- CVE-2026-63030: Unauthenticated remote code execution. A vulnerability in WordPress version 6.9 and later allows an unauthenticated attacker to execute code through the batch endpoint of the REST API when a persistent object cache is not in use. This vulnerability is related to the SQL injection described above. No login or user interaction is required to exploit this vulnerability. Rating Critical.
The SQL injection vulnerability is present from version 6.8 onwards, while the RCE only affects versions from 6.9. So 6.8.6 addresses the SQLi only since the RCE isn't present on 6.8, while 6.9.5, 7.0.2, and 7.1 Beta 2 get fixes for both.
Cloudflare created two rules to detect requests associated with these vulnerabilities:
| Rule description | CVE | Rule ID for Managed Ruleset | Rule ID for Free Ruleset | Default action |
|---|---|---|---|---|
| Wordpress - SQL Injection - CVE:CVE-2026-60137 | CVE-2026-60137 | 1c060d3a371549219ee290d7ed933fcc |
db003b39b7774859a8d588ce33697a1a |
Block |
| Wordpress - Remote Code Execution - CVE:CVE-2026-63030 | CVE-2026-63030 | 7dfb2bd4708d4b88b9911dc0550664b6 |
ebd3f2df15c74ddcbf6220c9b5ec246a |
Block |
Cloudflare customers running WordPress sites on Pro, Business, or Enterprise plans should ensure that Cloudflare Managed Rules are enabled. Customers can follow the steps in our WAF Managed Rules documentation. Customers on free plans are automatically protected through the Free Ruleset.
The new rules are deployed with the default Managed Ruleset action of Block. Customers running WordPress sites should review any ruleset-level overrides, including those that change all rules from Block to Log, and ensure the new rules use the recommended action while they update WordPress. Cloudflare customers should also monitor Security Events for requests matching either rule.
Defense in depth while you patch
The SQL injection rule detects crafted parameter values before they reach WordPress. The unauthenticated RCE rule targets requests attempting to reach the remote code execution path. Together, they detect the attack at two different points.
These rules reduce risk while organizations update affected systems; they do not fix the underlying vulnerable code. Updating WordPress remains the most effective way to address the vulnerabilities. If an immediate update is not possible, verify that both Cloudflare rules are active with the recommended action and review logs for suspicious requests to the affected REST API endpoint.
Looking forward
Cloudflare will monitor matching traffic and test the rules against new attack variations, updating detections when needed.
We thank the WordPress security team for coordinating with Cloudflare and other infrastructure providers to help protect users before details of the vulnerabilities became public.

Design Systems Need Evals
Design systems now require automated evaluation suites to verify that AI-generated code remains compliant with accessibility, prop, and token standards.
Deep dive
- Design systems must move from passive component libraries to active interfaces with enforceable contracts.
- Agents often violate design conventions by 'hand-rolling' custom styles instead of using established components.
- Mechanical evals should automatically validate prop names, token usage, and accessibility attributes against the source of truth.
- LLM-based judges should assess pattern selection (e.g., choosing a modal over a confirmation dialog) to ensure semantic correctness.
- Running evals in CI is critical because model updates can silently degrade adherence to design rules over time.
- Tools like Meta's Astryx and custom implementations at companies like Intuit represent the emerging standard for design system verification.
Decoder
- Code Connect: A Figma-to-code mapping tool that links design components directly to their implementation in a codebase.
- Design Tokens: Standardized, named variables for design attributes like colors, spacing, and typography that ensure visual consistency.
- MCP Server: Model Context Protocol, a standard for connecting AI assistants to systems, data, and tools.
- Regression suite: A set of tests designed to ensure that new code changes do not break existing functionality or compliance.
Original article
Design systems need evals
You've taught agents your design system. You still don't know whether they're following it.
Design systems have spent years borrowing from how software gets built. Versioning, semantic naming, explicit contracts, deprecation cycles. The API framing I wrote about last year was the same premise, treating a component library as an interface other systems consume rather than a folder of pictures. Most of that borrowing is now considered normal practice. The next thing to take comes from a different part of the stack.
When you let an agent generate against your system, you're running a model you don't control against rules you wrote, and hoping the output respects them. That's the same problem the people shipping LLM features have been dealing with for a couple of years. One of their answers is evals.
An eval is a test for output you can't predict. You hold a set of inputs constant, run them through the model, and check the results against assertions about what a good answer contains. promptfoo, acquired by OpenAI in March, made these cheap to write and run in CI on every change. Because the same input can produce a different output next time, you run each case several times for nondeterministic tasks and watch for the result that wavers.
What this looks like for a design system
Look at the inputs you already have — Code Connect maps your Figma components to real code and, through the MCP server, carries per-component instructions on props, accessibility, and usage. AGENTS.md holds the conventions and commands that apply across the repo. It hands off from there to the token and component files that carry the detail. Skills give the agent step-by-step procedures for tasks specific to your system.
Together they're the prompt. They tell the agent what your system is and how to use it, but neither of them tell you whether the agent listened.
You can write the cleanest AGENTS.md on the internet and still have no idea whether the component that shipped this morning came from your library, or got hand-rolled as a div with a hardcoded blue. There's a line in Figma's own documentation that gives the game away — Code Connect has a preview that shows what the model would generate for a component. The docs warn that the preview runs in a different context to real usage, so the actual output may differ. The preview is a guess about a guess. The only way to know what the agent does under real conditions is to run it under real conditions and look.
The more rules you give an agent, the harder they get to follow. Researchers benchmarked how well agents follow instructions in real agentic tasks. The best model followed fewer than a third of them in full, and adherence fell further as the instructions grew longer and packed in more constraints. The more carefully you specify your system, the more you need a way to confirm the specification survived contact with the model.
What you actually test
A design system eval is a list of the jobs you'd expect an agent to handle, each written as a prompt and paired with checks on what comes back. Something like building an onboarding step, or adding a confirmation before someone deletes their account. For each one, you assert two kinds of thing.
The first kind is mechanical. It checks the props the agent used against the real component API, resolves every colour and spacing value to a token instead of a hardcoded guess, and confirms it reached for a library component rather than hand-rolling the markup. Accessibility belongs here too: a confirmation dialog with no accessible name, or a destructive button without a label, is something you catch by reading the structure rather than judging the intent.
Most eval tools ship contains and regex assertions, which only skim the surface. A real check validates the generated code against your actual system — the component APIs and the token set — so an invented prop or a raw hex value gets caught where a string search would miss it.
Checks like that run in milliseconds, and they catch the small inconsistencies that accumulate into entropy before anyone notices. Tune it too strictly and the same check will flag code that's actually fine, so it needs tending like any other part of the system.
The second kind is judgement, which is much harder to check. You're asking whether the agent picked the right component for the intent — say, a confirmation dialog over a generic modal — and whether the flow handles the empty and error states rather than only the happy path. There's no regex for any of that. Eval tooling reaches for a model acting as a judge here, one LLM scoring another against a rubric. It tracks human judgement well on narrow checks and gets shakier once the calls become subjective, which earns it a place in the suite without making it the last word on taste.
The prompts matter as much as the assertions, and should read like the ones your team actually types, underspecified and intent-level rather than a component-by-component spec. Spell out which component to use and the eval only shows the agent can follow orders, not whether your system steers it there on its own. Meta's Astryx keeps the expected components hidden from the agent, so a pass reflects your system guiding the choice rather than the prompt naming it.
One case looks like this:
# illustrative. the built-in contains and regex assertions are the crude floor;
# the real check is the javascript one below.
tests:
  - vars:
      prompt: "Add a confirmation before someone deletes their account."
    assert:
      - type: javascript
        # a real check validates the generated code against your system,
        # every prop valid against the component's actual API, every colour and spacing
        # value resolved to a token, no hand-rolled markup where a component exists
        value: file://assertions/validate-against-system.js
      - type: llm-rubric
        value: "Reaches for the confirmation dialog over a generic modal"
      - type: llm-rubric
        value: "Avoids default focus on the destructive action and provides a clear cancel path"
The javascript check is the one that knows your system. You write it yourself, against your own components and tokens, rather than pulling it off the shelf. The rubrics cover the judgement calls: whether the agent chose the confirmation pattern, and whether it composed it safely.
This is the line I drew in an earlier piece about a design system being AI-ready while the organisation around it isn't. Each part an agent produces can individually pass every automated check, and the whole still comes out mediocre, confusing, or inaccessible. A token-perfect button can sit inside a broken flow. No eval suite closes that gap, and selling it as though it does would be a lie. What the suite does is clear the mechanical failures off the table, so the person reviewing the work spends their attention on the judgement calls instead of hunting for hardcoded colours. It narrows what a human has to look at. It doesn't remove the human.
Why it has to run more than once
You run a suite instead of a single check because the thing underneath you keeps moving. Your rules can sit untouched for a month while the model behind the agent gets updated and starts treating your tokens differently. Someone trims three lines out of AGENTS.md to keep it short, and silently breaks a behaviour nobody re-tests. None of these surface in a code review unless someone happens to be looking at exactly the right file on exactly the right day. A regression suite checks every time, on every change. That's the whole reason LLM teams run theirs in CI rather than by hand.
In practice it sits where your other gates sit. Someone opens a pull request renaming a prop on your dialog component. The suite runs against the new build, and six of the twelve prompts come back with the agent still emitting the old name, because Code Connect is pointing at a mapping nobody updated. The pull request doesn't merge until the mapping is fixed, or the prompts are. Whoever renamed the prop finds out on the branch, rather than three sprints later in someone else's feature.
Some of this is already being built, just not as a shared practice. Meta's Astryx, open-sourced in June, takes its vibe tests furthest, running the same prompt across different system configurations and measuring how faithfully each one gets rebuilt. Kaelig Deloumeau-Prigent wired an evaluate stage into an eight-agent pipeline for the Intuit Design System, checking tokens and accessibility on every generated component. Both sit next to grounding, the other half of the answer, where a tool like v0 refuses to emit a component or token it can't verify in the first place. The two solve different problems. Grounding prevents many failures at generation by feeding the agent verified knowledge. Evals catch the ones that still get through, and keep catching them as the models and rules move underneath. Most teams have neither.
So the ground isn't empty. What's missing is the expectation that a design system with agents pointed at it ships with a regression suite the same way it ships with a changelog. We spent the past year getting our systems ready for agents. The part that checks they were listening is still nobody's job in particular.
Introducing Apache Spark 4.2
Apache Spark 4.2 prioritizes AI-native analytics by adding governed metric views, vector similarity search primitives, and first-class change data capture (CDC) support.
Deep dive
- Metric views allow defining business metrics once as governed objects accessible by SQL, BI, and AI agents.
- Vector search is now native with support for similarity functions, ranking (NEAREST BY), and normalization.
- Change Data Capture (CDC) is supported through a new CHANGES SQL clause and Auto CDC for automated SCD Type 1 processing.
- Python execution is now 'Arrow-first' by default, reducing serialization overhead between Spark and Python ecosystems.
- Spark Connect and improved PySpark compatibility simplify remote execution without needing a full JVM runtime.
- Real-Time Mode (RTM) now supports PySpark stateless streaming for low-latency applications.
- Data Source V2 (DSv2) adds standardized CDC and row-level DML performance improvements.
- Web UI has been updated to Bootstrap 5 with dark mode and better SQL visualization.
Decoder
- CDC (Change Data Capture): A pattern for identifying and tracking modifications to data so that downstream systems can react to changes.
- Varlena: Postgres's internal self-describing format for variable-length types (like TEXT, JSONB), used here to explain how Spark handles similar data structures.
- SCD Type 1 (Slowly Changing Dimension): A data warehousing technique where old data is overwritten with new data, maintaining only the current state of a record.
- Arrow: A cross-language development platform for in-memory data, enabling high-performance columnar data transfer.
Original article
Introduction
Apache Spark 4.2 moves more of the modern data and AI stack into the engine itself. Building on Spark 4.x, the release adds governed metrics, vector and top-K primitives, a more Arrow-first Python path, first-class change data capture, and stronger streaming and operational foundations.
This makes Spark more useful on both sides of an AI application. It improves the quality and freshness of the data supplied to AI agents, and it makes Spark easier for applications and agents to invoke as a remote execution service. The AI story is concrete: trusted semantics, native retrieval primitives, fresh change data, and open interfaces to Spark-scale computation.
Spark 4.2 can be understood through four benefits:
- Define truth once: Metric views put governed business metrics in Spark so SQL, BI tools, applications, and AI systems can use the same definitions.
- Reach Spark from everywhere: Spark Connect, PySpark, Arrow, and Python Data Source improvements make Spark easier to call from services and Python ecosystems.
- Run AI-native analytics in SQL: Vector functions, NEAREST BY, sketches, ranking, and geospatial types bring more analytical building blocks directly into Spark SQL.
- Move changing data safely: Auto CDC, the CHANGES surface, Data Source V2, and Real-Time Streaming make continuously changing data easier to process correctly.
Together, these changes help organizations use one open engine to prepare data, define business meaning, retrieve relevant context, and keep analytical and AI applications current.
Metrics and Semantic Modeling: Define Truth Once
Spark 4.2 introduces metric views, bringing a native semantic layer to Spark SQL. Teams can define business metrics once and use them consistently across dashboards, reports, applications, and AI tools.
This matters because many important metrics are not safely additive. Ratios, distinct counts, retention, and similar measures can produce incorrect results when every consumer rewrites the formula at a different grain. Metric views make dimensions and measures first-class objects that Spark understands, allowing the engine to preserve the intended aggregation semantics.
Once a metric view is defined, users can query the same governed measures by different dimensions:
For AI applications, this is especially important. An agent should not calculate revenue differently from a dashboard or return a different answer when a user changes the requested grouping. A governed metric view gives SQL, BI, and AI one source of truth, with Spark analysis, catalog resolution, and permissions applied consistently.
Spark Connect and PySpark: Reach Spark from Everywhere
Spark as a service API
Spark Connect separates the client from the Spark server through a protocol based on gRPC and Arrow. A client builds a logical plan, the server analyzes and executes it, and results return as Arrow batches. The client does not need a full Spark runtime or a colocated JVM.
This makes Spark easier to embed in notebooks, services, developer tools, and AI applications. An agent or application can call Spark from its own runtime while Spark keeps analysis, optimization, execution, and governance on the server.
Spark 4.2 continues closing the compatibility gap with Spark Classic. Improvements include better RDD API compatibility, DataFrame inputs to spark.read.* and SparkSession.emptyDataFrame, improved debuggability, error propagation, status reporting, and YARN cluster-mode support. Together, these changes make PySpark and Spark Connect faster, more compatible, and easier to operate at scale and remote.
A more Arrow-first Python path
Python remains one of the primary ways users build data and AI workloads with Spark. In Spark 4.2, Arrow-optimized Python UDF execution is enabled by default, so existing UDFs can use the faster columnar path without a code rewrite. Pandas 3 support also makes it easier to upgrade Python environments alongside Spark.
For code that needs more control, Arrow UDFs keep data in PyArrow arrays and avoid an unnecessary Pandas conversion. Spark also expands profiling and debugging for Python execution, including time and memory profiling for Python Data Sources, improved worker diagnostics, and logging that can be queried as data.
Spark 4.2 also improves interoperability through the Arrow C Data Interface and the PyCapsule protocol. When both sides support it, Spark DataFrames can move into Arrow-native tools such as Polars or DuckDB without copying or serializing the underlying data. This reduces glue between Spark-scale processing and the broader Python and AI ecosystem.
Python Data Sources further reduce integration friction. Teams can build batch or streaming readers and writers in Python, register them once, and use them through the standard Spark data source interface. In 4.2, profiling makes these connectors easier to tune and operate rather than treating them as black boxes.
Spark SQL: AI-Native Analytics in the Engine
Vector scoring and top-K retrieval
Spark 4.2 adds new SQL primitives for vector similarity search, ranking, and time-series analysis. The release introduces vector distance and similarity functions, vector normalization, vector aggregation, and NEAREST BY, a top-K ranking join for distance-based matching. These primitives enable retrieval, recommendations, entity resolution, and candidate generation at scale.
Native geospatial analytics
Built-in GEOMETRY and GEOGRAPHY types and ST_* functions enable location-aware analytics without external spatial extensions. Spark 4.2 also adds Parquet, WKT/WKB, SRID preservation, and Python conversion support.
Fully qualified built-in functions and temporary views
With Spark 4.2 you can unambiguously invoke Spark provided functions by qualifying them with SYSTEM.BUILTIN. Following the precedent of session variables you can also fully qualify temporary views with SYSTEM.SESSION. This is useful to disambiguate from user defined functions or persisted relations and prevent injection.
SQL search path
Spark 4.2 adds SQL search path support with SET PATH, making it easier to resolve tables, functions, and variables across namespaces, and to libraries of objects simply by adding schemas to the path.
Spark persists the SQL path in views and SQL functions for predictable name resolution.
Starting with Spark 4.2 SQL scripts can DECLARE, OPEN, FETCH, and CLOSE cursors. This allows for more control over row-by-row processing of results sets, which in the past required stepping outside of SQL to use DataFrames.
Spark SQL also adds Tuple sketches, time_bucket for time-series analysis, broader TIME type support across file formats, QUALIFY for filtering window results, Top-K max_by and min_by, and IGNORE NULLS and RESPECT NULLS support for common aggregation functions.
Together, these additions make Spark SQL more expressive for modern analytical applications.
Spark Declarative Pipelines and Auto CDC: Move Changing Data Safely
Spark 4.2 introduces Auto CDC support in Spark Declarative Pipelines (SDP), bringing first-class SCD (Slow Changing Dimensions) Type 1 processing into Spark. Before Auto CDC, consuming a change feed and applying it to a target table required hand-written merge logic that could easily become complex and error-prone, due to handling deletions and out-of-order change events. With Auto CDC, users can simply configure how CDC events should update a target table and let Spark manage the complexities.
Auto CDC provides a Python API for applying CDC changes to an SCD Type 1 target table. It is designed for common ingestion and replication workloads where the latest version of each record must be maintained reliably, such as customer profiles, product catalogs, account records, and operational reference data.
For example, an Auto CDC flow can now be expressed declaratively:
In addition to Auto CDC, Spark Declarative Pipelines also receives important platform hardening, including safer server-side handling for eager analysis and structured identifiers for flows. Together, these changes make declarative pipeline development more reliable and give Spark a foundation for higher-level data engineering patterns.
Real-Time Mode in Structured Streaming: Fresher Operational Data
Real-Time Mode (RTM) in Structured Streaming lets streaming queries process data with millisecond end-to-end latency. This has helped Spark unlock whole new classes of use cases, and is becoming the foundation for operational data applications such as fraud detection, personalization, observability, and real-time feature engineering.
In Spark 4.2, we extended RTM to PySpark: you can now run stateless streaming queries (without Python UDFs) in Real-Time Mode. Python is a popular choice among data scientists and engineers for its ease of use, and this brings RTM's low-latency processing to a much wider audience.
Looking ahead to the upcoming Spark 4.x release, we're bringing stateful support to RTM — and the work is already underway. The effort is tracked in SPARK-54699 with three major components:
- A new streaming shuffle (SPARK-56664) that forwards data from upstream stages to downstream as soon as it's ready, rather than waiting for a stage to complete
- Concurrent stage scheduling (SPARK-57000), allowing multiple stages to run at the same time
- Stateful operator support (SPARK-57228), starting with transformWithState
Beyond stateful support, we're also working to enable Python UDFs (SPARK-57237) in RTM.
Data Source V2: One Surface for Evolving Data Sources
Spark 4.2 marks another major step forward for Data Source V2. DSv2 is becoming the standard foundation for connectors that expose reads, writes, row-level operations, schema evolution, change data, operation metrics, and transactions through Spark.
CDC in DSv2
Spark 4.2 adds first-class change data capture support to DSv2. Connectors can expose change streams through a standard API, and users can query them with the new CHANGES SQL clause, DataFrame APIs, and PySpark bindings. Spark also handles common post-processing in the engine — dropping copy-on-write carry-overs, detecting updates, and computing net changes per row. The same query behaves consistently across any DSv2 connector that supports CDC.
Row-Level Operations, Schema Evolution, and Transactions
Spark 4.2 further enhances support for row-level DML operations in Data Source V2 (DSv2) connectors. MERGE INTO receives additional performance improvements, including whole-stage code generation, along with further enhancements to the schema evolution capabilities introduced in Spark 4.1.
Schema evolution is now also supported for INSERT INTO operations, for both name-based and position-based column resolution, reducing friction when writing to evolving tables. In addition, operation summaries are now available for UPDATE and DELETE, complementing the MERGE INTO summaries added in Spark 4.1. MERGE INTO metrics have also been expanded and refined.
Spark 4.2 introduces additional building blocks for production-grade DSv2 connectors and lakehouse table formats. Key additions include the foundations of a transaction API, enhanced partition-statistics filtering, improvements to storage-partitioned joins, and closer alignment between DSv1 and DSv2 commands and behaviors. Together, these enhancements make DSv2 a more complete platform for implementing lakehouse connectors, transactional table formats, and other large-scale data systems.
Notable Improvements and Acknowledgements
Spark 4.2 includes several platform improvements that make Spark easier to operate, debug, secure, and scale. The Spark Web UI receives a major modernization with Bootstrap 5, dark mode, better SQL plan visualization, query timeline improvements, and server-side pagination. Kubernetes support improves with heterogeneous executor management, stable resource manager APIs, and reduced control-plane overhead. Spark 4.2 also adds JDK 25 support, improves web security, scales the Spark History Server, and upgrades key dependencies including Scala, Parquet, ORC, Arrow, Netty, and Hadoop.
Spark 4.2 reflects the strength of the Apache Spark community, with more than 1,900 commits from over 260 contributors. We thank everyone who contributed code, reviews, testing, documentation, and feedback to make this release possible.
Get Started with Spark 4.2
Download Apache Spark 4.2 from spark.apache.org/downloads and see the full Apache Spark 4.2 release notes for the complete list of changes. Apache Spark 4.2 will also be available in Databricks Runtime 19 Beta.
Experience Graphs: The Data Foundation for Self-Improving Agents
Meta researchers propose treating agent search trees as 'experience graphs' stored in a database to enable cumulative agent learning.
Deep dive
- Trellis manages agent state as a persistent, queryable Experience Graph (Causality, Executability, Reward).
- Architecture separates compute (stateless agents) from storage (durable database).
- Common operations like resume, reuse, and repair are treated as database access patterns rather than application logic.
- Enables 'vector-seeded graph expansion' to find and reuse high-performing past search trajectories.
- Training data extraction is performed via materialized views, eliminating the need for post-hoc scraping.
- Supports concurrency by managing tree statistics and backpropagation within the database transactional scope.
- Evaluation on 'KernelEvolve' showed 10x faster convergence and 52% lower token costs for optimized hardware kernels.
Decoder
- RSI (Recursive Self-Improvement): A process where an agent iterates on its own performance, using past outcomes to guide and improve future search and training.
- MCTS (Monte Carlo Tree Search): A search algorithm used in decision-making and AI that builds a search tree incrementally by balancing exploration and exploitation.
- Vellox: Meta's open-source, high-performance vectorized execution engine.
- DPO (Direct Preference Optimization): A technique to align LLMs to human preferences without requiring a separate reward model.
Original article
Full article content is not available for inline reading.

Qwen3.8 Is Going Open-Weight
Alibaba is releasing Qwen3.8, a 2.4-trillion-parameter model, as an open-weight release.
Original article
Qwen3.8 is launching and going open-weight soon! With a massive 2.4T parameters, this model is continuously evolving. We believe it’s one of the most powerful model available today, compatible to leading frontier AI models , second only to Fable 5. You don't have to wait to test it. Just now, the Qwen3.8-Max-Preview made its debut on Alibaba’s Token Plan, Qoder, and QoderWork. Be among the very first to try it out. Can't wait to hear what you build. Stay tuned!
Token Plan international: qwencloud.com/pricing/token-plan
China: platform.qianwenai.com/pricing/token-plan

Fable 5 vs. GPT-5.6 Sol on an NP-Hard Problem: Does /goal Help?
Using the /goal command in AI agents like Claude Code or Codex is a double-edged sword that amplifies both good and bad logic.
Decoder
- NP-hard: A class of computational problems for which no efficient (polynomial-time) algorithm is known to exist; solutions are generally hard to find but easy to verify.
- CLIArena: A testbed environment for evaluating AI agents' ability to interact with file systems, shells, and codebases.
Original article
TL;DR: I gave Claude Fable 5 and GPT-5.6 Sol the same unpublished NP-hard optimization problem, with and without their native /goal mode. Fable 5 is an absolute beast; /goal is not a game changer.
Context: This is an operations research problem originally submitted to students at a hackathon. I spent a week years ago writing C++ to solve it, so I have a useful human baseline.
Fable 5 was an absolute beast on this benchmark. It produced the best solution overall, and its consistency is unlike anything I have seen from a model on this problem. This is pure raw intelligence. Incredible.
The other result is that /goal is not a generic “try harder” switch. It changes the control loop and the search path. Sometimes that finds a better basin. Sometimes it gives a bad idea more time to mature.
All code, prompts, result tables, exclusions, and trajectory notes are in CLIArena. This is a follow-up to my first article about this benchmark.
The problem
KIRO is a fiber-network design problem I worked on as an engineering student in 2018. Given directed distance matrices for Grenoble, Nice, and Paris, the solver has to connect distribution points and terminals using loops and short chains while respecting several structural constraints. The objective is total cable length. Lower is better.
A valid network consists of redundant loops rooted at distribution hubs, with short branches hanging from towers on those loops. Every tower must appear exactly once, and reversing a cable segment can change its cost.
How large is the search space?
There is no single closed-form count because a solution can use any number of loops, variable loop sizes, and differently anchored and ordered branches. But Paris alone gives a useful lower bound.
Even if we ignore ordering and branches and only assign each of the 532 terminals to one of 11 distribution hubs, there are 11^532 possible assignments.
A stronger lower bound comes from one deliberately restricted family of valid solutions: exactly 19 loops of 28 terminals each, with no branches. This covers all 532 terminals because 19 x 28 = 532, while staying below the 30-terminal limit for a loop. Order the 532 terminals, split that ordering into 19 consecutive groups, divide by 19! because the set of loops is unordered, and choose one of the 11 hubs for each loop:
(532! / 19!) x 11^19 ~= 10^1223
What I tested
The primary experiment was intentionally narrow:
| Setting | Value |
|---|---|
| Models | Claude Fable 5, Opus 4.8, Sonnet 5; GPT-5.6 Sol, Terra, Luna |
| Modes | Plain; native /goal |
| Optimization budget | 30 minutes |
| Outer agent timeout | 1,900 seconds |
| Reasoning | Maximum available setting for every model |
| Execution | Harbor 0.1.43, Docker, subscription authentication |
Results
Before concentrating repetitions on the flagship pair, I ran one matched 30-minute no-hint pair for every model in the sweep. For Fable and Sol, the chart uses Pair 1 from the replicated headline set; the other four models have one pair each.
I then repeated the flagship comparison until I had three matched runs for Fable 5 and three for Sol.
| Model | Run | Plain | /goal |
Goal minus plain |
|---|---|---|---|---|
| Fable 5 | 1 | 32,197 | 31,934 | -263 |
| Fable 5 | 2 | 32,516 | 32,324 | -192 |
| Fable 5 | 3 | 32,446 | 35,178 | +2,732 |
| GPT-5.6 Sol | 1 | 33,581 | 39,371 | +5,790 |
| GPT-5.6 Sol | 2 | 35,539 | 32,703 | -2,836 |
| GPT-5.6 Sol | 3 | 33,663 | 33,313 | -350 |
Negative means /goal was better. Goal won four of six trials, so win rate alone makes the feature look useful. The means tell the other half:
| Model | Plain mean | /goal mean |
Mean effect | Median effect |
|---|---|---|---|---|
| Fable 5 | 32,386 | 33,145 | +759 worse | -192 better |
| GPT-5.6 Sol | 34,261 | 35,129 | +868 worse | -350 better |
Both models usually got a small benefit and occasionally suffered a large regression. That is why /goal won most runs but made both means worse.
Fable was also clearly stronger. Its plain mean beat Sol’s by 1,875 points, and its goal mean beat Sol’s by 1,984. More importantly, Fable plain stayed inside a tiny 319-point range while Sol plain spanned 1,958 points. Fable goal produced the best clean score, 31,934; Fable plain was the safest configuration.
Deep dive into the goal command
The same command hides two different systems
Claude Code and Codex both expose /goal, but the implementations are fundamentally different.
Claude Code: a separate evaluator
Claude Code implements /goal as a session-scoped Stop hook. After each main-model turn, a small evaluator model, Haiku by default, reads the condition and conversation. It returns yes or no with a reason. A no starts another turn; a yes clears the goal.
The evaluator cannot use tools or inspect files. It can only judge evidence that appeared in the transcript. That can catch an early exit, but it cannot know whether another ten million solver iterations are worthwhile.
Keep in mind that claude code is not open source, so we rely solely on what Anthropic tells us.
Codex: persisted state and lifecycle tools
I also read the source for the benchmarked release, Codex CLI 0.144.4. Codex treats a goal as persisted thread state:
- The TUI saves the objective for the active thread, and SQLite stores its status and budget accounting.
- The working model receives
create_goal,get_goal, andupdate_goaltools. - If the thread becomes idle while the goal is active, Codex injects a continuation turn with the objective and a completion audit.
Claude delegates completion to another model. Codex lets the working model declare completion, then resumes it while the persisted goal remains active. Claude’s evaluator is independent but sees only the transcript; Codex sees the files and tools but effectively grades its own work.
Why /goal can win most runs and still be a bad default
On a normal coding task, progress is often legible: another turn can fix a test or complete a migration. Optimization is different. Once an agent chooses a solver, extra time can amplify either a good decision or a bad one.
That is exactly what happened here. Goal helped when it sustained Fable’s fast compiled portfolio or Sol’s successful chain repartition. It hurt when Fable built a slow solver or Sol committed to an exhaustive anchor sweep. The median moved slightly in the right direction; the bad tail moved much farther in the wrong one.
Limitations
This is one unpublished NP-hard task, not a general coding leaderboard. Only Fable and Sol have three clean matched pairs. Other comparisons mix prompts, wrapper versions, and time limits, and the trials ran sequentially through subscription services that may have drifted.
The containers exposed eight CPUs despite task metadata declaring one, which favored Fable’s parallel portfolios. Every scored Fable and Sol output was valid, partly because the wrapper required early checkpoints and final verification. The benchmark measures the complete system: model, CLI, prompt, subscription service, and harness.
Reproducing this
The benchmark task, wrappers, analysis scripts, figure generator, and full evidence memo are in CLIArena. Raw job directories are excluded from Git because of their size, but the memo records every publishable score, city breakdown, elapsed time, strategy, exclusion, and run ID.
The primary commands are:
RUN_ID=article-kiro-YYYYMMDD-clean \
PHASE=nohint-all \
./scripts/run_subscription_article_matrix.sh

uv run python scripts/summarize_subscription_article_results.py RUN_ID...
uv run python scripts/analyze_subscription_article_results.py RUN_ID...
The result I would put in the headline is not that goal helps or hurts. It is that a persistence feature can win most individual trials while making observed average performance worse. On a hard optimization problem, the quality of the loop matters less than the quality of what the loop keeps doing.

Diffusing Blame: Dale-Constrained Learning Without Weight Transport
Sakana AI's 'Diffusing Blame' algorithm trains neural networks without weight transport, moving closer to how biological brains function.
Decoder
- Dale's Principle: The biological hypothesis that a single neuron releases the same type of neurotransmitter at all its synaptic terminals, making the neuron either excitatory or inhibitory.
- Weight Transport Problem: The requirement in standard backpropagation that the backward pass must use the exact transpose of the forward weight matrix, which is considered implausible in biological neural systems.
- PPO: Proximal Policy Optimization, a reinforcement learning algorithm used to train agents by balancing exploration and exploitation.
Original article
Introducing "Diffusing Blame": can a neural network learn competitively while strictly obeying Dale's principle, the rule that real neurons follow? We show it can, across both image classification and reinforcement learning.
Real neurons generally follow Dale’s principle: each neuron is predominantly excitatory or inhibitory. Standard artificial networks usually ignore this constraint, allowing every unit to mix positive and negative outgoing weights. Backprop makes the gap even wider. Its backward pass needs exact transposed copies of the forward weights, the so-called "weight transport problem,” which biology doesn’t seem to have a mechanism for.
So we asked: can a network that strictly enforces Dale's principle still learn well, without weight transport? Our approach builds on Error Diffusion (ED), a local rule that routes a single global error signal directly to every hidden unit, where each layer is split into separate excitatory and inhibitory streams with four non-negative weight matrices, so a synapse's sign comes from fixed population identity rather than a learnable weight.
Our main contribution is to extend ED from binary to multi-class problems via modulo error routing. We then asked whether this routing mechanism could provide useful credit signals in the noisy setting of reinforcement learning. During PPO training on Ant, Humanoid, and HalfCheetah, we compared each local ED update with the corresponding true backpropagation gradient. Among the routing schemes we tested, modulo routing consistently produced the strongest alignment.
Taken together, these results show that Dale-constrained networks can still learn without transporting weights backward, suggesting a potential path toward learning rules that are both effective and more biologically plausible.
Kimi Code CLI (GitHub Repo)
Moonshot AI’s new terminal-based coding agent features a native TUI and supports external tools like MCP servers and sub-agents.
Decoder
- TUI (Terminal User Interface): A command-line interface that uses text-based controls rather than a graphical window, offering higher performance and lower resource usage.
- MCP (Model Context Protocol): An open standard for connecting AI assistants to data sources and development tools, enabling standardized communication between agents and external systems.
- ACP (Agent Client Protocol): A communication standard that allows code editors and IDEs to drive AI agent sessions over a stdio stream.
Original article
Kimi Code CLI
What is Kimi Code CLI
Kimi Code CLI is an AI coding agent that runs in your terminal — it can read and edit code, run shell commands, search files, fetch web pages, and choose the next step based on the feedback it receives. It works out of the box with Moonshot AI’s Kimi models and can also be configured to use other compatible providers.
Install
Install with the official script. No Node.js required.
- macOS or Linux:
curl -fsSL https://code.kimi.com/kimi-code/install.sh | bash- Homebrew (macOS/Linux):
brew install kimi-code- Windows (PowerShell):
irm https://code.kimi.com/kimi-code/install.ps1 | iexOn Windows, install Git for Windows before first launch because Kimi Code CLI uses the bundled Git Bash as its shell environment. If Git Bash is installed in a custom location, set
KIMI_SHELL_PATHto the absolute path ofbash.exe.
Then, run it with a new shell session:
kimi --versionQuick Start
Open a project and start the interactive UI:
cd your-project
kimi
On first launch, run /login inside Kimi Code CLI and choose either Kimi Code OAuth or a Moonshot AI Open Platform API key. After login, try your first task:
Take a look at this project and explain its main directories.Key Features
- Single-binary distribution. Install with one command: no Node.js setup, PATH gymnastics, or global module conflicts.
- Blazing-fast startup. The TUI is ready in milliseconds, so starting a session never feels heavy.
- Purpose-built TUI. A carefully tuned interface, optimized end to end for long, focused agent sessions.
- Video input. Drop a screen recording or demo clip into the chat and let the agent watch what is hard to describe in words — turn a reference clip into a LUT, a long video into a short, a screen recording into working code, and more.
- AI-native MCP configuration. Add, edit, and authenticate Model Context Protocol servers conversationally with
/mcp-config, without hand-editing JSON. - Rich plugin ecosystem. Install skills, MCP servers, and data sources from the marketplace or any GitHub repo, with each install's trust level surfaced up front.
- Subagents for focused, parallel work. Dispatch built-in
coder,explore, andplansubagents in isolated contexts while keeping the main conversation clean. - Lifecycle hooks. Run local commands at key points to gate risky tool calls, audit decisions, trigger desktop notifications, or connect to your own automation.
- Editor & IDE integration (ACP). Drive a Kimi Code CLI session straight from Zed, JetBrains, or any Agent Client Protocol client with
kimi acp.
Use it in your editor (ACP)
Kimi Code CLI speaks the Agent Client Protocol, so ACP-compatible editors and IDEs (Zed, JetBrains, …) can drive a session over stdio. Log in once, then point your editor at the kimi acp subcommand — no extra login needed.
For Zed, add this to ~/.config/zed/settings.json:
{
  "agent_servers": {
    "Kimi Code CLI": {
      "type": "custom",
      "command": "kimi",
      "args": ["acp"],
      "env": {}
    }
  }
}
Docs
- Getting Started
- Interaction and approvals
- Sessions
- Using in IDEs (ACP)
- Configuration
- Command reference
Develop
Requirements: Node.js ≥ 24.15.0, pnpm 10.33.0.
git clone https://github.com/MoonshotAI/kimi-code.git
cd kimi-code
pnpm install
pnpm dev:cli
pnpm test
pnpm typecheck
pnpm lint
pnpm buildAcknowledgements
Our TUI is built on top of pi-tui. We thank the authors of pi-tui for their valuable work.
License
Released under the MIT License.

Alibaba open-sources its AI chip software stack at WAIC, targeting Nvidia's CUDA lock-in
Alibaba has open-sourced its SAIL software stack to help developers migrate AI workloads away from Nvidia’s proprietary CUDA.
Decoder
- CUDA: Nvidia’s proprietary parallel computing platform and API that allows software to use GPUs for general-purpose processing, serving as the industry standard for AI training.
Original article
Alibaba’s T-Head open-sourced SAIL, the software stack for its Zhenwu AI chips, at WAIC in Shanghai. It aims to lower the barrier to migrating off Nvidia’s CUDA.
Alibaba’s chip design unit T-Head announced at the World AI Conference in Shanghai on Saturday that it is open-sourcing SAIL, the full software stack for its Zhenwu series of AI chips. The move is designed to lower migration barriers for developers currently locked into Nvidia’s CUDA ecosystem. T-Head said programmers can adapt SAIL to mainstream AI frameworks in under seven days.
The vast majority of AI developers globally write software using CUDA, Nvidia’s proprietary toolkit for programming GPUs. That dependency effectively locks them into buying Nvidia hardware, a dynamic that has helped the company reach a $3.4 trillion market cap. Xi Jinping used the same conference on Friday to argue that no single country should monopolise AI, and T-Head’s open-sourcing of SAIL is the infrastructure-level expression of the same argument: if China wants AI independence, it needs to break the CUDA lock-in at the software layer, not just build alternative chips.
T-Head is not alone. Huawei open-sourced CANN, the software platform for its Ascend AI processors, in 2025. Moore Threads has pursued a similar strategy with its own GPU stack. All three are competing for the same developer migration: getting AI engineers to write code that runs on Chinese hardware without losing access to frameworks like PyTorch. The challenge is less technical than habitual. CUDA has a 17-year head start and the largest library ecosystem in the industry.
For Alibaba, the timing is loaded. Anthropic accused Alibaba’s Qwen lab of running the largest AI distillation campaign ever against a US company last month, and the Pentagon added Alibaba to its Chinese military companies blacklist in June. Open-sourcing SAIL positions the company as a contributor to open AI infrastructure while it fights those designations in court. The 560,000 Zhenwu chips Alibaba has already shipped to over 400 customers now have a publicly available software layer, which makes the ecosystem stickier and harder for any single government to shut down.

Why the first GPU financiers are turning to inference chips in a $400 million deal
General Compute secured a $400 million loan by using inference-specific chips as collateral, signaling a shift toward specialized, cost-effective AI infrastructure.
Decoder
- Inference: The process of using a pre-trained machine learning model to make predictions or generate data, which requires significantly less computational power than the initial training phase.
Original article
General Compute, an AI inference cloud startup, has landed a $400 million loan from Upper90, a tech investment firm. It might be the first deal to put up inference-specific chips as collateral — chips built to run already trained AI models quickly and efficiently, rather than the more expensive chips used to build the models in the first place.
The financing is the latest signal that markets are responding to concerns over the price of AI tools and tokens by turning to infrastructure that runs open source models more cheaply than the newest LLMs from frontier labs.
Founded by CEO Finn Puklowski and CTO Jason Goodison, General Compute raised a $15 million seed round in May to build an inference neocloud around silicon from SambaNova, an Intel-backed chipmaker. (Neoclouds are purpose-built for AI workloads, unlike the general-purpose infrastructure offered by traditional hyperscalers like AWS or Azure.)
The company’s SN50 chips are designed for inference. They’re power-efficient and don’t require expensive water-cooling systems, which means they can be deployed more quickly than GPUs across a larger variety of data centers. General Compute says the new chips will provide 16 times faster inference than GPU-based clouds.
The challenge is getting a lot of these chips, especially when you’re a brand-new company.
Upper90 co-founder and CEO Billy Libby, a former Goldman Sachs quantitative trader, had a playbook for this: In 2021, his firm financed GPU purchases by Crusoe, the energy-focused data center startup, which he believes was the first loan against the value of advanced chips.
Traditional lenders eschewed such deals at the time because of the risks and uncertainties around GPU depreciation. But as CoreWeave made chips-backed loans into a business model and then the basis of a blockbuster IPO, this kind of financing has become common.
“When we financed Nvidia GPUs as the first group to do that, the market was inefficient,” Libby told TechCrunch. “We could really put together something as an early participant, and kind of get compensated for the risk.”
Now that GPUs are comparatively well understood and perhaps over-bought, Upper90 is turning to companies like General Compute to ride the next wave of the AI boom. “We think open source models are going to be important, and we went and looked for a player last year that was in inference,” Libby said. “Everyone doesn’t need a supercomputer, but they do need inference and AI.”
That thesis has been growing stronger, with companies that provide access to open models, like OpenRouter and Fireworks, raising new rounds at huge valuations. New models like Kimi’s K3 have proven to compete with the latest releases from Anthropic and OpenAI on coding benchmarks. And new chipmakers like Groq and Cerebras have drawn interest from acquirers and public markets alike.
General Compute’s ability to access chips outside of Nvidia’s ecosystem matters for the same reason. TensorWave, another AI infrastructure company, is making a similar bet on a partnership with AMD. As more alternatives to Nvidia emerge, compute providers that aren’t locked into Nvidia deals may have an advantage in providing cost-efficient inference.
“There are a bunch of chips that are starting to scale that have amazing [total cost of ownership], or that can operate much faster than Nvidia, but there’s not too many buyers for them,” Puklowski said. “By getting together with Upper90, this is not just, ‘a cool startup got some money to buy some compute.’ Like, this is the first signal of capital organizing itself and the fragmenting of Nvidia’s monopolistic dominance.”
Google preparing Skills and Gemini Live for web rollout
Google is bringing real-time voice and reusable task shortcuts to the web version of Gemini.
Deep dive
- Gemini Live is being prepared for web and desktop platforms.
- 'Skills' are moving from Gemini Spark (the paid agent tier) to standard chat.
- Users will be able to build, upload, and edit custom skill instruction packages.
- The interface will likely include a dedicated menu for managing skill folders.
- These updates follow recent Chrome prompt-shortcuts and Gemini Enterprise connector enhancements.
- Technical development currently focuses on a new Gemini 3.6 Flash model while Gemini 3.5 Pro releases remain delayed.
Decoder
- Gemini Live: Google's real-time voice interaction feature that allows for conversational, interruptible audio dialogue with the AI.
- Gemini Spark: Google's specialized subscription tier that provides access to autonomous agentic features and deeper automation workflows.
Original article
Google appears to be preparing two notable additions to Gemini on desktop and web. In recent builds, a Gemini Live button has surfaced in the web version, suggesting the real-time voice mode may finally move beyond mobile. Live remains absent even from the desktop app today, though testing is reportedly underway within the scope of Google's Trusted Tester program, and a simultaneous debut across desktop and web looks plausible. Google itself promised new voice capabilities for the macOS app at I/O in May, and earlier signs in that app pointed to voice selection options and a screen-sharing overlay, so the groundwork has been visible for months.
The same builds also carry traces of skills being wired into regular chats. Skills currently live exclusively inside Gemini Spark, the autonomous agent Google gates behind its AI Ultra subscription, where they act as reusable instruction packages the agent applies to recurring tasks. The traces suggest ordinary chat users could soon:
- Upload their own skills
- Pick from predefined ones
- Build new ones from scratch
- Have Gemini generate a skill on their behalf, even without Spark access
Google is working on a native menu for Skills on Gemini desktop. These Skills may become available in all chats (fingers crossed). Users will be able to upload, create, and edit their Gemini Skills, as well as use Gemini to create them. Skill folders will also be available…
That would mirror what Claude and ChatGPT already offer, closing one of the more visible feature gaps in Google's assistant, and it fits a broader pattern: Chrome received a lighter prompt-shortcut take on skills in April, and Gemini Enterprise already lets workers invoke skills mid-chat.
Timing is the open question. Gemini 3.6 Flash appears to be in preparation while Gemini 3.5 Pro has slipped repeatedly, most recently past a mid-July target, so a stopgap model could arrive first. Something may surface on Google by the end of July, but nothing here has been announced, and plans of this kind can shift before launch. Together with Live on web, chat-level skills would make the everyday Gemini experience considerably more capable.
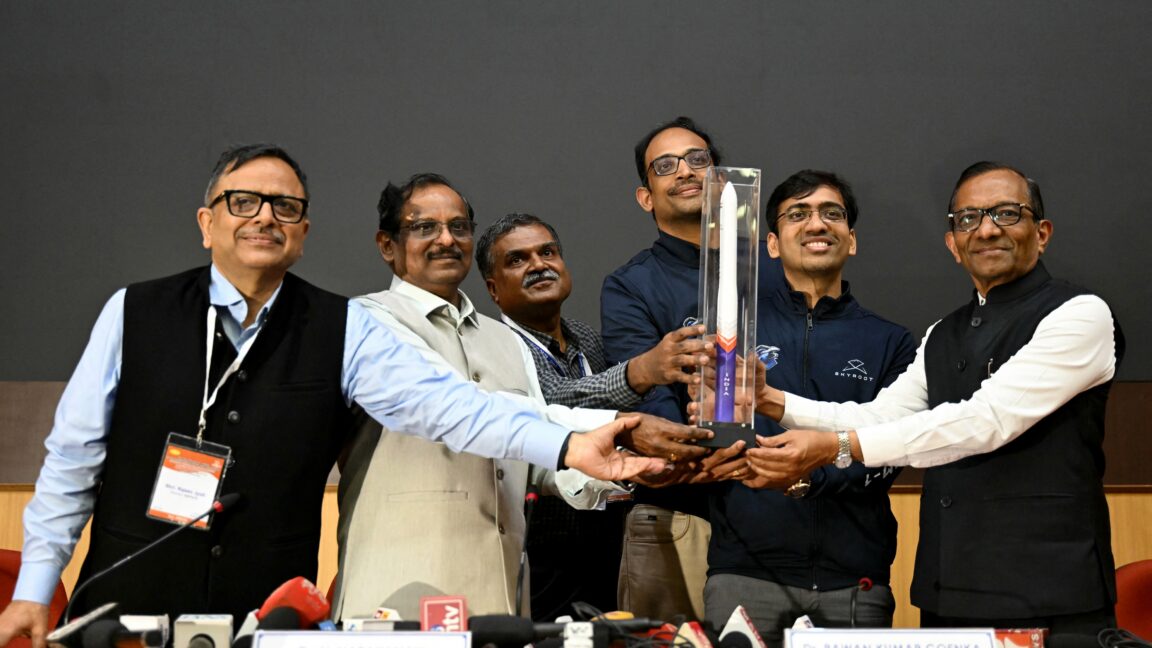
India's first privately-developed rocket reaches orbit on dramatic debut launch
Skyroot Aerospace became the first Indian private company to reach orbit with its Vikram-1 rocket, launching a successful 280-mile-high mission.
Decoder
- Orbital insertion: The process of maneuvering a spacecraft into a stable path around a celestial body like Earth.
- Cryogenic upper stage: A rocket engine stage using super-chilled liquid propellants (like liquid hydrogen and oxygen) to provide high efficiency for reaching high-velocity orbits.
Original article
Indian space officials celebrated the debut flight of Skyroot Aerospace’s Vikram-1 rocket, India’s first fully commercial satellite launcher, as a “grand success” Saturday after an on-target climb into a 280-mile-high orbit following liftoff from an island spaceport in the Bay of Bengal.
The Vikram-1 lifted off from India’s primary spaceport on Sriharikota Island at 1:35 am EDT (06:35 UTC) Saturday, around midday at the launch base along India’s southeast coast. The launch was delayed more than a half-hour to resolve a last-minute technical problem. The countdown resumed, culminating in the command to ignite Vikram-1’s solid-fueled first stage booster to propel the rocket off the launch pad.
Vikram-1 is modest in size compared to India’s larger workhorse rockets. Skyroot’s rocket stands about 72 feet (22 meters) tall, with the capability to place payloads of up to 770 pounds (350 kilograms) into low-Earth orbit. This makes Vikram-1 somewhat larger than the Electron launch vehicle developed by Rocket Lab, the world’s most successful dedicated small satellite launcher.
The flight Saturday went off without any major problems. Three solid-fueled rocket motors fired in succession to reach space, then a small liquid-fueled fourth stage ignited and accelerated to orbital velocity, some 17,000 mph. Live views from onboard cameras showed each phase of the launch sequence.
The only sign of anything unusual came during the separation of the rocket’s third stage from its fourth stage. The spent third stage motor appeared to remain near the fourth stage during a brief coast, rather than backing away to a greater distance. Nevertheless, the fourth stage did its job, firing its 3D-printed engine to reach an orbit approximately 280 miles (450 kilometers) high at an inclination of 60 degrees to the equator, quite close to preflight predictions, according to Skyroot Aerospace. US military tracking data confirmed the rocket’s successful arrival in orbit.
Beating the odds
“We achieved one of the biggest milestones ever in India’s space sector—the first private orbital rocket reaching orbit on the very first attempt,” said Pawan Kumar Chandana, Skyroot’s cofounder and CEO, in remarks to the company’s launch team. “It still feels like a dream, and you all made this dream happen.”
The first flights of new private orbital-class rockets don’t have a great track record. It took SpaceX four tries before reaching orbit with the Falcon 1 rocket for the first time in 2008. Rocket Lab’s Electron didn’t make it to orbit on its first launch in 2017. Blue Origin beat the odds with the inaugural flight of its heavy-lift New Glenn rocket in 2025, but the company’s engineers had previous experience with numerous launches of the smaller New Shepard suborbital rocket.
“On the first attempt, reaching orbit, I never thought it was possible,” Chandana said. “Skyroot’s team made it possible. A big, big, big shoutout to this phenomenal team, which made it happen. In fact, this launch was nothing short of a suspense movie.”
Skyroot officials set humble goals for the first launch of Vikram-1. In a press kit released before the flight, the company said its primary objective for the launch was to complete a successful liftoff, clear the tower at the launch site, and gather maximum data during ascent.
“The mission objective was only to lift off and clear the tower,” said Pawan Goenka, chairman of IN-SPACe, a government organization set up in 2020 to promote India’s commercial space industry. “That was only about 100 meters, but what we went to was 450 kilometers, and it also released all the satellites that were supposed to release. So the mission was absolutely perfect.”
In a statement, the Indian space agency, ISRO, said it offered “handholding and support” to the Skyroot venture by providing access to solid rocket motor casting and test facilities at ISRO’s spaceport on Sriharikota. ISRO also allowed Skyroot to launch from one of its two active launch pads.
Painted blue and white, the Vikram-1 is made of lightweight carbon composite materials and is named for the Indian physicist Vikram Sarabhai, considered the father of the Indian space program. Skyroot successfully launched a suborbital rocket, Vikram-S, to an altitude of nearly 300,000 feet (90 kilometers) in November 2022.
The Vikram-1 builds on lessons learned with Vikram-S. Skyroot’s future roadmap includes the Vikram-1U, with additional strap-on solid rocket boosters to haul heavier payloads, and the Vikram-2, which will debut a cryogenic upper stage to reach a payload capacity of 2,000 pounds (900 kilograms) to low-Earth orbit. The initial purpose of the Vikram rocket family is to “deliver dedicated and responsive launch services for small satellites,” Skyroot officials wrote in the press kit for Saturday’s mission.
But the company has loftier ambitions. In an interview ahead of the first Vikram-1 launch, Chandana told Ars his aspiration for Skyroot involves larger liquid-fueled fully reusable rockets, with a “daily cadence” from multiple countries.
Skyroot will need a lot more funding to realize that dream, but Saturday’s launch showed the company has ingredients required for a successful launch company. Saturday’s launch vaulted Skyroot to a plane above any other space startup in India, or, for that matter, in any country outside of the United States and China. Skyroot has, so far, raised approximately $160 million in capital, bringing the company’s valuation to $1.1 billion. Skyroot now has more than 1,000 employees, mostly working out of the company’s headquarters in Hyderabad. The average age of Skyroot’s workforce is 28 years old.
Skyroot’s breakthrough launch comes as India’s government, led by Prime Minister Narendra Modi, seeks to supercharge the country’s space industry. India has long had a robust space program, with government-developed rockets such as the Polar Satellite Launch Vehicle and the larger LVM3 often attracting commercial customers from the United States and Europe. India became the fourth country to successfully land a spacecraft on the Moon in 2023, and is working on an oft-delayed human-rated crew capsule to fly astronauts to low-Earth orbit.
Modi has told the Indian space industry to increase its annual launch total from about five launches per year to 50 before the end of the decade. The prime minister called Chandana and congratulated the Skyroot team after Saturday’s launch.
“This is a defining moment in India’s space journey,” Modi said in a statement. “The growing participation of our private sector is opening new frontiers and accelerating innovation. This achievement will encourage countless youngsters to dream bigger and innovate fearlessly.”
Chandana, a former engineer at India’s space agency, founded Skyroot in 2018 with another ISRO scientist, Naga Bharath Daka. They decided to focus on developing a solid-fueled launcher first, optimizing for what Chandana described as the lowest development time and the lowest cost per launch. “We wanted to get to an orbital launch vehicle in a few years,” Chandana told Ars.
“It’s a test launch,” he said at the time. “Statistically, the first launch from a private company almost always fails. It’s very difficult to succeed with all new systems. But I think we have done everything we can do to ensure the first launch goes well.”
Indeed, the first launch went very well, exceeding all expectations. A second Vikram-1 launch could happen before the end of the year, Chandana said.
“This is a 100 percent designed in India rocket, a 100 percent made in India rocket, built by 100 percent Indian people, for India and for the world,” Chandana said after the launch Saturday. “This was a historic moment for India, but also a very proud moment for the global space sector because the world needs more access to space.”
An AWS billing bug sent users estimated charges of up to $2.5 trillion
A billing subsystem error caused AWS to display catastrophic account estimates of up to $2.5 trillion, highlighting the risks of massive compute scale.
Deep dive
- Incident scope: Users saw estimates ranging from thousands to $2.5 trillion.
- Root cause: A failure in the Billing Console's estimated billing computation subsystem.
- AWS Response: Paused updates within 90 minutes and initiated a full recomputation of billing data.
- Context: The bug occurred alongside a separate AWS CloudFront outage, amplifying user concerns regarding infrastructure stability.
Decoder
- S3 (Simple Storage Service): An object storage service offered by AWS.
- CloudFront: A content delivery network (CDN) operated by Amazon.
Original article
TL;DR
An AWS billing bug sent users estimated bills in the billions and trillions. Amazon confirmed it was a unit pricing error and is recomputing all estimates.
AWS users woke up Friday to find estimated billing emails showing charges ranging from hundreds of millions to $2.5 trillion. A unit pricing error in the AWS Billing Console’s estimated billing computation subsystem was the cause, Amazon confirmed. One Reddit user whose charges totalled $0.19 last month received an estimated bill of nearly $2.5 billion. Others reported estimated monthly charges between $126,000 and $2.5 trillion.
“The displayed billing estimates do not reflect actual usage and charges,” AWS said. The company identified the root cause within 90 minutes, describing it as “an issue with unit pricing within the estimated billing computation subsystem.” AWS paused estimated bill updates so the inflated figures would not increase further, and said it has begun recomputing all billing data. Corrected amounts should appear by Saturday, July 18 at noon Pacific time.
The bug triggered panic before users realised it was an error. “I nearly had a heart attack when my two S3 buckets with a few MBs of data generated a half-billion-dollar forecast,” one Reddit user wrote. Another posted: “Needless to say, I panicked and destroyed everything on this account.” AWS committed $1 billion to forward-deployed AI engineers last week, and the billing bug is an unwelcome reminder that the infrastructure running AI workloads worth billions per month is also capable of generating billing errors of the same magnitude.
The incident comes a day after a separate AWS CloudFront outage served errors instead of websites. Cloud infrastructure is handling unprecedented spending volumes as AI demand pushes monthly compute bills into the hundreds of millions for individual customers, making billing system reliability a higher-stakes problem than it was when the largest bills were measured in thousands.
Are the LLM Wars the Database Wars?
LLMs may follow the path of databases: starting as high-profile, competitive industry wars before becoming invisible, ubiquitous infrastructure.
Deep dive
- The hype cycle: High-excitement technology often transitions into mundane infrastructure over decades.
- The database pattern: Early competitors (Oracle, Sybase) focused on feature benchmarking, while eventual winners (PostgreSQL, SQLite) focused on ubiquity.
- Lessons for AI: The current competitive landscape for frontier models may be replaced by specialized or embedded models that are integrated into workflows without significant developer choice.
Decoder
- SQLite: A C-language library that implements a small, fast, self-contained, high-reliability, full-featured, SQL database engine.
Original article
Are the LLM Wars the Database Wars?
Large language models may not stay a revolution. They may become infrastructure, the way the database did, used everywhere and noticed by nobody.
In 1994 the database was the most exciting technology in the building. Oracle, Sybase, Informix and IBM competed on benchmarks. The pitch was that you would put every record your company had into one engine and ask it anything. Keynotes drew crowds. Careers were built on the choice of platform. The company that queried best would win.
Thirty-two years later the database has won and disappeared. It runs every application you used today, and nobody writes about it. It is a line in a configuration file. You pick it once, forget it, and think about it again when it breaks. The same description could fit a model in 2036.
But look at who won. Sybase was bought by SAP and went quiet. Informix was bought by IBM and became a footnote. Oracle is still here, mostly as an invoice. Neither of the engines that actually won was in the 1994 race. PostgreSQL became the default, and it is an open project rather than a product. SQLite runs inside every phone, browser and app, roughly a trillion copies, and you have never configured it.
Nobody chose them. The engines that ended up everywhere were not the ones being argued about.
If models follow the same path, the launch is the wrong thing to watch. Watch for the SQLite, the one that wins without being chosen.
This is not a prediction. Important and exciting are different things, and most technology moves from the second to the first. The database did. Electricity did. Maybe models are partway. Maybe the comparison is wrong. Nobody knows.
Domain-specific harnesses
The future of domain-specific AI lies in modular harnesses and memory management rather than fine-tuning individual model weights.
Deep dive
- Transition from model-centric to harness-centric: Specialization is moving into the environment surrounding the model.
- The role of the harness: Manages memory, instructions, permissions, and tool execution.
- Memory as a domain-specific asset: Codifying information into graphs or ontologies allows the agent to navigate domain-specific hierarchies effectively.
- Tooling as interface: Using search, file access, and APIs to enforce domain-specific workflows and validation.
- The trade-off: While post-training model weights can provide slight performance gains, the diminishing returns favor general models with robust agentic workflows.
Decoder
- Harness: A software layer or wrapper that provides a model with instructions, tools, and memory, effectively turning it into an agent.
- Stateless model: A model that does not retain knowledge of previous interactions unless the state is explicitly provided in the current prompt or context.
- Compaction: The process of maintaining a model's working context by selecting which information to persist and which to discard.
Original article
Domain specific harnesses
The idea used to be a domain specific language model. It was theoretically sound: build a tokenizer that could represent in-domain tokens effectively, pre-train or fine-tune model weights on in-domain language, and build a specialised model.
But domain specific large language models never really took off. There was always the trade-off, loss of generality, which would hurt the system. Small language models built for a specific task, like classification fared better, but most demand is for a single model
Now, we see that different workloads perform better with certain combinations of model and harness. There are a number of modular less opinionated harnesses that can be forked (like pi), and numerous enterprise harnesses are already open source (codex, qwen code, opencode, gemini cli, grok build, and so on), so the building blocks are there.
The harness manages memory, controls how the model retrieves information, and how it plans work and uses tools. A model is stateless and the harness supplies the instructions, permissions, context, and tools it needs. We no longer rely on specialisation centred around model weights, and move it further into the environment around the model.
Memory handles how an agent codifies and persists information. Memory is a clear target for domain-specific applications as the hierarchy of information per-domains can be specified as a graph or ontology.
Compaction has to handle the model’s working context by maintaining a durable state. This includes retrieval, instructions, task state, checkpoints, and links to the memory system. Specifically for us, what it preserves, how it represents it, and what it is allowed to discard. If i’m working in IE a legal domain, I will not discard raw file references- I will persist an artifact that allows the model to explicitly look up the original text. Whereas if i’m working in another domain where a conceptual summary is more important i’ll allow the agent to do so.
Tools provide the model with ways to observe or change the outside world: search, file access, code execution, APIs, databases, and so on. They can encode domain-specific inputs and outputs, operations and validation loops. This allows us to enforce the correct use of domain-specific data, or force the agent to cross-reference a database before making a change, and so on.
The counter-argument to the domain-specific harness is that each frontier model provider post-trains their model on their harness. That is, which tools to call, when to call them, what arguments they expect, how validators respond, how to recover from errors, when to use memory, and so on. And there will always be some juice to be gained from adjusting model weights to its environment. But given the current general capability of models, the importance of this is diminishing, just as with domain-specific fine tuning, and a retry loop with a comprehensive error message will mean that most models never get a tool call wrong a second time.
Reviewing AI-generated code
Thomas Depierre argues that empirical evidence on code review efficiency suggests AI coding assistants may actually decrease productivity rather than increase it.
Deep dive
- Review Limits: Empirical studies show diminishing returns on code reviews exceeding one hour or 400 lines of code.
- Intern Analogy: AI agents exhibit 'hallucination' risks similar to junior developers, necessitating thorough supervision.
- Quality Gap: Existing studies suggest human reviewers tend to trust AI output more while finding fewer defects than in human-written code.
- Process Mismatch: Promoting AI for generating complex, hard-to-review code (like shell scripts) worsens the reviewer's cognitive burden.
- Call for Evidence: The industry needs more rigorous scientific studies on AI code review performance instead of anecdotal success stories.
Decoder
- LOC/H: Lines of code reviewed per hour, a metric used to evaluate code review efficiency.
- TDD (Test Driven Development): A development practice where tests are written before the corresponding functional code.
Original article
Reviewing AI Code Is Not A Viable Argument
I am a skeptic of the utility of LLM in software development. It is not because of IP laws problems (even if they are highly problematic), nor is it for ecological and ressource comsumptions reasons. It is not even for “they are all crap” reasons. My problem with LLM Coding Assistants is that I cannot see, in the face of the scientific evidence, how they can help someone write code better or faster.
And the thing that irritate me is that it seems that none of the proponents of LLM Coding Assistants seems to ever address this problem and this evidence when they defend their tooling choices. Worse, it seems that they give fuel to my arguments everytime they write a rebuke of the skeptics. So let’s look at what I have a problem with, how empirical scientific research support that view, how proponents of LLM Coding Assistants could show this is not a problem and then how right now they are doing the actual opposite.
Note: This piece was written nearly a year ago, hence why you may find vocabulary, like “Coding Assistants” that has been mostly replaced at this point. Sadly, I have not been able to find a term in the current vocabulary around genAI used to code that covers all the use case. So I kept the “Coding Assistants” wording.
The Intern Problem
The fundamental problem of LLM Coding Assistants that my criticism center on is their relatively high risk of getting things wrong. For all kind of reasons, some structural to how LLM works and other more akin to the interfaces we provide to interact with them, LLM Coding Assistants get things wrong. It can be hallucinations, typos, simply doing something that is not linked to the task demanded, going into a different path, etc etc.
A lot of people I have talked about that experimented with LLM Coding Assistants explains that they feel “Like an intern”. Like an intern, you should not expect too much from them, you should expect that everything they do will be more or less wrong, and that they have no idea what they are doing, but are highly enthusiastic. I see they never got me as an intern. I was definitely not enthusiastic.
And their answer to that problem, the one you will see all over the internet, is simple. You just do the same thing that you do with interns and junior developers in your team. No, they do not mean you put everything they did in the bin and forget about it. What they mean is that you should review all the code yourself. I mean, you are the human that know better. And you are the one responsible for the code anyway. And on top of this, you are doing that for all the code that get into your codebase anyway, you do not let code get in without a review, right?
What We Means When We Say Reviews
First of all, I want to be clear here. There are different practices in the litterature and in the profession grouped under the term “review”. So let’s be explicit here. Seeing the degree of (mis)trust and potential mistakes there, we should not accept the kind of “lightweight and heavily distributed” reviews that we see the most in our industry as the standard for LLM Coding Assistants supervision by a professional developer. They are not a bad thing to do, nor are they inefficient, but they have been shown in the litterature mostly as good to distribute knowledge of changes and as a way to enforce all kind of surface level rules.
For AI Coding Asssistants, we will need a proper “code review”. Not something as formal and complex as reviews of old, by committees, painstakingly checking every line one by one over a few hours. But still, we want something quite involved and complete. After all, these are interns writing sometimes highly complex code. And if there is something we know in software, it is that the devil can be in the details.
The Limits Of Reviews
Without going into some philosophical depth of reviewing as a practice, there is a glaring problem in this idea. From all the research we have, we have learned, empirically a few things about code reviews. And the evidence is relatively solid here, within reasonable limits. You will see that these do not matter there.
- A review that last more than 1h is too long.
- A review that has to be effective cannot be more than 400LOC at a time, in that time.
Empirical research has shown that reviews that are longer than 1h quickly reach diminishing returns whatever is the size of the code being reviewed. So this is not only that people cannot find bugs anymore after 1h because they already thoroughly reviewed most of the code. No, it is more linked to the fact that after 1h at that level of attention, people start getting tired, bored and simply need some time off.
Of note is the total absence of research as far as I could find, on the recovery time needed between review sessions of 1h. So I canot tell you how frequently someone could do 1h review sessions. But we could probably accept an extreme maximum limit of a handful per day. Which is probably far more than most people could do, I would probably put the average at 2, but eh. That is still in the right ballpark.
The second limit that has been seen in empirical research is that speed, that is number of Lines Of Code per Hour (LOC/H) is highly variable, mostly depending on the context of the code, the kind of code being reviewed, experience, knowledge and the rest of your expected reasons. But something that is regularly pointed out is that, even if there is no hard cut off, it seems that a maximum of 400 LOC/H is a good maximum speed acceptable for efficience, as nearly no review above this speed seems particularly effective in the empirical data at finding and flagging defects.
What It Means For LLMs
So, if we combine the claim that the solution to LLM Coding Assistants problems is to review the code, with the empirical evidence from scientific research on code reviews, what do we get? For every 400 LOC written by a LLM Coding Assistants (at best, less for code that are hard to review), we need one professional senior developer to spend 1h of his time reviewing the code. And he only has between 10 to 40 of these reviewing slots per week, with a recovery period in between of unknown lenght, but probably of at least an hour or two.
And that is without taking into account that these slots of intense concentration are probably in high demand. Meetings, code to think through, design sessions, incidents, etc. You better hope you can take all of them. This means that in the best case scenario, a developer using a LLM Coding Assistant can write, review and commit, at best, a few thousands LOC per day to a codebase. And that is the best case scenario, a more realistic one is less than 1k LOC per day.
If that sound high, remember that this comprise everything. Boilerplate, tests, migrations, configuration, etc. And that this is the best case scenario, where most of the code is boilerplate and easy to review. I have basic unique test files that are more than 400 LOC. So the productivity of said developer is not going to be really high. Hell, if anything, this sounds like a real ceiling to how good these LLM Coding Assistants can help in writing code.
But Wait, It Gets Worse
This makes the “It is ok, you just have to review everything like usual” argument complex to believe in. After all, even if they were right, it would not really provide a speed up or that much more productivity, due to the limits of code reviews. On top of this, remember that this is empirical evidence coming from research on how human reviewers find human coders defects in code. We have no evidence that humans reviewing LLM Coding Assistants code are as efficient as code review by humans of humans code. If anything, we have some tentative evidence that humans that review code generated by LLM Coding Assistants are more confident that they found all the defects, while finding less defects.
The output of Human Reviewer teamed with a LLM Coding Assistants is of lesser quality than the one of Human Reviewer teamed with a Human Coder. But the reviewer in the first case believe that they did a better job. So not only is the “just review everything” practice leading to high limits on productivity benefit of using the LLM Coding Assistants, we do not even have solid proof that it even works at all to fix the problem of LLM Coding Assistants being wrong, a lot.
Note that I never talk of the cost of fixing the defects here. I am only talking of the ability of professional developers, in a professional environment, of reviewing code in order to flag problems. This is not even about how costly the defects introduced by LLM Coding Assistants are. This is about how costly reviewing the code generated is. Whatever the defects are or how many of them there are. Even if the LLM Coding Assistants were extremely good, these costs would stay the same and the productivity hit the same limits.
I Mean, It Could Be Worse
Well. Bad News. It does get worse. There is a benefit of using LLM Coding Assistants regularly touted by developers that are proponents of them and are going all in in using them as part of their professional tools. It is that they can type and produce the code that is the most painful to author and deal with in your professional life. Here is a quote from a proeminent and visible “bash the skeptic” blogpost contemporary to me writing this, talking of what LLM Coding Assistants can produce.
Also: 100% of all the Bash code you should author ever again
I want to stop you there for a minute, so you can think through what the author mean here. He means that you do not have to write your shellscripts yourself. You can now let the computer, the LLM Coding Assistant, do that torturous painful part. No need to lose you sanity anymore, you can let the code that is the easiest to get wrong, the harder to review, the harder to understand you made a fatal mistake that will blow up everything be written and handled by the machine. The code that is so loose on parsing but also so semantically overloaded that a simple typo in a ponctuation could be utterly harmless or literally make you delete a whole computer. That code.
Well you can just let the thing that get everything wrong randomly all the time write it. And then you can just review it and never have to write it ever again. I mean what could go wrong. This is not like it is the hardest code to review for mistakes right? Right? RIGHT !? I mean, maybe they have not at all addressed the question of if we actually can review LLM Coding Assistant output in a way that works out.
But for sure, they are not touting as the main use of this the code that is also the hardest to review effectively. RIGHT ?! Yeah they are. And this is where they lost me. They do not stop at not engaging with the argument of “are you sure that reviewing the code solve the problems?” or the “but if we do all that reviewing,is it really more productive and better?”. No they go deeper. They offer the code that we know, as a professional field, is the hardest to review and get right, as the best application for LLM Coding Assistants.
What To Do To Make Me Calm Down
Ok, I will calm down. Sure, noone engaged with my argument, sure I keep pointing at problems, sure I yell wolf at people using these tools to make their life easier. All nice, keep yelling at cloud, but how could someone convince me? After all, I could be wrong, can’t I? I mean, if I use science all the time to support my point, I should also have some ideas of what could prove me wrong, no?
Yes. First of all, I would like to see empirical research on the ability of humans reviewers to find defect in LLM generated code. And how fast. And how much we can do it per day. We already have empirical study for this in reviewing code generated by humans, so if you want to convince me my argument is wrong, we will need a set of data that is human reviewing LLMs. We have some experimental data and some empirical data already, but the dataset is limited in size and in context. More reproduction would help. Note however that so far, the scientific data point that human are bad at reviewing LLM (or that LLM are good at avoiding detection). This is consistent with expectations, LLM are trained to evade detection. But maybe this was a fluke.
Secondly, you could try to show us how the review of LLM generated content is different from reviewing human generated content. Maybe all this data and empirical evidence we have is not applicable here. Maybe LLMs are sufficiently different that this is a qualitatively different problem. In which case, my arguments against LLM Coding Assistant fall apart. Note, once again, that so far there is tentative burgeoning evidence that reviewing LLM generated content is, indeed, different. But it is point at reviewing it being harder than human generated content, which would make the argument I present here even more powerful. So beware of what knowledge you search.
And Yet I Am Mad
The argument above is not the only reason I am an AI Skeptic, but it is probably the biggest one I have against LLMs Coding Assistants. Mostly, I cannot see, knowing all of this information about code reviews, how we can get benefit, as professional developers, out of LLM tools using this interface and process. It flies against everything we know about producing quality code.
But the thing that really drives me crazy is not that we keep getting these tools and process offered again and again by vendors, despite said scientific evidence. No what drive me crazy and angry is being called “nuts” by someone that never even engage with the problem or the question I asked. I have yet to see a single one of the AI proponent even engage with the problem or try to do empirical evidence research on this.
I am used to this behaviour. I have seen the same thing play again and again in our field around things like TDD, types systems, separating test and coding teams, CI/CD, devops, etc. Anecdotal data always win in our field, even if it flies against everything the empirical evidence shows. But still. I would like if our field stopped at bloodletting. Let’s try to have an actual discussion about ergonomics and empirical evidence. If you want to convince me, please stop calling me nuts or bringing anecdotal information about “hey this time it worked for me”. Start looking at how we got all this empirical evidence around code review in the first place and go do some studies. Please. Let’s use that moment to start taking our professional tools seriously.
Isolation levels: Read Committed, Repeatable Read, and Serializable explained
Database isolation levels often diverge from theory in practice, leading to unexpected anomalies like write skew in systems using Repeatable Read.
Deep dive
- Anomaly Types: A1 (dirty reads), A2 (inconsistent reads), and A3 (phantoms) define basic isolation weaknesses.
- Snapshot Isolation (SI): Many databases implement SI instead of strict RR, which blocks phantoms but permits write skew.
- Write Skew: A dangerous anomaly where two transactions read overlapping data, perform conflicting writes, and commit, leading to a non-serializable outcome.
- Implementation Differences: MySQL and PostgreSQL both exhibit unexpected behaviors (e.g., lost updates) under RR that diverge from academic theory.
- Best Practice: Use explicit row-level locking for critical operations to ensure safety across different database engines.
Decoder
- Write Skew: An anomaly in concurrent transactions where two processes make decisions based on a shared state that is then modified by the other, resulting in an invalid combined state.
- MVCC (Multi-Version Concurrency Control): A database technique that allows multiple versions of a row to exist to avoid locking during reads.
Original article
Repeatable Read vs Snapshot Isolation
Here’s a question: when you choose Repeatable Read isolation level in MySQL, does it actually give you Snapshot Isolation semantics instead? How different are they and why does it matter?
Theory
ANSI Standard Isolation Levels
PostgreSQL, MySQL, SAP, and many other databases implement the four common isolation levels which are defined in SQL-92 based on anomaly protection:
| Isolation | Summary | A1 | A2 | A3 |
|---|---|---|---|---|
| READ UNCOMMITTED | weakest | Yes | Yes | Yes |
| READ COMMITTED | basic atomicity | no | Yes | Yes |
| REPEATABLE READ | basic isolation | no | no | Yes |
| SERIALIZABLE | strongest | no | no | no |
Anomaly A1 is “dirty reads” (T1 sees the data T2 wrote before it commits, and indeed T1 might even see it if T2 is rolled back).
Anomaly A2 is “inconsistent reads” (T1 reads a row, T2 does something to it and commits, and T1 reads it again but gets a different value).
Anomaly A3 is “phantoms” (T1 reads some rows via a select predicate, T2 changes the set of rows matching that predicate, e.g. by adding a new row, and commits, and T1 reads again but this time the select results are slightly different due to the actions of T2, so they still aren’t perfectly isolated).
Theoretical Relation to Locking
A bit of an oversimplification, but in traditional theory, these levels were implemented by different locking regimes for phantom prevention, read sets, and write sets, e.g. none, short (only during the operation), or long (hold till the end of the transaction):
| Isolation | Phantom Locks | Read Locks | Write Locks |
|---|---|---|---|
| READ UNCOMMITTED | no | no | long |
| READ COMMITTED | no | short | long |
| REPEATABLE READ | short | long | long |
| SERIALIZABLE | long | long | long |
Note that the phantom prevention locks can take many forms, e.g. predicate locks, precision locks, gap locks, range locks, index locks, etc, but the basic goal is to make sure the matched set of a predicate does not vary, e.g. between repeated SELECTs in a transaction.
But in Reality
Modern databases don’t necessarily provide exactly these isolation semantics or implement them using the above simple locking regimes.
MVCC systems that can read at a specific timestamp are such a convenient tool and intuitive concept, they are widely used to achieve read set isolation and phantom prevention with less locking, higher performance, and higher concurrency. The practice is now quite prevalent.
Thus, PostgreSQL uses snapshot isolation internally, even in its default isolation level of Read Committed. MySQL also acquires a read snapshot as of the first select in a transaction, and uses the same snapshot during subsequent selects, in its default isolation level of Repeatable Read.
A careful review of the literature shows that Snapshot Isolation (SI) is very similar to Repeatable Read (RR), but they aren’t exactly the same. They are both stronger than Read Committed but weaker than Serializable. The best summary of their difference is that SI allows write skew but blocks phantoms, whereas RR blocks write skew but allows phantoms.
Let’s Experiment
MySQL
SET SESSION TRANSACTION ISOLATION LEVEL REPEATABLE READ;PostgreSQL
SET SESSION CHARACTERISTICS AS TRANSACTION ISOLATION LEVEL REPEATABLE READ;The Actual Write Skew Test
Terminal 1: Andy is checking whether it’s safe for him to take some time off:
BEGIN;
SELECT name FROM doctor WHERE oncall=TRUE AND name<>'Andy';
Terminal 2: Brad, the other doctor, has the same plan:
BEGIN;
SELECT name FROM doctor WHERE oncall=TRUE AND name<>'Brad';
UPDATE doctor SET oncall=FALSE WHERE name='Brad';
COMMIT;
Back at terminal 1: Andy thinks “quick let’s get in before anything changes”:
UPDATE doctor SET oncall=FALSE WHERE name='Andy';
SELECT name FROM doctor WHERE oncall=TRUE;
COMMIT;
Epilogue
Andy was bitten by the infamous write skew anomaly, which is not allowed under RR, but is allowed under SI. By the way, this happens in both MySQL RR and PostgreSQL RR. Simply put, Andy and Brad were operating from the same snapshotted read view, against which their writes were individually valid, but the two transactions overlap in a non-serializable way, and the combination of overlapping writes lead to an unacceptable outcome–there is nobody oncall.
Minor Plot Twist
It’s not exactly an unexpected plot twist, but it turns out RR in MySQL is weirder than you think. It is not really SI either, if you consider the lost updates anomaly, which should not be allowed in either RR or SI.
Lost Update Test
Terminal 1 (seeking to deposit $20):
BEGIN;
SELECT cash FROM account WHERE id=1;
While this is going on, in terminal 2 (seeking to deposit $30):
BEGIN;
SELECT cash FROM account WHERE id=1;
UPDATE account SET cash=130 WHERE id=1;
COMMIT;
Back to terminal 1, which saw a balance of $100:
UPDATE account SET cash=120 WHERE id=1;
COMMIT;
This is bad, it means the $30 deposit was overwritten. From the user’s perspective, either the total should be $150, or one of the transactions should have failed. This is a thing that can happen to you in RR isolation level on MySQL.
Some Advice re Lost Update
Although Serializable isolation level would prevented this problem in MySQL, if you are doing this type of transaction pattern, consider making the database aware of your intent by using SELECT ... FOR UPDATE.
Summary
People don’t always define terms in the same way (even when they think they do), and practice often diverges from theory. This is especially so in the world of database isolation levels.

Securing the AI supply chain on GKE: Introducing k8s-aibom for automated AI BOMs
Google Cloud's new k8s-aibom automatically maps running AI workloads to CycloneDX manifests, helping secure shadow AI in Kubernetes clusters.
Deep dive
- Detection: Identifies frameworks like vLLM, Triton, LangChain, and vector databases through image and environment inspection.
- Unprivileged: Runs as a standard Deployment without kernel-level access or sidecar containers.
- Deterministic: Uses a confidence model to categorize assets as 'Declared', 'Inferred', or 'Unresolved'.
- Audit-grade: Exports CycloneDX 1.6 ML-BOMs to immutable storage sinks (e.g., Google Cloud Storage).
- Compliance: Directly supports governance requirements from the EU AI Act, NIST AI RMF, and ISO 42001.
Decoder
- Shadow AI: AI workloads and tools implemented by employees or departments without IT or security department approval.
- CycloneDX: A lightweight software bill of materials (SBOM) standard for supply chain security.
Original article
Securing the AI supply chain on GKE: Introducing k8s-aibom for automated AI BOMs
How should your security team manage shadow AI? Workloads deployed by developers without formal registration can often evade traditional security scanners, because organizations are reluctant to slow down development and compromise stability by demanding privileged Daemonsets, kernel-level access, and manual pod-spec edits.
To break this deadlock, today we are open-sourcing k8s-aibom. This lightweight, unprivileged Kubernetes controller continuously monitors the cluster API and container environments to automatically detect running AI runtimes (like vLLM and Triton) and generate standard CycloneDX Machine Learning Bill of Materials (ML-BOMs).
By providing automated, audit-grade visibility directly from runtime execution — regardless of whether the workload was formally registered — k8s-aibom can help teams safely move AI projects from pilot to production without developer integration friction.
The architecture of zero friction
k8s-aibom is designed from the ground up to respect both the CISO mandate for total visibility and the SRE mandate for cluster stability. It deploys as a single, unprivileged Deployment in the k8s-aibom-system namespace. It involves zero developer friction — no sidecars, no eBPF kernel modules, no privileged DaemonSets, and no modifications to existing developer pod specifications.
k8s-aibom watches for AI workloads and produces BOMs.
The discovery pipeline executes through four clear stages:
-
Scrape cluster workloads: The controller continuously monitors KServe resources, Deployments, StatefulSets, DaemonSets, and Jobs across the cluster.
-
Identify AI stacks: Advanced pattern matching inspects container images, environment variables, and command-line arguments to detect serving runtimes (vLLM, Triton Inference Server, TGI, Ollama), autonomous agent frameworks (LangChain, AutoGen, CrewAI), vector databases and RAG stores (Milvus, Qdrant, pgvector), as well as distributed training jobs and evaluation harnesses.
-
Generate standard manifests: The controller compiles the discovered artifacts into formal OWASP CycloneDX 1.6 Machine Learning Bill of Materials (ML-BOM) documents.
-
Export to sinks: The controller attaches the resulting ML-BOM directly to the custom resource status (status.bomDocument) of an in-cluster AIBOM Custom Resource (CR) and routes it to optional external sinks, including Google Cloud Storage buckets and external webhook endpoints.
Application teams do not need to modify their pod specifications, inject sidecar containers, or alter their continuous integration and continuous delivery (CI/CD) pipelines. Furthermore, k8s-aibom treats the Kubernetes cluster state as a pure functional input: Identical cluster inputs produce byte-identical ML-BOM documents. This deterministic property makes k8s-aibom an ideal fit for GitOps workflows, enabling site-reliability engineers (SREs) to perform exact diffs and trigger precise change-detection alerts when AI dependencies drift.
Where existing AIBOM tooling falls short
Many AI BOM solutions offer build-time scanners producing BOMs from artifacts at rest. These tools help you track the code that was intended to be deployed.
Commercial AI security platforms extend the picture with cloud-native posture management, but typically through external scanning shaped around vendor-specific data models. Few, if any, of these tools help compliance reviewers, security operations (SecOps) teams, and platform engineers understand what is running right now, what is it connected to, and how can we verify those assertions.
We purpose-built k8s-aibom to bridge that gap. It produces BOMs from live cluster observation rather than artifact scanning, emits standards-conformant CycloneDX 1.6 ML-BOMs that integrate with the broader OWASP and Open Source Security Foundation (OpenSSF) supply-chain ecosystem rather than vendor-proprietary formats, and runs as an unprivileged controller on any conformant Kubernetes cluster — making it complementary to existing build-time and posture-management tooling rather than a replacement for either.
The Confidence Model: Separating intent from inference
For compliance auditors and SecOps engineers, raw telemetry is often noise. Standard monitoring tools indicate that a container is running, but can’t prove whether an AI model was explicitly configured by a platform engineer or dynamically pulled by an autonomous script at runtime. k8s-aibom solves this ambiguity through its deterministic Confidence Model, categorizing discovered assets into distinct tiers:
-
Declared: Explicitly defined by the customer or developer in the workload configuration (For example, explicitly passed container arguments such as --model meta-llama/Llama-2-7b.) A “declared” confidence detection represents clear human intent.
-
Inferred: Derived autonomously by the controller's pattern-matching engine through deep inspection of container images, environment variables, and execution profiles. (For example, identifying ^vllm/.* container signatures.)
-
Unresolved: Applied to workloads where an active AI presence is detected, but exact model parameters, weights, and versions can’t be deterministically established. An “unresolved” confidence detection immediately flags the workload for targeted security review.
This structured taxonomy allows compliance reviewers to instantly separate explicit engineering intent from machine inference, establishing an unassailable chain of trust during audits.
Immutability and least privilege: Building an audit-grade security model
Auditors remain deeply skeptical of standard observability telemetry because logs and metrics can be modified, dropped, and tampered with by compromised nodes or elevated administrators. k8s-aibom establishes an audit-grade evidence trail built on strict least-privilege isolation and data immutability.
The controller operates under a dedicated Kubernetes service account bound to a minimal Identity and Access Management (IAM) Workload Identity. It acts as the sole identity authorized to write BOM records to external storage sinks, requiring only roles/storage.objectCreator permissions.
To satisfy the most stringent audit and evidentiary standards, the Google Cloud Storage external sink implementation enforces DoesNotExist preconditions on object creation. Once an ML-BOM is written to the Cloud Storage bucket, the object becomes cryptographically immutable.
It can’t be silently overwritten, modified, or retroactively tampered with by compromised cluster actors or rogue workloads. SecOps teams gain absolute assurance that the historical audit log presented to regulators represents an unalterable record of cluster execution.
Accelerating governance readiness: Mapping to global regulatory frameworks
By automating the generation of standardized CycloneDX 1.6 ML-BOMs, k8s-aibom directly bridges the gap between low-level Kubernetes runtime state and high-level governance frameworks. It unblocks stalled GKE AI deployments by providing the foundational empirical data essential to major global standards:
-
EU AI Act: Designed to help organizations align with Article 12 (automated logging and record-keeping for continuous traceability) and Article 50 (transparency obligations for AI systems). By automatically cataloging serving runtimes and agent stacks, the tool helps simplify the gathering of technical evidence that may be needed during compliance audits.
-
NIST AI Risk Management Framework (AI RMF): Provides continuous, empirical asset visibility that can help support the Govern, Map, Measure, and Manage functions, helping shift compliance workflows from purely manual checks toward more automated asset inventory tracking.
-
ISO/IEC 42001:Supports compliance efforts for AI management system asset discovery and tracking, reducing the reliance on manual spreadsheets or periodic snapshot audits for inventory validation.
Getting started
It’s rare that a technical solution like k8s-aibom can help mitigate the multi-faceted problem of shadow AI, impacting CISOs, governance, risk, and compliance teams, SecOps teams, platform engineers, and developers.
To learn more by inspecting the controller, review the CRD definitions, and contribute to the open-source k8s-aibom project, please visit the k8s-aibom GitHub Repository.
Wigolo (GitHub Repo)
Wigolo is a new local-first web intelligence tool for AI agents that offers search, crawling, and extraction without API keys or usage fees.
Deep dive
- Tooling: Includes search, fetch, crawl, extract, and research tools with parallel query support.
- Local-first: Uses local embeddings and browser engines (via Node) to avoid network dependence and usage fees.
- Integration: Compatible with any MCP-supporting client including Cursor, Claude, and VS Code.
- Provenance: Provides byte-exact source spans and explainable scores for every search result.
- Privacy: Nothing leaves the local machine except when the user opts-in to an LLM for synthesis.
Decoder
- MCP (Model Context Protocol): An open standard for connecting AI assistants to systems, data, and tools.
- TUI (Terminal User Interface): A text-based user interface designed for interaction within a terminal window.
Original article
Full article content is not available for inline reading.
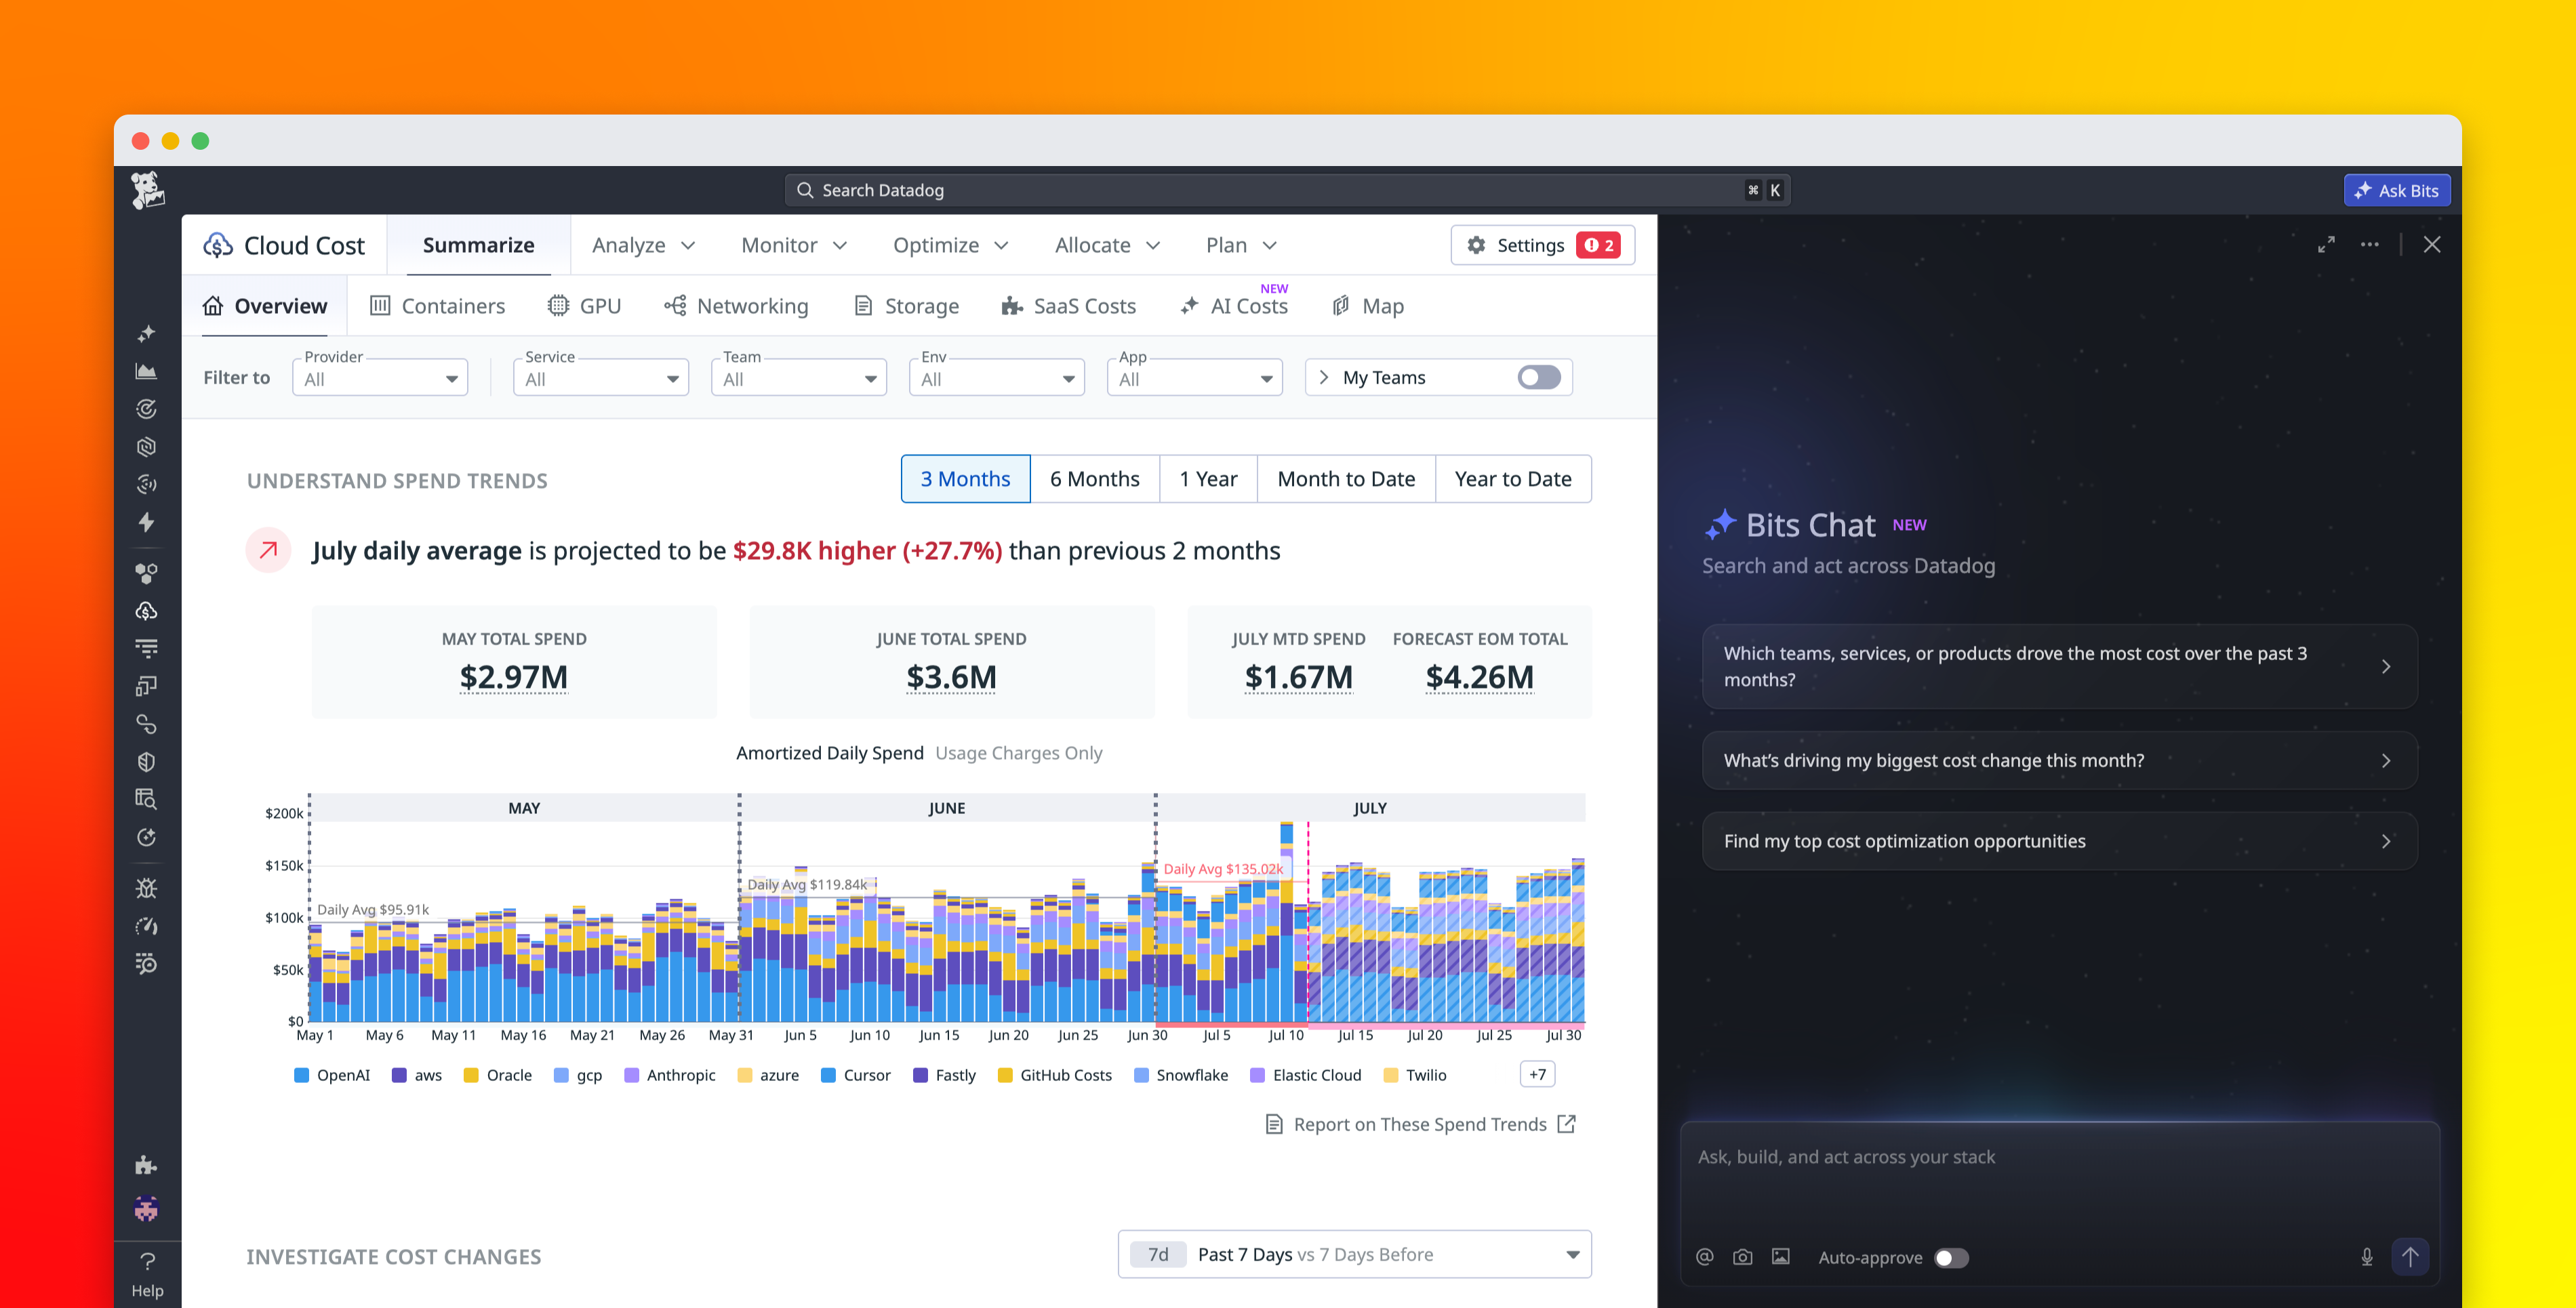
Answer any cost question faster with the Cloud Cost skill in Bits Chat
Datadog is integrating conversational cost analysis into its Bits Chat AI assistant to help teams debug cloud and AI spend in real-time.
Deep dive
- Bits Chat now supports direct cost investigation through plain-language queries.
- Features include root cause analysis by correlating cost spikes with specific team, service, or region usage.
- AI-specific spend tracking is available for providers including OpenAI, Anthropic, Amazon Bedrock, Google Gemini, Vertex AI, GitHub Copilot, and Cursor.
- The tool helps distinguish between spend increases caused by usage spikes versus model or configuration changes.
- Cost anomalies can be investigated in one click, pulling in relevant observability context automatically.
- Investigations can be exported into Datadog Notebooks for team review.
Decoder
- FinOps: A cultural and operational practice that brings financial accountability to the variable spend model of cloud computing.
- Observability: The ability to understand the internal state of a system by examining its output data, such as logs, metrics, and traces.
Original article
Managing cloud, AI, and SaaS costs means answering a steady stream of questions from finance, leadership, and engineering teams. What changed? Which team owns the spend? Was an increase expected? Are we still on track against the budget? When each answer requires moving between dashboards, filtering cost data by team or service, or manually correlating billing data with observability data, it can slow down investigations while costs continue to rise.
The Cloud Cost skill in Bits Chat brings Cloud Cost Management analysis into a conversational workflow. You can ask cost questions in plain language, investigate cost anomalies, and get answers grounded in both cost and observability data within minutes. In this post, we’ll show how you can:
- Ask Bits Chat anything about your costs
- Spot Anthropic cost spikes before they grow
- Find the root cause of a cost change
Ask Bits Chat anything about your costs
The Cloud Cost skill gives FinOps practitioners and engineers one place to ask cost questions without needing to know which dashboard to open or how to construct a query. You can get started with Bits Chat in the Datadog navigation bar, or you can start an investigation directly from a cost anomaly. From there, Bits Chat analyzes the relevant cost data and responds with a concise summary, then asks what you want to explore next.
Because the Cloud Cost skill works across many cost categories, including cloud, SaaS, AI, custom, and Datadog, teams can use the same workflow for any cost question. FinOps teams can use it to track budgets, identify cost owners, and investigate anomalies. Engineers can use it to understand the cost impact of their own services and workloads, and identify optimization opportunities. For example, you can ask Bits to investigate why Anthropic costs increased last week for team:web-store, identify which teams are driving the highest OpenAI spend this month, or show total AI cost by provider for the last 30 days.
Bits Chat can investigate cost monitor alerts, cost anomalies, and cost changes; identify teams, services, accounts, regions, or resources that are driving spend; and compare actual or forecasted spend against budgets. It can also correlate cost changes with observability metrics such as CPU, memory, request volume, and storage size. This gives teams the technical context they need to understand whether a cost change came from a usage increase, a configuration change, or another source.
Spot Anthropic cost spikes before they grow
AI usage can become expensive quickly, especially when costs are spread across providers, models, teams, users, and services. AI Costs in Cloud Cost Management gives FinOps and engineering teams a unified location for analyzing AI spend across providers such as OpenAI, Anthropic, Amazon Bedrock, Google Gemini, Vertex AI, GitHub Copilot, and Cursor. Datadog normalizes this spend so teams can understand which providers, models, users, and API keys are contributing to cost changes.
This level of granularity helps teams detect AI cost anomalies before they cause larger budget issues. For example, Datadog can surface an unexpected Anthropic cost spike that might otherwise go unnoticed until the next billing review. But identifying a spike is only half the problem—understanding what caused it is another. Without a connected cost investigation workflow, a team would need to pull billing exports, cross-reference logs, and search for the service or team that caused the change.
With the Cloud Cost skill, the team can start the investigation in one click. When the team clicks “Investigate” directly from the anomaly, Bits automatically pulls in the relevant context and kicks off a root cause analysis. This lets the team move from detection to investigation without navigating to a new page or having to do any manual work.
Find the root cause of a cost change
Once an investigation starts, Bits Chat performs root cause analysis by using both cost data and observability data from across Datadog. For a cost anomaly investigation, the initial analysis typically includes a daily cost chart for the baseline and investigation periods so you can see exactly when a change started. It also summarizes the total dollar change, percentage change, and projected annual impact when applicable.
Bits Chat also provides rate-versus-usage context, which helps teams determine whether spend increased because of a pricing change or because a team consumed more of a resource. For AI spend, this distinction is especially important. An Anthropic spike might come from more requests, larger prompts, higher output token usage, a model change, or a combination of these factors. By correlating cost with observability metrics, Bits can help connect the billing change to the system behavior behind it.
In the preceding example screenshot, Bits identifies that the Anthropic cost spike is driven by two teams: Customer Support (57%) and AI Platform (37%). Together, these teams account for the full $2,895.49 increase—a 188.15% jump—with a projected annual impact of $62,167.87. Instead of knowing only that Anthropic costs went up, the engineer can see exactly which teams are driving it and by how much, which makes it immediately clear who to loop in.
From there, the team can keep drilling into the investigation. Bits can find the top services, accounts, regions, resources, or tags driving the change. It can also compare actual and forecasted spend against related budgets, identify optimization opportunities, and create a Datadog Notebook that captures the investigation for the owning team. This helps preserve the full context, so the team does not need to reconstruct the analysis later from Slack threads or separate reports.
Get started with the Cloud Cost skill in Bits Chat
The Cloud Cost skill in Bits Chat helps FinOps and engineering teams investigate cost changes, budget risks, and AI spend in the same place where they already monitor their systems. By grounding answers in both cost and observability data, Bits Chat can help teams move from a broad cost question to an actionable explanation in minutes.
To get started, read the Cloud Cost skill documentation and make sure you’ve configured Cloud Cost Management for the cost sources you want to analyze. Users also need Bits Chat access and Cloud Cost Management permissions for the data they ask about. If you want Bits to create or update investigation records, you can also grant the relevant Notebooks permissions. Learn more in the Bits Chat documentation and AI Costs in Cloud Cost Management documentation.
If you don’t already have a Datadog account, you can sign up for a 14-day free trial to start investigating your cloud costs with Datadog.

What happens in the milliseconds after you tap pay
Databricks shows that modern lakehouse architectures can achieve 27ms median latency for real-time fraud scoring by using route-optimized model serving.
Deep dive
- Databricks Model Serving route optimization minimizes network overhead for inference requests.
- Lakebase Postgres supports autoscaling and low-latency feature lookups for model inference.
- The benchmark achieved 27.2ms median latency over 5,000 requests.
- Feature lookups averaged 8.9ms using persistent connection pools to avoid TLS handshake overhead.
- OAuth token rotation is handled within the connection pool to maintain connectivity without long-lived credentials.
- The architecture processes both business rules and statistical inference from the same underlying database table.
Decoder
- Route Optimization: A networking feature in Databricks that shortens the path between the application and the inference container to reduce latency.
- Lakebase: A managed PostgreSQL service within the Databricks platform designed for transactional workloads.
- Lakehouse: A data architecture that combines the performance of a data warehouse with the flexibility of a data lake.
Original article
- A sample Databricks App (FastAPI + React) that scores credit card transactions for fraud in real time using Model Serving route optimization for low-latency inference and Lakebase Postgres for online feature and profile lookups.
- Fast inference alone is not enough. The app pairs route-optimized Model Serving with Lakebase, plus the connection pooling, OAuth token rotation, and autoscaling patterns that keep latency stable under load.
- Across 5,000 requests, the route-optimized endpoint returned in 27 ms at p50 and 37 ms at p95 end-to-end, with 8.9 ms median Lakebase feature lookups and 100% success, well inside checkout latency budgets.
You're standing at the register. You tap your card. A tiny spinner appears for maybe half a second, maybe less, and then it says Approved. Or it doesn't.
During that time, something had to decide whether this charge looks like you, or like someone who stole your card number in a data breach six months ago. It had to know things about you: your spending patterns, your daily limit, whether you even allow purchases from other countries. And it had to do all of that fast enough that you didn't notice it happened.
This post is about what that "something" looks like when you build it on Databricks. We'll walk through retail-app, a sample application (FastAPI backend, React frontend, deployed as a Databricks App) that brings two platform capabilities together:
- Model Serving with route optimization, a faster network path to your deployed model.
- Lakebase, a managed Postgres for the profile and feature data the model needs at prediction time, featuring autoscaling so the database scales with demand instead of becoming the new bottleneck.
The flow: what actually happens on a transaction
Before we look at code, here's the plain story of a single payment. Two checks run in sequence: a model scores the charge, then the app checks your profile rules. Either one can decline the transaction.
The model runs first because we want its latency numbers regardless of the outcome. Then the profile lookup (daily spending cap, international transaction toggle, country of residence) feeds a handful of if-statements. The response includes timing for every step so you can see exactly where the milliseconds went.
Updating your profile (changing your daily limit, toggling international transactions) is a separate action. You save changes to the database, and the next payment picks them up. No redeployment, no cache invalidation.
Route optimization: why the network path matters
When a model is deployed behind Databricks Model Serving, there's a network hop between your application and the inference container. For batch workloads, a few extra milliseconds per request is irrelevant. For a checkout experience, it's everything.
Route optimization shortens that network path. When you enable route optimization on an endpoint, Databricks Model Serving improves the network path for inference requests, resulting in faster, more direct communication between your client and the model. This optimized routing unlocks higher queries per second (QPS) compared to non-optimized endpoints and provides more stable and lower latencies for your applications.
You enable it when you create the endpoint, and you query through the data-plane flow using OAuth, not personal access tokens. You get lower latency and higher throughput for the same compute, which is exactly what an interactive fraud-scoring use case needs.
In the sample app, the endpoint is called fraud-detection-lakebase.
A few things to notice:
serving_endpoints_data_plane.query: This is the data-plane query path, which is what route optimization uses. The Databricks SDK handles the OAuth token exchange under the hood.asyncio.to_thread: The SDK's query method is synchronous. Wrapping it into_threadkeeps the FastAPI event loop free while the model runs.dataframe_records: The payload is a list of dictionaries (one per row). For fraud scoring, we send one transaction at a time.
The model itself returns fraud_probability, fraud_flag, and (crucially) its own internal timing: lookup_ms (how long the feature lookup inside the model container took), inference_ms (CatBoost prediction), and total_ms. The backend maps these through so the frontend can show a latency waterfall.
Lakebase: Postgres for the data the model needs
The fraud model doesn't just look at the transaction in isolation. It looks up the customer's historical features (average transaction amount, cross-border ratio, chargeback rate, velocity over the past 24 hours) using the first six digits of the credit card (the BIN) as the lookup key. Those features live in a Lakebase Postgres table called customer_features.
This is the same table the backend reads from for profile data (name, daily limit, international toggle). One table, two readers: the model container reads features for inference, the FastAPI app reads profile fields for business rules.
On the read side, the backend borrows a connection from the pool, runs a parameterized SELECT by user_id, and returns the connection in a finally block. On the write side, when a user changes their daily limit or toggles international transactions in the UI, the backend builds a dynamic UPDATE from an allowlist of editable columns.
Connection pooling and OAuth token rotation
Every transaction in this app hits Lakebase at least twice: once inside the model container for the feature lookup, and once in the backend for the profile check. Opening a fresh connection each time means a TCP handshake plus a TLS negotiation on every single request, which would easily add 20-50 ms of overhead per call. A connection pool keeps a handful of connections open and ready, so most requests just grab one and go.
The pool itself is a psycopg2.pool.ThreadedConnectionPool with 3–10 connections. Because Lakebase authenticates via OAuth, the app exchanges service principal credentials for an access token, then uses the client ID as the Postgres username and the token as the password.
The model's side: feature lookup inside the container
The fraud model itself (deployed as an MLflow pyfunc) does its own Lakebase lookup at prediction time. It extracts the card BIN, queries customer_features, assembles a feature vector, and runs CatBoost inference.
The model container maintains its own ThreadedConnectionPool to Lakebase, with background token refresh so the pool stays valid across long-running serving instances. This is the same pattern as the backend (pool + OAuth rotation), but running inside the model container rather than the FastAPI process.
Business rules: the profile check
After the model scores the transaction, the backend reads the customer's profile from Lakebase and runs two simple rules. First, it compares the transaction amount against the user's daily spending limit. Second, if the user has disabled international transactions, the backend checks whether the transaction's country matches the user's country of residence.
Lakebase autoscaling with scale-to-zero: handling demand
In production, your Postgres instance needs to handle both the model container's feature lookups and the backend's profile reads. Lakebase autoscales, adjusting compute within a configured min/max range so you're not paying for peak capacity at 3 AM, but you're also not dropping queries at noon. With scale-to-zero enabled, you also stop paying when no transactions are flowing.
Putting it together: end-to-end latency breakdown
| Measurement | What it captures |
|---|---|
| model_call_ms | Wall-clock time for the entire serving call |
| model_lookup_ms | Feature lookup inside the model container |
| model_interfere_ms | CatBoost prediction time |
| model_total_ms | Total time inside the model container |
| business_logic_ms | Profile read + rule evaluation |
| backend_total_ms | Wall-clock time from request start through fraud model call |
Results: How fast is it really?
| Metric | p50 | p95 |
|---|---|---|
| Feature lookup | 8.9 ms | 13.9 ms |
| Inference | 0.4 ms | 6.0 ms |
| Total model time | 9.5 ms | 17.6 ms |
| End-to-end round trip | 27.2 ms | 37.3 ms |
- End-to-end round trip is 27 ms at the median, 37 ms at p95. That's the full journey: caller → route-optimized data plane → model container → Lakebase lookup → CatBoost inference → response. Well within the latency budget for a checkout flow.
- Feature lookup is single-digit milliseconds at p50 (8.9 ms). The model's connection pool to Lakebase keeps connections warm, so most reads skip the TLS handshake entirely.
- Inference is essentially free. CatBoost prediction on a 12-feature vector takes 0.4 ms at the median.
- Network overhead is ~17 ms. Route optimization keeps this consistent: the p50-to-p95 spread is only 4 ms.
Try it yourself: deploy the app to your workspace
The app is built as a Databricks App (FastAPI backend, React frontend) using apx.
The key files:
src/retail_app/backend/router.py: Transaction endpoint, fraud check, business rulessrc/retail_app/backend/postgres.py: Lakebase connection pool, profile CRUDmodel_training/fraud_model.py: MLflow pyfunc with feature lookup and CatBoostapp.yml: Deployment config
AWS Lambda announces self-managed code storage
AWS Lambda now allows functions to reference deployment packages directly from your own S3 buckets, eliminating copy-based storage limits.
Original article
AWS Lambda announces self-managed code storage
AWS Lambda now supports self-managed Amazon S3 buckets for code storage, enabling you to reference source code directly from your own S3 buckets without Lambda creating intermediate copies. This eliminates code storage limits and reduces function activation time after function creates and updates by removing the copy step.
AWS Lambda is a serverless compute service that runs your code without requiring you to manage servers. Customers who deploy many functions and additional code as Lambda layers often need more than 75GB of code storage per Region, requiring support tickets to increase this quota. Previously, Lambda always copied your deployment package to Lambda-managed storage during function and layer creation, counting against this limit. Now, with self-managed code storage, Lambda references your code directly in your Amazon S3 bucket without creating a copy, so you can store as much function and layer code as your bucket allows. You maintain a single source of truth for your deployment packages in your own account. No additional Lambda charges apply for self-managed storage; you only pay for standard Amazon S3 storage and, where applicable, cross-Region data transfer rates. In addition, Lambda has increased the default limit for Lambda-managed code storage from 75GB to 300GB per Region per account.
Self-managed Amazon S3 code storage is available in all commercial AWS Regions.
To get started, set the S3ObjectStorageMode parameter to REFERENCE when creating or updating functions and layers through the AWS CLI, AWS CloudFormation, AWS SAM, or AWS SDKs. You must grant the Lambda service principal s3:GetObject and s3:GetObjectVersion permissions on your S3 bucket. You can also update a function to use self-managed code storage via the Lambda Console. To learn more, visit the AWS Lambda Developer Guide.

Bring Code-backed Screens Onto the Canvas with Variables Attached
Figma now maps code-backed screens to design variables automatically, reducing manual cleanup when importing live web pages or code components.
Deep dive
- Automatically binds colors, typography, and spacing to existing file variables.
- Supports imports from Figma Make, the Figma MCP server, and live web capture.
- Improves auto layout heuristics to prevent manual rebuilding.
- Simplifies the workflow for importing legacy screens or live websites into design files.
Decoder
- MCP (Model Context Protocol): An open standard for connecting AI models to external data sources and developer tools.
- Auto Layout: A system in Figma that allows elements to resize and reflow based on content, mimicking CSS Flexbox or Grid.
Original article
Bring code-backed screens onto the canvas with variables attached
When you bring code-backed screens onto the Figma canvas, colors, type, and spacing now bind to most of the variables already in your file instead of landing as hardcoded values. You'll see this when you:
- Copy a Make preview onto the canvas as design layers
- Generate a design from code through the Figma MCP server
- Capture your live web page as editable layers with the Chrome extension
More frames also come in with auto layout, so edits resize and reflow instead of needing manual cleanup. Together, this means you can bring coded or legacy screens back into Figma and spend your time refining the work, not rebuilding it.

Google Vids Now Lets You Star in Your Own AI Videos
Google Vids is pivoting from a presentation tool to a video generation platform by adding Gemini Omni-powered AI avatars and interactive editing.
Deep dive
- Enables creation of personalized AI avatars using selfie and voice input.
- Integrates Gemini Omni for text-to-video, image-to-video, and lighting/background fixes.
- Implements invisible SynthID watermarking for all AI-generated content.
- Requires users to be 18+ and in specific regions to access avatar features.
Decoder
- Gemini Omni: A multi-modal model capable of processing and generating text, audio, images, and video simultaneously.
- SynthID: Google's digital watermarking technology embedded directly into AI-generated media for identification.
Original article
OpenAI’s Sora may have shut down, but Google apparently thinks there’s still interest in a tool that lets you star in your own AI videos. On Thursday, the tech giant announced an update to Google Vids that will allow you to create a custom digital avatar that looks and sounds like you based on a selfie and a voice recording you upload.
In addition, Google said it’s bringing its multi-modal AI model Gemini Omni to Vids, letting you create videos using a combination of a written prompt and reference images you upload. Omni then mixes those inputs together to create the AI video you want. It can also be used to do things like swap out the background or fix the lighting in a video recorded on your phone, or add effects.
Plus, Omni now supports step-by-step edits, meaning you can make changes to your video as you go instead of starting over from scratch.
The updates push Google Vids beyond its original role as an AI-assisted workplace presentation tool to become more of an all-in-one video creation platform. By making Vids a part of Google Workspace, the company is telegraphing its use as a business tool for things like company updates or training videos, but personalized avatars and conversational edits could put it in closer competition with other AI video startups and tools like HeyGen, Synthesia, Captions, D-ID, and others.
Google notes that the new AI avatars will be tied to the account holder’s likeness, tied to their Google account, and watermarked invisibly with SynthID. (I suppose that means no one will be using the tool to make bizarre AI videos of Google CEO Sundar Pichai, the way that OpenAI CEO Sam Altman had let users do with Sora when it was available!)
The company also says that access to personal avatars is limited to users in certain regions who are aged 18 or older.

Why is AI Bad at Design?
AI struggles with design because aesthetic quality lacks a clear 'pass/fail' metric, leading models to favor generic, average outcomes.
Deep dive
- Explains the 'design vs. code' verification gap: code tests are deterministic; design is subjective.
- Describes the 'regression to the mean' problem where models favor average, safe outcomes to satisfy training preferences.
- Notes the lack of high-quality design training data compared to the abundance of code on platforms like GitHub.
- Discusses the 'blind design' limitation where models output code coordinates without visual feedback.
- Suggests that vision-based feedback loops are necessary but insufficient for artistic judgment.
Decoder
- Cargo culting: Imitating the outward form of a process (like design) without understanding the underlying principles that make it function.
Original article
If there’s anything that AI is particularly good at, it’s writing code. The whole software engineering profession has been turned upside down as more and more code is written by agents, with humans supervising and reviewing. If LLMs have product-market fit in anything, it’s software engineering.
Yet if you’ve tried AI design tools like Figma Make, Claude Design and so on, you might be disappointed. No matter how much context you give it, AI tends to produce design work that looks plausible, but is very generic and on further inspection full of (obvious to us humans) flaws.
Having used AI design tools on a few projects recently, it left me wondering, “is it me or is AI just bad at design?”
Turns out that, no, it’s not just me. There are some fundamental technical reasons why AI is nowhere near as good at designing as it is at coding.
What you mean by ‘bad’?
If you haven’t tried these tools in anger, here’s one example from my iOS app, Pegs Out.
I recently added the ability to see why a particular day is good or bad for drying your laundry outside, based on the underlying weather conditions. It tells the story of the day in a style similar to a data journalism article from the FT, Economist, etc.
This is what Claude originally designed:
I’m sure you can see some issues...
- Charts don’t have titles so you don’t know what they’re showing you.
- There are no y-axis labels.
- What do the yellow shaded areas mean?
- What is the blue dotted line for?
- The headers “Air” and “Energy” are too abstract to understand.
- The data visualisation is flat and has no depth to it.
After a few rounds of iteration and feedback, we eventually arrived at the final design which you can try out in the app yourself:
Hopefully you’ll agree that this is not just clearer, but more visually appealing and inline with the rest of the app’s design.
You might argue that this is subjective, but that is exactly the point...
The root cause: code can be verified, but design can’t
The leap in AI coding ability over the last couple of years came from a specific training method: letting a model attempt a task many times and using an automatic grader to score every attempt. For code, that grader already exists. Does it compile? Do the tests pass? The answer is an unambiguous yes or no. It’s the same reason AI has become so good at games like chess and Go: in each case there’s a definitive right answer to train against.
Design has no equivalent correct answer. There’s no automatic test you can run for whether an interface feels trustworthy, expresses a brand or is beautiful. Design quality is subjective, dependent on context and culture, and often only knowable after real people have used the thing. You can’t compile it and see if it passes.
When you can’t grade something automatically, the fallback is to have humans rate outputs instead. For design, that’s slow, expensive and unreliable. The model "is not learning what is objectively correct; it is learning what people tend to prefer" and this varies enormously by context. Almost everything else that makes AI weak at design follows from this single problem.
Average is fine for code but not always what you want for design
LLMs work by predicting the most probable next thing. Left to their own devices, they gravitate towards the middle of everything they’ve seen. The training used to make them helpful and safe narrows this further, because human annotators tend to prefer outputs that look familiar. The result is a strong pull towards the average.
For code, landing in the safe, conventional middle with a boring-but-correct solution is usually fine. Sometimes average is acceptable for design as well. If you’re creating a payment screen in a banking app using an established design system, something that is average might be a good first draft. Here an expected pattern might be the right solution because being following conventions makes it easier to use.
The trouble comes when we want to design anything that is unique, creative or distinctive. For things like visual design, brand expression, or anything that’s meant to set a product apart, the average is not what we want. This is where AI’s pull towards the mean reduces its value to design the most.
There’s less design to learn from, and it’s harder to learn
As you probably know, LLMs are trained by feeding them enormous amounts of data. Code is one type of data that is both abundant and easy to learn from. GitHub, Stack Overflow and decades of open source mean there’s a huge amount of text-based, machine-readable training data. The largest open-source dataset of code (The Stack v2) contains 67.5TB of raw data covering over 600 programming languages across 3 billion files.
There is no such equivalent for data on design. The largest public dataset of real interface designs (Rico) only has 72,000 Android UI screens from 9,700 Android apps. Most high-quality design work is locked inside proprietary Figma and Sketch files that are inaccessible for training.
The scarcity of training data isn’t even the main problem though. The bigger issue is that design doesn’t translate well when being turned into training data. A good interface works because of things that are hard to capture in a screenshot: hierarchy, spacing, rhythm, the reasoning behind why one element sits above another. The model can see what an interface looks like but doesn’t know why it works. This is why AI tools feel like they are cargo culting design: they’re making stuff that looks plausible but there is no thinking behind it.
It’s designing blind
There’s another reason that AI-generated design work is often poor: when one of these tools generates a design, it usually can’t see what it’s making.
When you ask ChatGPT or Midjourney to generate an image, those models paint in a visual space and are always working with a version of the picture itself. They can ‘see’ what they produce.
But when we ask AI for an interface, it’s writing code, placing elements by their coordinates without ever seeing the end result. It’s effectively drawing with its eyes closed.
This is why AI is particularly bad at generating SVGs (vector graphics). You’re asking it to create precise geometry, exact coordinates and curve points, with no way to see the shape it’s describing, so the output is frequently distorted or wrong. Try asking AI to convert a PNG to an SVG and you’ll see what I mean:
Newer tools and workflows are starting to close this gap. They render the output, take a screenshot and feed it back so the model can look at what it produced and revise. This helps, but there are still two problems with it:
- The model’s vision is not very precise: it can’t see pixel-level differences. It’s like it’s short-sighted and isn’t wearing glasses.
- The thing doing the looking is the same model with the same missing sense of visual taste. So the loop catches obvious errors while still being unable to judge whether the result is any good.
Will this change or is there a fundamental limit?
Some of these limits will disappear as the models improve. The “it’s designing blind” problem will reduce as computer vision gets better and AI can check its work more easily.
But most of the reasons are structural. You cannot build an automatic grader for aesthetic taste, creativity, novelty, etc. because there is no correct answer to grade against. AI will improve but it’s always going to be limited in terms of what it can design for you. It will be fast and competent, but generic. Humans will always be needed to provide the differentiation, judgement and originality that make design actually good.
Understand its limits so you can understand how to get the best out of it
Of course, AI is bad at design is a generalisation in the same way as saying that AI is bad at anything. Just because it has limitations doesn’t mean we can’t use it to improve our design process.
The practical takeaway is this: don’t ask AI to do the design, get it to help you do parts of design. The key to using AI in any task is working out which steps should be done by humans and which by AI.
If you hand over the whole design process, you’re going to be disappointed for all of the reasons outlined above. Instead, if you understand AI’s limits, you can identify which parts it can genuinely help you with.

Does Your Form Really Need a Dropdown List?
Dropdown lists are frequently misused for small or large data sets where radio buttons or comboboxes offer better usability.
Deep dive
- Dropdowns hide options by default, which creates a 'low discoverability' problem for users.
- High interaction cost: dropdowns require a click to open, scroll/scan, and a second click to select, which is error-prone on mobile.
- Dropdowns often fail because user mental models for categories (like job titles or industries) often conflict with rigid backend taxonomies.
- Radio buttons are superior for 2-6 options because they keep all choices visible, reducing the need for exploration.
- Comboboxes (filterable inputs) should replace long, scroll-heavy dropdowns for lists exceeding 15 entries.
- Dropdowns remain effective only for secondary tasks where screen space is extremely limited or where input must be strictly constrained to a narrow set of values.
Decoder
- Progressive Disclosure: A design pattern that reveals information or options only when needed to keep the UI clean.
- Combobox: An input control combining a text box and a list box, allowing users to filter options by typing.
- Information scent: The cues that lead a user to believe that a specific interaction path will help them achieve their goal.
Original article
Does Your Form Really Need a Dropdown List?
Dropdown lists are one of the most familiar controls in forms. Designers use them because they're compact, flexible, and easy to implement. But that convenience comes at a cost: dropdowns hide available options behind a click, adding friction to every selection and slowing decision making.
Definition
A dropdown list (also called a select menu) is a collapsible input control that reveals a list of options when clicked, allowing users to select one option from that list.
“Dropdown” is a commonly used term in interfaces, but it can refer to different patterns depending on context. This article focuses specifically on dropdown lists used as input controls to collect data, not on navigation or command menus that trigger page changes or, respectively, system actions. While these components share a similar visual pattern, they serve different user goals.
The Appeal of Dropdown Lists
Dropdown lists owe their popularity to a few advantages:
- Space efficiency: Dropdown lists are compact, capable of holding any number of options while occupying a single line on screen. When you have more options than space allows, collapsing them behind a click can feel like a tidy solution.
- Input constraint: Users can only choose from predefined, valid options; no typos or invalid entries. This helps keep the data structured and clean.
- Familiarity: Dropdown lists are a standard input pattern that has existed for decades. The signifier is strong — users recognize the down-arrow pattern across platforms.
The Hidden Costs of Dropdown Lists
While dropdown lists appeal to the designer’s need for visual cleanliness, they often don’t make it easier for users to input data.
Low Discoverability
Hiding options by default is a form of progressive disclosure. On one hand, it’s an elegant solution that mitigates visual complexity; but on the other, it undermines the discoverability of hidden options or the input altogether.
In a long form, a compact dropdown list is easy to overlook or mistake for a completed field. Because of this, the selected default becomes a critical choice. Users may not interact with the control to explore additional options beyond the default.
High Interaction Cost
Interacting with a dropdown involves three steps:
- Open the list (via click, tap, or keyboard)
- Scroll to the desired option
- Click again to select it
In custom dropdowns (that is, those not using the browser or OS's default), accidentally clicking outside the dropdown while scrolling the list often closes the list, forcing users to restart the selection process.
Long dropdown lists, which are commonly used to hide visual clutter, are especially problematic. Users must scroll carefully through the options while maintaining enough precision to select the right one — a task that becomes error-prone on both desktop (where scroll speed can overshoot) and mobile (where fat-finger problems and accidental dismissals are common).
Accessibility Barriers
GOV.UK has done extensive research on dropdowns and documented persistent usability issues for keyboard and motor-impaired users, including:
- Struggling to close the dropdown
- Attempting to type into it
- Confusing focused items with selected items
- Failing to realize they can scroll for more options
- Trying to pinch and zoom options on small screens
Illusion of Clean Data
Dropdown lists are often favored over text inputs because they constrain input and keep the data sanitized, allowing backend systems to receive standardized, machine-readable values. But constraining input works only when the option set aligns with users’ mental models. When it doesn't, the dropdown amplifies the mismatch in two distinct ways.
There Are Multiple Ways to Present the Same Answer
When all options are hidden until opened, users can't scan ahead to figure out which naming convention the list follows.
What Users Look For is Absent from the List
Forms often miss edge cases or fail to account for all possible options. For each option presented, the dropdown enforces a single canonical label, while users arrive with rich, context-specific mental models shaped by culture, daily language, politics, or personal identity.
When the option they expect is absent from the list, users are forced to:
- Exhaustively review the entire list
- Settle on the closest (but likely inaccurate or wrong) option
- Give up and leave the field blank
When to Avoid Dropdown Lists
Too Few Options
When a menu contains only a handful of choices, collapsing them behind a click adds unnecessary interaction cost. Users must open the control just to discover all the options. Worse, the collapsed state offers almost no information scent — there's nothing to signal what's inside or help users predict their options before committing to an action.
Radio buttons are a stronger alternative here. They are universally understood, expose all choices immediately, and require only a single click to select an option.
Too Many Options
Long dropdowns are equally problematic. When a list exceeds roughly 15 options, such as a country list, the interaction cost of visually scanning it and the fine-motor control required to scroll through it can be overwhelming.
In these scenarios, a combobox — a text field paired with a filterable dropdown list — helps alleviate the burden of searching through a long list.
Highly Familiar or Predictable Data
For readily known values — ages, birthdates, heights — typing is often faster than selecting from a dropdown. Forcing users to scroll through a long list to find a value they could type in seconds is an unnecessary burden.
Users Need to Make a Visual Comparison
When users need to pick a product variant (e.g., size, color, or material), a selection control is clearly warranted. However, dropdown lists should be avoided in this case as they block and delay selection by hiding available options behind an extra tap.
When Dropdowns Still Make Sense
Despite their drawbacks, dropdowns aren’t universally wrong. They remain appropriate in a narrow set of contexts. Before deciding whether to use a dropdown, first determine whether selection is the right interaction pattern at all.
A Moderate Number of Options (Roughly 5–10)
Dropdown lists work best in a narrow middle range: enough options to justify hiding them for space, but not so many that the list becomes hard to navigate.
The Field Is Secondary to the Main Task
When a field is secondary to the user's primary goal or its use is optional, its choices don't need to be visible by default. A dropdown allows those options to remain hidden until they become relevant, preserving users' attention and screen space for the primary task.
The Field Is Part of a Whole
A field doesn't always stand on its own. Sometimes users interpret multiple fields as a single unit or review them altogether. In these cases, preserving the overall layout is more important than making every option immediately visible.
Conclusion
So, does your form really need a dropdown list? Probably not as often as you might think. Before reaching for one, ask: how many options are there, do users need to see them all to choose confidently, and does the layout genuinely benefit from hiding them?
Often, the answer will point you away from a dropdown — toward radio buttons, text input, comboboxes, or a different form element altogether. Treat dropdown lists as a tradeoff, not a default. Use them deliberately, and only when their costs are clearly justified.
3D artists are So Blown Away by Blender's Latest Update, it's Hard to Believe it's Free Software
Blender 5.2 LTS introduces a Geometry Nodes-based physics system that marks a shift toward procedural, high-performance simulation.
Deep dive
- Introduces a Geometry Nodes-based physics system using an Extended Position-Based Dynamics (XPBD) solver.
- The new texture-caching system in Cycles can reduce GPU VRAM consumption by up to 80% for high-resolution assets.
- Direct Compositing in the Video Sequencer allows for color grading and effect application without switching workspaces.
- New 'Thin Wall' mode in the Principled BSDF shader simplifies rendering of paper, leaves, and glass.
- Screen Space Raytracing in EEVEE has been refined for faster global illumination performance.
Decoder
- Geometry Nodes: A procedural node-based system in Blender for creating and manipulating geometry without destructive editing.
- XPBD: Extended Position-Based Dynamics, a numerical method used in computer graphics to simulate physical materials like cloth, hair, and soft bodies.
- Principled BSDF: A complex, all-in-one shader node in Blender that simulates various material properties based on physical principles.
- Cycles: Blender’s primary path-tracing render engine.
Original article
Blender 5.2 LTS has received its full release, and it adds a host of new features that make it make it even clearer that this is the best free 3D app and the best free animation software for both 2D and 3D work all wrapped up in one open-source package.
An LTS release is usually about bug fixes and security patches, but this feels like a major release. Coming just after the announcement of plans for a feature-length Blender movie, it adds new Geometry Nodes for physics, a Thin Wall mode in Principled BSDF and a time-saving Texture Cache system in the Cycles render engine.
Perhaps the most exciting Blender update is the introduction of a Geometry Nodes-based physics system for cloth and hair simulations. Powered by an XPBD (Extended Position-Based Dynamics) multiphysics solver, it means simulations can live directly inside node trees, so no more need to rely on legacy physics modifiers.
It marks Blender's first real step towards a unified, procedural simulation workflow reminiscent of Houdini, and it appears to be impressively fast. General artists now have the best of both worlds: a clean, traditional modifier panel with a few simple sliders on the outside, plus a highly customisable, cutting-edge node tree on the inside
Advanced self-collision and ready-made forces (like wind or turbulence) are still being fleshed out, but this looks like a substantial shift in how Blender will handle physics in the future.
💥Blender 5.2 Cloth Dynamics Node | Custom Forces & Extra Nodes Workflow - Demo 😃🙏(Links in Comments)#b3d #Blender #geometrynodes #motiongraphics pic.twitter.com/biGvMvAvDb
Another major update is the introduction of Remotely Hosted Asset Libraries, potentially reducing the burden on artists' hard drives when it comes to storing models and materials. Studios can host their own online repositories, and individual artists can browse and download cloud-hosted assets directly inside Blender's Asset Browser.
Meanwhile, rendering heavy scenes gets more efficient with Cycles' new texture-caching system that can dynamically generate optimised .tx files. Blender says the system can cut GPU memory (VRAM) usage by up to 80% for scenes with large high-resolution image textures, saving scenes that might have previously crashed due to "out of memory" errors.
Elsewhere, Direct Compositing in the Video Sequencer bridges the barrier between the Video Sequence Editor (VSE) and the Compositor. You can apply Compositor node trees as direct effects strips in your VSE timeline, eliminating the need to constantly switch back and forth between the workspaces.
Users are excited to see compositing with interactive framerates open up basic video colourgrading workflows like Fusion and Resolve.
Testing the GPU simulation plugin in Blender 5.2.The video shows geometry node hair with 50,000 strands and 670,000 vertices, totaling 390 frames. The exported ABC file size reached 3.9GB.#b3d #blender pic.twitter.com/kylU7X8ja7
Just look at the new Compositing in Blender 5.2. This is cool. Now the compositor can play sequence animation in real-time right in the compositor, and look at this, I'm doing color grading while the animation is playing. On top of that, the overall performance of the… pic.twitter.com/Un0OcUiapx
The built in Essential asset library in Blender 5.2 is super cool! pic.twitter.com/lkiGbbQ7mO
Alguien me explica qué tipo de magia negra han hecho con el nuevo simulador de telas de Blender 5.2? pic.twitter.com/R6kx9W0mNZ
On the more iterative side, Screen Space Raytracing has been refined in EEVEE, and Fast Global Illumination is now faster and cleaner.
There's a new fill algorithm for 2D artists called Grease Pencil Delaunay Solver, which automatically detects gaps and remains accurate regardless of zoom level.
Another seemingly small change with a lot of potential is the new Thin Wall mode in the Principled BSDF shader. This makes it easier to accurately render thin materials like paper, leaves, or hollow glass without complex refraction setups. Enabling it treats the surface the shader's applied to as a thin sheet, making it easier to recreate materials as varied as leaves, paper, glass and soap bubbles.
All in all, it looks like an impressive release that's only going to cement Blender's growing use for professional productions. If you need a system that keep up, see our guide to the best laptops for 3D modelling.
Accelerating Apache Spark Queries (and Iceberg Rust Development) with Apache DataFusion Comet
DataFusion Comet boosts Apache Spark performance on Iceberg by offloading execution to Rust-based native engines while retaining Java-based query planning.
Deep dive
- Comet acts as an optimizer rule within Spark to replace JVM execution with DataFusion/Rust code.
- It leverages Iceberg Java for metadata and FileScanTask planning.
- DataFusion handles columnar Arrow data for faster processing.
- The system uses Iceberg Java's 10,000+ test suite as a differential-testing harness.
- Comet currently falls back to Java for table format version 3 or unsupported operations.
- Over 40 pull requests have been contributed back to Iceberg Rust through this testing workflow.
- It currently only accelerates table reads, not writes.
Decoder
- Differential testing: A software testing technique where the same input is provided to two or more implementations of the same system to check for discrepancies in output.
- Physical plan: The final sequence of low-level operations (e.g., joins, scans) that a query engine executes to retrieve data.
- Table format version 3: A specific iteration of the Apache Iceberg storage specification that adds features like deletion vectors for row-level modifications.
Original article
Accelerating Apache Spark Queries (and Iceberg Rust Development) with Apache DataFusion Comet
Apache Iceberg's ecosystem spans multiple query engines and language implementations that work together to give users a consistent experience across the data lakehouse. This post explores one integration within that ecosystem, Iceberg Rust and Apache DataFusion Comet, and the two benefits their relationship brings. Comet accelerates Apache Spark's reads over Iceberg tables by running them natively through Iceberg Rust. That same integration turns Iceberg Java's nearly 10,000 Spark tests into a differential-testing harness whose benefits run both ways: Iceberg Rust gets exercised against a broad corpus of real-world scenarios, and the comparison has even caught bugs in Iceberg Java. The resulting fixes land upstream and benefit every project built on these libraries, not just Comet, as the Iceberg and DataFusion communities build on each other's strengths.
Background
Apache Iceberg provides a universal table format that serves as a foundation for modern data lakehouse platforms. With Iceberg, users store their tables with the benefit of being able to access and modify their data from a number of different query engines. The Iceberg Java repository, the de facto reference implementation of the Iceberg specification, ships a mature Apache Spark integration. Beyond querying their data, teams also use Spark for table maintenance like compaction and snapshot expiration. In addition to Java, the Iceberg community maintains a number of other Iceberg implementations like C++, Go, Python, and Iceberg Rust. These other implementations benefit not only from the Iceberg specification, but also the lessons learned and design decisions of the Java project's community. The Java repository's extensive test suites, for instance, include nearly 10,000 correctness tests driven by Spark (as of Iceberg 1.11 with Spark 4.1). Each implementation maintains its own test suite and can look to Iceberg Java as a reference for both correct behavior and test coverage. None of them, however, can run Java's tests directly against their own code.
While Spark remains widely used for working with Iceberg, a number of projects exist to accelerate its JVM-backed execution. One such solution is Comet, which Apple donated in 2024 as a subproject of the Apache DataFusion query engine. Comet's native execution engine aims to run CPU-bound jobs faster and IO-bound jobs with fewer resources. As we will see, it does more than speed up queries: the same design that makes it fast also makes it a tool for accelerating Iceberg Rust's development.
Accelerating Spark Queries with Comet
Comet builds upon several related Apache projects including DataFusion (for its efficient operator implementations like joins and aggregations), Arrow-rs (for its standardized in-memory format and robust Parquet reader), and both the Java and Rust implementations of Iceberg. To accelerate Spark queries, Comet intercepts execution at the physical plan level. After Spark has parsed, planned, and optimized a user's query, Comet's JVM code runs as one final optimizer rule to convert Spark plan nodes to Comet plan nodes. These Comet plan nodes have a superpower: they execute in DataFusion's Rust engine over columnar Arrow data.
So how does Comet use both Iceberg libraries to accelerate Spark queries over Iceberg tables? As previously mentioned, Iceberg provides robust integrations with Spark, enabling users to query their Iceberg tables regardless of the Spark API they are using (e.g., SQL, Scala, or PySpark). Iceberg relies on Spark's Data Source v2 API to integrate with query planning. The short version of the process is that given a query reading an Iceberg table, the Java library inspects table metadata (e.g., version history, schema, statistics, file layout) to construct FileScanTask objects. These objects describe the low-level operations (e.g., file paths and byte ranges) needed to read the table and feed data to downstream query operators.
Comet still relies on Iceberg Java for this planning. Acceleration is possible because Iceberg Rust has its own FileScanTask, so Comet uses it as the common abstraction between the two libraries: it takes the FileScanTask objects that Iceberg Java produced and hands them to Iceberg Rust, which reads the described files into the in-memory Arrow batches that feed the rest of the plan.
To measure Comet's impact on real workloads, the AWS Data on EKS team benchmarked Comet against Spark alone on the TPC-DS 3 TB workload over Iceberg tables. Comet completed the suite roughly 40% faster (2,803.80s versus 4,665.47s) and accelerated 102 of the 103 TPC-DS queries, with only a single query regressing.
Raw speed only matters if the answers are correct. Comet prioritizes correctness and compatibility with the libraries it accelerates. In addition to its own exhaustive test suites, Comet goes further by running Iceberg Java's Spark test suites with Comet enabled as regression tests, continuously checking the native path against the same corpus that guards the reference implementation.
Comet uses Iceberg Rust to accelerate reads but does not yet accelerate writes, which still go through Iceberg Java. Even among table reads, it does not accelerate all of them. For example, Comet currently falls back to Iceberg Java any time it encounters a table using table format version 3 or newer. This fallback behavior can be due to gaps in Comet or gaps in the underlying Iceberg Rust library. A consequence is that when Comet runs Iceberg Java's Spark suites, many tests silently take the Iceberg Java path rather than exercising Comet's native execution, so not every passing test reflects an accelerated read. That same graceful fallback, however, is also what makes these suites useful for improving Iceberg Rust itself.
Accelerating Iceberg Rust Development with Comet
While the specification remains the reference for Iceberg developers, the lessons learned and edge cases encountered by the Java implementation provide an excellent corpus for other implementers. Historically, a non-Java implementation could only study that corpus and reimplement equivalent tests by hand. Comet changes that: it lets Iceberg Rust execute directly against Iceberg Java's Spark test suites. To our knowledge, no other Iceberg implementation (e.g., C++ or Go) has any comparable way to test itself against the Java corpus.
Comet accelerates queries by keeping Iceberg Java's planning and swapping in native execution. Accelerating development reuses that same split. Iceberg Java and Spark handle planning and produce a trusted result, so they serve as an oracle. Comet and Iceberg Rust handle native execution, so they become the system under test. Running them side by side is a form of differential testing: a query that Comet executes natively should return exactly what Spark returns on its own, and any difference points to a gap in Iceberg Rust or in Comet's translation between the two libraries.
Comet's fallback behavior is what makes this practical. By default, Comet falls back to Iceberg Java whenever it encounters a feature that Iceberg Rust cannot yet handle. Relaxing a fallback forces the native path and exposes exactly where it breaks, which turns the process into ordinary test-driven development against Iceberg Java's suite of nearly 10,000 Spark tests. A developer relaxes a fallback, runs the tests that exercise the feature, inspects what the Java planner produces, implements whatever Iceberg Rust is missing to match it, wires up any new plan-conversion logic Comet needs, and re-runs the suite to confirm the native path now passes.
The first iterations are noisy. Early on, a single test run could produce hundreds of failures buried in enormous logs. To make that tractable, contributors have leaned on AI assistants to digest the volume of test output and characterize the failures by root cause, so they can tackle whichever gap accounts for the most. The humans still reason about the underlying code themselves; the AI just turns a wall of red into a prioritized backlog.
This model is already producing results, with Comet contributors submitting over 40 pull requests to Iceberg Rust spanning bug fixes, new features, and performance optimizations. For example, Comet has recently begun adding preliminary support for table format version 3, reading deletion vectors against an in-progress Iceberg Rust branch. Contributors are now peeling those fixes off into standalone Iceberg Rust contributions. Similarly, adding Iceberg 1.11 support to Comet surfaced two bugs in Iceberg Rust that Comet contributors quickly fixed. Future contributions could follow the same model to close the rest of the table format version 3 gap in Iceberg Rust: new data types (variant, geometry, and geography), row lineage, default column values, and table encryption. The write path is an opportunity too, since the same approach could bootstrap native write support next.
Crucially, none of these contributions are Comet-specific. They land upstream in Iceberg Rust and close feature gaps with Iceberg Java, so every system built on the library benefits, not just Comet. For the developers building Iceberg Rust, the payoff is direct: instead of mirroring Iceberg Java's tests by hand, they get a stream of real, production-hardened behaviors to implement and verify against, so the library matures faster and ships with more confidence. Comet is simply the workload that surfaces the gaps; the fixes belong to the whole community.
The comparison cuts both ways. Iceberg Java is usually the oracle, but sometimes Iceberg Rust's behavior is the reference for the correct result. For example, Comet helped validate the fix for a bug in Iceberg Java's manifest delete file size after a rewrite table action, confirming the corrected behavior against Iceberg Rust.
This workflow is becoming part of how both projects test. When a Comet contributor fixes a bug or adds a feature on an Iceberg Rust branch, they typically open a Comet draft pull request that points at that branch and demonstrates previously failing Iceberg Java tests passing end to end. The same setup also serves as an informal way to validate Iceberg Rust release candidates. Comet is not a formal CI check for Iceberg Rust, but the Iceberg Rust community encourages developers to run their changes through Comet when validating a new feature.
On its own, an open table format is little more than data at rest. Paired with an open source query engine like DataFusion, it becomes the foundation of an open data platform. The work described here is a small but growing example of what that looks like in practice: two communities building on each other's strengths to accelerate Iceberg on both fronts. Users who query Iceberg get faster results, and the developers who build it get a faster path to shipping and validating new features. We are thrilled by the deepening collaboration between the Iceberg and DataFusion communities, and we encourage anyone interested to find a way to get involved.
Getting Involved
Both Comet and Iceberg Rust welcome contributions. Comet tracks work through GitHub issues and discussion happens through the Apache DataFusion communication channels, while Iceberg Rust uses GitHub issues and the Apache Iceberg community channels.
There are several ways to get involved:
- Give Comet a try to accelerate your Spark queries over Iceberg tables: see the Comet user guide to get started, point it at your existing workloads, and report any issues you encounter.
- Help close the gaps that cause Comet to fall back to Iceberg Java by contributing features to Iceberg Rust.
- Review the contributor guides for Comet and Iceberg Rust.
- Look for good first issues in Comet and Iceberg Rust.
For more information, visit the Comet and Iceberg Rust repositories.
From OTEL to SLMs: Distilling Frontier Model Behaviour from Production Telemetry (45 minute video)
Production telemetry can be repurposed as high-quality training labels to fine-tune small language models that achieve near-frontier performance at a fraction of the cost.
Decoder
- OpenTelemetry (OTEL): A collection of APIs, SDKs, and tools used to instrument, generate, collect, and export telemetry data (traces, metrics, and logs) to analyze software performance.
- SLM: Small Language Model; typically referring to LLMs with significantly lower parameter counts (e.g., 7B-13B) designed for efficiency and local deployment.
Original article
OpenTelemetry traces can convert production AI-agent feedback into training labels for local 7B-13B coding models. Fine-tuned within hours, they can reach roughly 80-85% of frontier-model quality while lowering inference costs, preserving privacy, and scaling across the enterprise.

Exploring Hierarchical Interest Representation For Meta Ads Deep Funnel Optimization
Meta is using a transformer-based hierarchical graph encoder to map billions of users and ad entities into a shared, latent interest space.
Deep dive
- Employs a heterogeneous, time-decayed graph connecting users, ads, and products.
- Uses LLMs to enrich entities with multimodal world knowledge.
- Implements memory-efficient 'FlexAttention' to apply graph-structural bias without full matrix materialization.
- Trains via self-supervised cross-view distillation to solve signal sparsity in the deep funnel.
- Discretizes embeddings into 'Bag-of-Meaning' (BoM) interest tokens for retrieval performance.
- Strict temporal data separation prevents future data leakage during model training.
Decoder
- Latent interest: An inferred interest or preference not explicitly stated by a user but detected through behavioral analysis.
- Deep funnel: The later stages of the customer journey where a user is close to making a purchase or conversion.
- Sinkhorn-Knopp: An algorithm used in machine learning to enforce balanced assignment during clustering, preventing the model from collapsing all outputs into a single category.
Original article
- Hierarchical Interest Representation is a research area for Meta Ads. We’re exploring an upstream representation layer over the universe of Ads entities – users, advertisers, products, services – learning unified embeddings that connect users’ inferred interests with the breadth of what advertisers offer in their deep funnel ads.
- The innovations in Hierarchical Interest Representation are an in-house transformer based graph learning with bias-aware attention and self-supervised cross-view distillation, learning multi-hierarchical interest representations across a large graph.
- Hierarchical Interest Representation blends real-world knowledge with engagement signals – multimodal advertiser and product content processed through LLMs enriches sparse interactions, enabling generalization to rare and unseen entities.
- Hierarchical Interest Representation outputs universal embeddings for ads entities and Bag-of-Meaning interest tokens that have the potential to power new personalization, retrieval, supervision, and specialized ranking architectures across the ads stack.
- Trained end-to-end on real Meta ads data at the scale of billions of interactions.
Hierarchical Interest Representation is an upstream representation layer designed to improve upon Meta’s deep funnel ranking optimization. It aims to connect businesses with the population of people on our platforms who carry the most genuine, latent interest in what they offer. The system is intended to function across Meta’s broader recommendation ecosystem, such as Meta’s Generative Ads Model (GEM), Andromeda, and the Adaptive Ranking Model, to advance deep funnel optimization.
People come to Meta’s apps and platforms to connect with people and content, expressing preference with every scroll. Engagement signals are used to understand both inferred and explicit interests and improve relevance of content across our platforms. Utilizing frontier AI to map latent interests from sparse engagement signals and aligning them with the vast landscape of advertiser offerings is a transformative approach to addressing the challenges of signal scarcity and driving up deep funnel ad performance.
The mission is to strengthen reasoning relationships throughout the landscape of ads entities – spanning users, businesses, and products – utilizing multi-hierarchical granularities that allow our models to navigate between stable, high-level interest anchors and the specialized, sparse signals of deep funnel intent.
How Hierarchical Interest Representation Enhances Deep Funnel Optimization
Hierarchical Interest Representation pioneers a structural shift in representation modeling by navigating long-range graph topologies and distilling sparse engagement signals into unified interest clusters at various granularities. By fusing real-world knowledge with a semantic grasp of advertised products, it effectively strengthens the connection between ads and user intents.
Hierarchical Interest Representation encourages discovery-oriented ad experiences by extracting stable interest anchors from massive engagement datasets and grounding them in multi-modal world knowledge enrichment. This aims to enable the delivery of more relevant ad content to optimize deep funnel ads.
The Technical Challenges
User engagement with ads entities is naturally graph-structured: users and ads entities (advertisers, products, services, campaigns etc.) are nodes, and the activities and events connecting them are edges. At Meta’s scale, this is one of the largest graph networks in the industry. Learning the interest representation bears the following challenges:
User Inferred Signal Dynamics
Meta provides users with tools to help tailor their experiences, like providing ‘Interested/Not interested’ feedback on posts they see. In addition, inferred interests based on engagement signals continue to play an important role for improving deep funnel ads.
Large Networks With Sparse Connections:
Every month, Meta’s ads network serves millions of ads, from millions of advertisers, to billions of people across our platforms. While this “vocabulary” is large, ad impression opportunities are limited and deep funnel user feedback is scarce.
Long-Range, Global Relationships
Given the sparsity of the individual connections in the deep funnel, it is useful to observe common patterns from long range, graph connected entities and users and encode into representation. Capturing long-range relationships within large graph networks is computationally demanding. Even as hardware capabilities scale, the pursuit of modeling accuracy necessitates the design of memory-efficient attention kernels and high-performance learning algorithms.
Introducing Hierarchical Interest Representation
Our latest research area is an upstream representation layer for learning universal, relational knowledge representations of users and ads entities. The representations capture users’ ads engagement patterns, absorb real-world world semantics, and cascade through multiple hierarchical granularities into latent-space projections at each level. Based on the graph data structure, four design properties drive the system end to end:
Dimension Reduction
Hierarchical Interest Representation projects a raw graph into a configurable super-graph where each super-node is a learned latent interest primitive. User-ad edges that are sparse at the raw graph become meaningfully denser at the primitive interest graph. Inherently, the primitive interest graph is more stationary and stable in vocabulary, even though the ads business is more dynamic.
Knowledge Enrichment
Hierarchical Interest Representation enriches heterogeneous entities, in particular advertiser and product types, with multimodal content features such as text, images, and video. These features are pulled from structured page metadata and advertiser catalog attributes and processed through vision or language models. This extra information complements existing engagement data. Instead of just knowing how users interact with something, it captures what that thing actually is. Even for entities it hasn’t seen before it understands the underlying businesses and products.
Unified Relational Representation
Hierarchical Interest Representation learns thorough knowledge representation for users and entities, together with their latent interest primitives representation in a single metric space. It can infer entities’ mutual relationship and affinities across or within types. Using embedding operations, Hierarchical Interest Representation can determine primitive-to-primitive and cluster-to-cluster relationships. It can also estimate user proximity to interest primitives; how closely an ad/advertiser serves certain interest primitives; and what are the similar users, ads, and products that are closest neighbors.
Multi-Hierarchical Granularities
Given the overall sparsity of deep funnel information, there is a trade-off on how to project into primitive interests. Dense and stable relationships usually imply a coarser and higher-level abstraction, while sparse and specific connection looks at finer level of abstraction. Hierarchical Interest Representation learns super graphs, which cascade through multiple hierarchical layers for this flexibility, accommodating ranking modeling architecture, personalization, or retrieval applications.
The Hierarchical Interest Representation Architecture
Hierarchical Interest Representation builds representations by combining world knowledge of advertisers and products with user direct temporal engagement data. Its LLM-inspired transformer architecture is applied to large-scale graphs, using sparse attention to capture long-range relationships. The system is designed to power various applications across the ads platform from retrieval to final stage ranking.
The following sections detail the architectural design of each component within the Hierarchical Interest Representation system.
Enriched Engagement Graph
Heterogenous Graph Structure
Hierarchical Interest Representation is built on a typed, weighted, time-decayed graph that unifies multiple entity types – users, ads, advertisers, campaigns, products, and pixels. These entities are connected by typed engagement edges including businesses creating ads artifacts and the users-ads interaction journey. Each edge carries its action type and timestamp that balances recency intent against long-term interest. This typed, heterogeneous structure is what lets a single downstream representation reason about someone’s lifestyle, an advertiser’s catalog reach, and the products that connect them – all in one unified space.
Scaling to Meta Production Data
The graph spans billions of users, entities and their interactions on a monthly basis, served both online for production freshness and offline for evaluation and rapid iteration. Each node carries rich initial embeddings fusing pretrained semantic features with behavioral statistics. Frequent nodes add a learnable ID embedding via deep hash embeddings, a small shared neural network applied to a vector of hashes of the node ID, keeping ID memory bounded as the vocabulary scales to tens of billions.
Hierarchical Encoder
A transformer based hierarchical encoder is our modeling design to scale the representation learning at this gigantic graph size. It has considered several significant technical designs.
World Knowledge
World knowledge serves as a means to connect the dots given, which is abundant on relatively stationary entities, such as advertisers, products, etc. We retrieve the multimodal information in summary text, images, and video and process it through a customized LLM inference engine that produces encoded feature inputs for our representation learning.
Structure Encoders
The hierarchical encoder’s input layer combines rich complementary encoders. A node encoder fuses node-type, deep-hash-controlled node-ID, world knowledge features, and per-type metadata/features so each node enters the learning model with both its semantic identity and its real-world content. A position encoder applies position encoding over the sampled view from the graph to inject local topology with random walk, importance-prioritized strategies. An edge encoder prepares edge type, edge weight and temporal signals to flow into the attention learning mechanism.
Bias Composition
Transformers measure pairwise relationships between tokens through attention. Graphs, by construction, encode pairwise relationships between nodes. These two ideas naturally complement one another. Graph-structural signals (such as node-type transitions along event edges and shortest-path distance for local connectivity) enter the model as attention biases that augment the query-key dot product in every layer.
This is what makes the model topology-aware. Rather than treating a subgraph as a bag of nodes, the Hierarchical Encoder attends with explicit knowledge of how nodes are structurally related, capturing long-range relationships that standard message-passing tends to over-smooth.
Attention Kernel
Adding graph-structural bias to attention is normally expensive: the standard implementation materializes a full pairwise bias matrix, forcing a fallback from memory-efficient attention. We adopt FlexAttention, which computes each bias term on the fly so the pairwise matrix is never materialized. Variable-length subgraphs are packed into a single block-masked sequence, avoiding padding waste and cross-graph leakage. New bias terms slot in as small scoring rules, no low-level kernel work needed. The result is memory-efficient attention with full graph-structural awareness.
Training the Hierarchical Encoder
Cross-View Distillation
The Hierarchical Encoder is trained with self-supervision through a paired teacher-student scheme. For each anchor node, we sample a broad teacher view and a narrow student view, both passing through the Hierarchical Encoder. The student is trained to predict the same interest cluster as the teacher. Because the teacher sees a broader view of the graph, its prediction is more confident, giving the student a clear target to match. This extends supervision well beyond the small fraction of users who produce deep-funnel conversions, addressing much of the engagement sparsity that motivated Hierarchical Interest Representation. Sinkhorn-Knopp balanced assignment prevents single-cluster collapse, a known failure mode of self-supervised methods.
Engagement Prediction
Self-distillation discovers the latent interest primitives of the graph by teaching the model that different views of the same node should cluster together. Engagement prediction adds to the complementary supervised objective – given two node representations, an engagement type, and a time, predict whether a real engagement edge exists at that time. Together, they give Hierarchical Interest Representation both view-invariant structural priors and direct grounding in observed user behavior, turning it into a general-purpose scoring function across the delivery stack.
Online Graph Infrastructure
The raw heterogeneous graph lives on Meta’s online graph engine. The same data source powers both training and online serving, ensuring the same distribution across both. For training, subgraph fetches and node-feature reads are pipelined with GPU compute. Multiple workers prepare upcoming batches in parallel while the model trains on the current one, hiding data-loading latency behind the forward and backward passes. During the testing phase, this achieved a 30x wall-clock speedup over the synchronous baseline and kept GPU model FLOPs utilization high. Bit-exact reproducibility is preserved end to end, so infrastructure migrations and checkpoint recovery never silently shift model behavior.
Causality
To prevent information leakage, training and evaluation strictly respect the temporal order of events. The graph engine applies a cutoff timestamp on each call and masks any node or edge dated after that point.
Edges are split chronologically into train, validation, and test windows. Batches are shuffled only within fixed time chunks, giving the optimizer gradient diversity without crossing temporal boundaries. The model only learns from information that would have been available at the time, so accuracy gains reflect real learning rather than future leakage.
Tokenization
Bag-of-Meaning Tokens
Continuous universal embeddings are powerful for ranking, but they are not naturally suited for inverted-index retrieval, set aggregation, or human interpretation. We discretize them into Bag-of-Meaning (BoM) tokens – a compact, unordered vocabulary of interest concepts produced by composite quantization. A user is represented by the BoM tokens describing their interests. An ad or advertiser is represented by the BoM tokens of the interests they serve.
Activating Hierarchical Interest Representation Across the Delivery Stack
Hierarchical Interest Representation is designed to plug learned interest representations into the ads delivery stack to eventually improve deep funnel ranking across existing components such as GEM, Andromeda, and the Adaptive Ranking Model. For example, BoM tokens augment engagement-based personalization and supervision with user latent interest, and enable fast, compact recall for retrieval with inverted index lookup. Hierarchical Interest Representation’s multi-hierarchical structure supports specialized architectures, such as Mixture of Experts generative distribution learning routed by super-interest categories, and enables hierarchical reasoning over stable interest anchors for user-ad affinity.
The Future of Hierarchical Interest Representation
We will continue to advance training scaling efficiency, embedding freshness, knowledge compression, and memory-efficient attention kernels for greater representational expressiveness. We are also investigating parameter-efficient, objective conditional fine-tuning of the upstream Hierarchical Interest Representation, enabling segment-level specialization for heterogeneous deep funnel optimization objectives on top of a shared encoder.
Acknowledgements
We would like to thank Sammy Bald, Shaoqing Yuan, Chuan Hu, Chris Hayduk, Wenfan Xu, Liang Xu, Piyush Dak, Ikuhiro Ihara, Ashish Kalbhor, Manjari Jha, Priya Krishnamurthy, Xulei Liu, JC Lyu, Yuqi Bi, Vivek Bitla, Krishna Poola, Jiayin Ge, Santanu Kolay, Matt Steiner, Sandeep Pandey, Gunjit Singh, Marvin Kim, Karan Jindal, Krishi Suresh Kumar, Mehul Parsana, Manveer Kaur, Hua Liu and the entire team behind the development and production of the Hierarchical Interest Representation Project.
Agents think in milliseconds, legacy infrastructure doesn't. LinkedIn, Walmart, and Zendesk shared how they closed the gap at VB Transform 2026
Enterprise agent adoption is being throttled by legacy infrastructure gaps rather than model intelligence, according to LinkedIn, Walmart, and Zendesk.
Decoder
- Agent harness: The scaffolding code that manages the lifecycle of an AI agent, including input sanitization, tool invocation, and error handling.
Original article
Enterprise agents are constrained more by legacy infrastructure than model quality. LinkedIn pre-provisioned containers and shifted 80% of orchestration to deterministic code, Walmart governed duplicate internal agents, and Zendesk strengthened data pipelines for its 20B conversations. The lesson is to invest in evals, own the agent harness, and keep workloads portable across models.
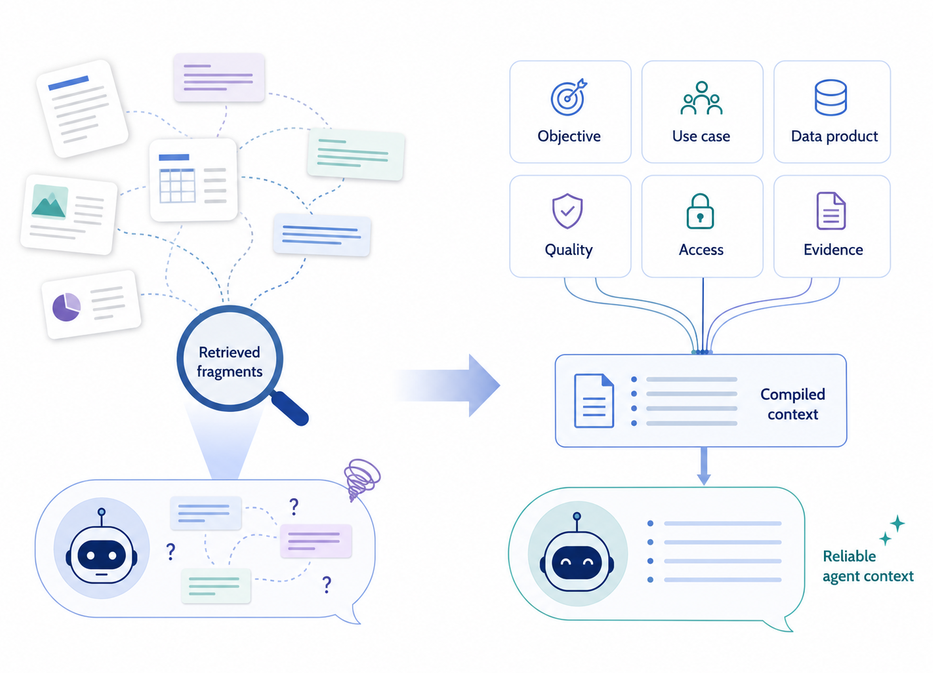
AI Agents Need Data Product Context Not More RAG
Enterprise agents need structured data-product context, not just vector search, to ensure reliability and preserve business logic.
Deep dive
- RAG fails at scale because it lacks source boundaries, ownership info, and usage restrictions.
- Data products should be compiled into multiple formats (graph, YAML, Markdown, sidecars) to suit different consumer needs.
- The system should maintain three layers: source evidence, machine interpretation, and human-approved portfolio knowledge.
- Deterministic code should verify metadata against source evidence rather than relying on LLM-generated output.
- Context should be scoped to the specific agent task, not provided as an entire enterprise dump.
- Relationships in the graph should be 'evidence-aware', identifying if a link was extracted, inferred, or manually approved.
Decoder
- RAG (Retrieval-Augmented Generation): An AI framework that retrieves data from external knowledge bases to ground the responses of LLMs.
- TOON/GCF: Compact, machine-readable sidecar formats used for shipping data-product metadata alongside assets.
- OKF (Open Knowledge Format): A standard for bundling knowledge to ensure portability across local or offline environments.
Original article
AI Agents Need Data Product Context Not More RAG
Amarnath Byakod’s article, “Context Engineering and Knowledge Cataloging for AI Agents,” begins with a problem that many enterprise AI teams will recognize. Documents are divided into chunks, converted into embeddings and stored in a vector database. An agent retrieves passages that appear relevant and produces a fluent answer. The demonstration looks successful until someone asks where each statement came from, whether the passages belong together and whether the answer reflects the correct business context.
In Byakod’s clinical experiment, the retrieval process combined information from different patients into one invented clinical profile. The system found semantically related text, but it failed to preserve the boundaries and relationships that made the information meaningful. His conclusion is direct:
“This isn’t a retrieval problem. It’s a knowledge catalog problem.”
That distinction applies far beyond clinical systems. It is equally relevant to enterprise data, data products and the growing number of AI agents expected to use them. Retrieval helps an agent find information, but it does not tell the agent what that information represents, how different pieces relate to each other or under which conditions the information should be used.
Retrieval Does Not Give an Agent Business Context
Most enterprise agent initiatives begin with access. Teams connect an agent to SharePoint, Confluence, databases, APIs or document repositories. They add embeddings and retrieval, then test whether the agent can answer questions. At first, this often creates the impression that the agent now understands the organization.
In reality, access and understanding are different things. An agent still needs to know which information belongs together, which source owns a fact, which product supports a business use case and which terms carry an agreed meaning. It also needs to understand quality expectations, service commitments, access methods and governance restrictions. These are data product questions.
A vector store might retrieve passages mentioning customer churn, revenue risk and customer segmentation. It does not tell the agent whether those passages belong to an approved customer risk product, whether they support the same KPI or whether the agent is allowed to use them for a specific decision. It does not explain who owns the information, whether the source is current or whether the data meets the quality level required for the task.
Enterprise context must therefore contain more than retrieved content. It must preserve product meaning, source evidence, relationships and operating conditions.
One Governed Model Needs Several Representations
Byakod proposes an architecture in which one extraction process produces several parallel representations of the same knowledge. A graph supports relationship traversal. A compiled Markdown wiki gives a language model dense and connected context. A portable Open Knowledge Format bundle supports local or offline use. A query engine then selects the representation that best fits the question.
This is closely aligned with the direction of the Open Data Products ecosystem and the Data Product SDK.
ODPS describes an individual data product and its operational contract. ODPC provides a catalog and portfolio structure. ODPG describes relationships between products, objectives, use cases and other portfolio elements. ODPV provides shared vocabulary, while ODPR defines repeatable processes for creating and maintaining products. The SDK already produces compact TOON and GCF sidecars and supports OKF import and export.
These formats do not compete with each other. They represent different projections of the same governed product model.
A portfolio manager might need a visual view of products, gaps and strategic alignment. A platform might need a machine-readable graph. A governance process might need the full ODPS contract. An agent might need a compressed context package that contains only the details relevant to one task. A developer might need a local bundle exposed through the CLI, Python API or MCP server.
The important design choice is not to force every consumer into one format. It is to maintain one governed model and compile the representation required by each use case.
Compile Context Around the Work the Agent Must Perform
One of the strongest recommendations in Byakod’s article is:
“Compile context, don’t just retrieve it.”
This principle should have a direct influence on how agents consume data products.
An agent assessing customer retention risk should not receive the entire enterprise catalog or fifty fragments that happen to mention churn. It should receive a prepared context package containing the products, definitions, relationships and operating conditions relevant to that task.
That package might include the business objective, the KPI, the approved use case, the products supporting it, the required quality conditions, the available access services and the vocabulary used by the organization. It should also include product dependencies, source evidence, permitted purposes and the current product version.
The Data Product SDK already creates summaries and compact sidecars. The next step is to treat this as a context compilation problem rather than a document summarization problem.
A context compiler could accept an agent task, a portfolio scope, a consumer identity and a token budget. It would then assemble the smallest complete package that allows the agent to operate correctly. Instead of exposing every available field, it would prepare only the product context required for the task.
This would move the SDK beyond specification generation. It would position the SDK as an execution layer between governed data products and AI agents.
Maysano Portfolio Studio Already Applies This Model
This context engineering model is not only theoretical. Maysano Portfolio Studio already applies many of the same principles to data product portfolios.
The Studio starts from source documents rather than from manually completed catalog forms. Business objectives, signals, use cases and data product needs are extracted from those materials and organized into a connected portfolio model. The source documents remain attached to the portfolio, which means the original evidence stays close to the context created from it.
That is an important difference from a typical retrieval setup. The system does not treat source files as a loose collection of text chunks. It transforms them into explicit business objects.
An objective becomes a defined node. A signal becomes a defined node. A use case becomes a defined node. A data product becomes a defined node. These objects are not stored as isolated records. Their relationships appear in a graph that shows how business intent, evidence, use cases and product needs connect.
Each node also has a structured YAML representation. This gives the same portfolio several useful forms at the same time. Business users see a rich, understandable portfolio. The graph reveals the relationships. The YAML gives platforms, developers and agents a machine-readable definition.
The source document, the business object, the graph relationship and the YAML node all describe the same underlying context from different perspectives.
This closely matches the architecture described by Byakod. One source-grounded model produces several representations for different consumers. The difference is that Maysano Portfolio Studio is not cataloging clinical or domain knowledge alone. It is compiling business and data product context.
The Studio therefore acts as a business context compiler for data products.
It prepares the context before an agent needs it. The source documents explain where the knowledge came from. The portfolio objects explain what that knowledge means. The graph explains how the objects connect. The YAML provides the structure needed by software and AI agents.
This also creates a direct path into the Data Product SDK. The Studio produces the portfolio context, while the SDK validates, packages, traverses, transforms and exposes that context through ODPC, ODPG, ODPS, sidecars, workflows and agent interfaces. Together, the Studio and the SDK form two layers of the same system.
Maysano Portfolio Studio is the business development and portfolio formation layer. It turns unstructured source material into a reviewed and connected model of objectives, signals, use cases and products.
The Data Product SDK is the technical and operational layer. It turns that model into validated specifications, graphs, portable context packages, workflows and agent-ready interfaces.
This is stronger than connecting an agent directly to a document repository. The agent receives structured product context that has already been connected to business intent.
Every Generated Product Claim Needs Evidence
Byakod places provenance at the center of the architecture. Extracted entities point back to exact locations in the source material. The system then verifies those references independently rather than trusting the language model’s output.
This principle matters greatly when the Studio and SDK generate data product definitions from business documents.
When the system extracts a business objective, product need, KPI, consumer, restriction or relationship, it should preserve the evidence behind that extraction. A statement such as “the customer risk product supports the churn reduction objective” should link back to the page, slide, spreadsheet cell or text section that supports it.
Maysano Portfolio Studio already keeps the source documents attached to the portfolio. The next step is to deepen that relationship at node level. Each objective, signal, use case and product should retain direct references to the exact source evidence from which it was created.
The system should also separate three layers of information.
- The first layer is source evidence. This records what the original material states.
- The second layer is machine interpretation. This records what the extraction process inferred from that evidence.
- The third layer is approved portfolio knowledge. This records what a human accepted into the active model.
This separation prevents generated specifications from becoming detached from the source material that created them. Without it, reviewers see a polished product description but cannot determine which parts came directly from evidence, which parts came from interpretation and which parts were added during review.
Source-grounded generation would make portfolio decisions easier to explain, challenge and audit.
Schema Validation Is Not Enough
The SDK already validates specification structure, but structural validity does not prove that generated content is correct.
A product definition can conform perfectly to the ODPS schema while containing an unsupported objective, an invented consumer or an incorrect relationship. The file is technically valid, but the product knowledge inside it is unreliable.
This is where Byakod’s approach offers an important lesson. The language model proposes entities and relationships, but deterministic code verifies whether the source evidence exists. The model assists with interpretation. It does not act as the final authority. The same principle should guide Maysano Portfolio Studio and the Data Product SDK.
The language model should first propose portfolio objects and product metadata from the source material. Deterministic checks should then confirm that the evidence exists. Vocabulary resolution should verify that the extracted terms match agreed business language. Schema validation should confirm that the resulting ODPS, ODPC or ODPG artifact is structurally correct. Cross-object checks should ensure that referenced products, objectives and use cases exist. A human should then approve the result before it enters the active portfolio.
This creates a more reliable sequence. Source material becomes proposed context. Proposed context becomes verified metadata. Verified metadata becomes approved portfolio knowledge.
Product Graphs Need Evidence-Aware Relationships
A graph becomes useful when agent questions depend on relationships rather than isolated facts.
An agent might need to know which products support a use case, which objective a product contributes to or which dependencies must exist before a workflow can operate. ODPG provides the structure for representing these relationships, while Maysano Portfolio Studio makes those relationships visible during portfolio development.
The relationship itself should retain its origin. A graph edge should state whether it came from an approved specification, a source document, a machine inference or a human review. It should also retain the evidence supporting that connection.
This matters because not every relationship has the same level of authority. A declared dependency in an approved product contract is different from a connection inferred from similar wording across two documents. Both might be useful, but they should not look identical to an agent or reviewer.
Evidence-aware graph relationships would allow the Studio and SDK to support reasoning without presenting every generated connection as an established business fact.
This is especially important in a living portfolio. A graph might show that a signal supports a use case, that a use case depends on a product or that several products contribute to one objective. Those relationships become more trustworthy when the reviewer can see whether they were extracted, inferred or approved.
Data Product Context Goes Beyond Knowledge Cataloging
The architecture in Byakod’s article focuses on entities, relationships, source grounding and query routing. That is suitable for the clinical prototype he describes, but enterprise data products require a broader operational context.
An agent does not only need to know that information exists. It needs to know how that information should be consumed.
That includes ownership, lifecycle status, access interfaces, data quality commitments, service levels, permitted purposes, policies, pricing conditions, version information and strategic contribution. These are the elements that turn a body of knowledge into a governed data product.
This is where the ODPS family extends the knowledge catalog model. The catalog tells the agent what is known and how concepts connect. The product contract tells the agent how the information is offered, who is accountable for it and under which conditions it should be used.
Maysano Portfolio Studio adds another layer before the operational contract. It shows why the product should exist in the first place.
The objective explains the intended business outcome. The signals explain why action is needed. The use case explains how value will be created. The product explains which reusable capability must support that use case. The graph connects these elements into one business story. The SDK then carries that story into the operational and technical layer.
This gives the agent more than knowledge and more than access. It gives the agent a connected explanation of business intent, product structure and operating conditions.
Context Must Change When the Business Changes
Byakod also describes an incremental maintenance model. Source files receive checksums. New and changed files are processed, while unchanged material is skipped. Only affected graph and wiki outputs are rebuilt. Grounding metrics then show whether the quality of the catalog has declined.
This pattern fits naturally with the render, sync and refresh levels already introduced through Data Product SDK recipe contracts.
Maysano Portfolio Studio should maintain a source manifest that links each input document to the objectives, signals, use cases, products and relationships generated from it. When a source changes, the Studio should identify which parts of the portfolio might be affected.
The SDK should then regenerate only the related technical artifacts, preserve approved manual edits and present a semantic change report for review. The result should not be an automatic replacement of the approved portfolio. It should be a controlled proposal that explains what changed, which products depend on the changed source, which relationships were added or removed and which context packages are now stale.
This would support a living portfolio rather than a periodic catalog rebuild.
It also strengthens the relationship between the Studio and the SDK. The Studio manages the evolution of business context. The SDK manages the evolution of the corresponding machine-readable and operational artifacts.
The Studio and SDK Form a Context Engineering System
The Data Product SDK already supports validation, explanation, generation, catalogs, graphs, vocabulary, workflows and compact context formats. Maysano Portfolio Studio adds the business-facing layer that turns source material into structured portfolio knowledge. Together, they form a broader context engineering system.
For each portfolio, the Studio can retain the source material, the business objects, the graph and the YAML representation. The SDK can then transform those into validated ODPS, ODPC and ODPG artifacts, compact sidecars, portable bundles and runtime interfaces.
For each product, the combined system could generate an agent-ready package containing the governed specification, compiled Markdown context, compact TOON and GCF representations, source evidence, vocabulary references, access instructions and a maintenance manifest.
The ODPS file would remain the governed contract. The Markdown file would provide dense, model-readable context. TOON and GCF would support token-efficient agent use. The evidence file would preserve source grounding. The manifest would support incremental updates. The access instructions would explain how the agent should consume the product.
The SDK could then route questions to the correct representation. Catalog questions would use ODPC. Relationship questions would use ODPG. Product contract questions would use ODPS. Terminology questions would use ODPV. Process questions would use ODPR. Runtime context would use compact sidecars.
Maysano Portfolio Studio would provide the business meaning behind those artifacts. It would show which objective the product supports, which signals created the need and which use cases depend on it.
This is more precise than generic retrieval over product documentation. It gives the agent a compiled operating context built from source-grounded business knowledge and governed product definitions.
From Knowledge Catalogs to Governed Agent Context
Byakod closes his article with another compact principle:
“Ground every fact. Route every query. Monitor every metric.”
For data products, one more requirement should be added: govern every use. Enterprise AI agents need knowledge catalogs, but they also need product contracts. They need evidence, relationships and compact context, along with ownership, access rules, quality expectations and lifecycle control.
They also need the business story around the product. They need to understand which objective matters, which signals created urgency, which use case creates value and which product provides the capability.
This is where Maysano Portfolio Studio and the Open Data Product Specifications family come together.
Maysano Portfolio Studio compiles unstructured business material into structured portfolio context. The ODPS family provides the common language for describing products, catalogs, graphs, vocabulary and processes. The Data Product SDK turns that language into validated artifacts, workflows and agent-ready packages.
The opportunity is larger than improving retrieval. It is to create a governed context layer through which AI agents understand what enterprise data means, where it came from, why it matters, how it connects and under which conditions it should be used.
That is the foundation required for agents that do more than locate information. It is the foundation for agents that participate safely in real business operations.
Ontology Playground (GitHub Repo)
Microsoft released an open-source visual playground for designing and testing ontologies intended for Microsoft Fabric IQ.
Decoder
- Ontology: A formal representation of knowledge as a set of concepts within a domain and the relationships between those concepts.
- RDF (Resource Description Framework): A standard model for data interchange on the web, designed to represent graph data.
- Fabric IQ: A Microsoft service focused on AI-powered real-time intelligence and knowledge management.
Original article
Ontology Playground (Preview) ☕
Note: This project was developed with AI-assisted coding.
Try it live → microsoft.github.io/Ontology-Playground
A free, open-source web application for learning about ontologies and Microsoft Fabric IQ. Explore pre-built ontologies, design your own in a visual editor, export as RDF/XML, and share interactive diagrams — all from a fully static site with zero backend dependencies.
Features
Interactive Graph Exploration
Cytoscape.js-powered graph that renders any ontology as an interactive node-and-edge diagram. Pan, zoom, click nodes to inspect properties, and use the live search bar to filter entities and relationships.
Ontology Catalogue
A curated library of official and community-contributed ontologies spanning six domains (Retail, E-Commerce, Healthcare, Finance, Manufacturing, Education). Browse by category, search by name or tags, load any ontology with one click, and view its RDF source. Every ontology has a shareable deep link (/#/catalogue/official/cosmic-coffee).
Visual Ontology Designer
A full-screen, split-pane editor for creating ontologies from scratch or editing existing ones. Add entity types with icons, colors, and typed properties; define relationships with cardinalities; see a live graph preview that updates as you work. Includes undo/redo (50 levels), real-time validation, and export to RDF/XML or JSON.
RDF Import & Export
Full round-trip support for RDF/XML (OWL classes, datatype properties, object properties with cardinalities). Import .rdf / .owl files, export in the exact format Microsoft Fabric IQ expects, and verify fidelity with automated round-trip tests.
One-Click Catalogue PR
Sign in with GitHub (device flow) and submit your ontology to the community catalogue directly from the designer — the app forks the repo, creates a branch, commits the RDF + metadata, and opens a pull request automatically.
Embeddable Widget
A self-contained JavaScript file (ontology-embed.js) that renders an interactive ontology viewer on any web page with a single <script> tag. Supports dark/light themes, multiple loading methods (catalogue ID, URL, inline base64), and click-to-inspect.
Ontology School
A structured learning hub (/#/learn) with 9 courses spanning conceptual learning paths and hands-on labs:
- Ontology Fundamentals — 6 articles covering core concepts (What is an Ontology? → RDF/OWL → Fabric IQ → Build Your First → Design Patterns → Contributing)
- 7 Domain Learning Paths — Fourth Coffee, E-Commerce, Finance, Healthcare, Manufacturing, University, and HR System. Each path has 4 progressive articles that build an ontology step-by-step, with live embedded graphs showing new entities at each stage.
- IQ Lab: Retail Supply Chain — A 7-step hands-on lab that builds a 15-entity ontology from scratch.
Every article supports presentation mode (slides split at ## headings) and includes interactive quizzes with instant feedback. Ontology embeds load live graphs from the catalogue with optional diff highlighting.
Quest System
Five progressive quests that guide users through ontology concepts with multi-step instructions, hints, progress bars, and achievement badges.
Natural Language Query Playground
Type natural language questions ("Which customers placed orders?") and see how they map to ontology entities and relationships — a preview of Fabric IQ's NL2Ontology capability.
Command Palette & Keyboard Shortcuts
Press ⌘K / Ctrl+K anywhere to open a searchable command palette. Jump to the Catalogue, Designer, Ontology School, Import/Export, Help, and more without leaving the keyboard. Press ? for quick help access.
Starter Templates
The designer offers five domain templates (Retail, Healthcare, Finance, IoT, Education) so new users never face a blank page. Each template creates 3 entities with properties and 2 relationships, ready to customise.
Interactive Onboarding Tour
First-time visitors get a 5-step guided tour with a spotlight overlay that highlights the Header, Graph, Quests, Inspector, and Designer in sequence.
Getting Started
Prerequisites
- Node.js 18+
- npm 9+
Installation
cd Ontology-Playground
npm install
Development
npm run devProduction Build
npm run buildThe build pipeline compiles the catalogue, compiles learning content markdown, type-checks, bundles the app, and builds the embed widget. Output is in build/.
Running Tests
npm test            # single run
npm run test:watch  # watch mode
Deployment
Azure Static Web Apps (primary)
The repo ships with a GitHub Actions workflow that deploys to Azure SWA on every push to main.
- Create a Static Web App in the Azure Portal
- Connect to your GitHub repository
- Copy the deployment token and add it as the GitHub secret
- Push to
main— the workflow handles the rest - PR preview environments are created automatically for pull requests
GitHub Pages (for forks)
A separate workflow deploys to GitHub Pages, ideal for forks:
- Fork this repo
- Go to Settings → Pages → Source and select GitHub Actions
- Push to
main
Technologies
- React 19 + TypeScript 5
- Cytoscape.js — Graph visualization (fcose layout)
- Zustand — State management
- Vite — Build tool
- Framer Motion — Animations
- Lucide Icons — Icon library
- marked — Markdown compilation (build-time)
License
MIT
Postgres 19 Compression: from pglz to LZ4
Postgres 19 is set to adopt LZ4 as the default TOAST compression algorithm, significantly outperforming the legacy pglz method in speed and efficiency.
Decoder
- TOAST (The Oversized-Attribute Storage Technique): A mechanism in Postgres that transparently moves large, variable-length values out-of-line to a separate storage table.
- pglz: The legacy PostgreSQL-specific compression algorithm used since version 7.1.
- Varlena: The internal storage format for variable-length types in Postgres, containing a header that dictates whether data is compressed.
Original article
Postgres 19 Compression: from pglz to LZ4
Postgres 19 is planning to change the default TOAST compression from pglz to LZ4, so let's look at how Postgres compresses data in table storage and indexes. Postgres uses a single, unified compression framework for table (heap), TOAST, and indexes. In heap and TOAST, compression is automatic and on by default for variable-length types like TEXT, VARCHAR, BYTEA, and JSONB. In indexes, it is opportunistic: compression fires only when an individual key exceeds the size threshold, not for every variable-length value stored in an index.
History of Postgres Compression
Compression was first added in Postgres 7.0, released in 2000, but not in the form it takes today. At the time, Postgres had a strict 8kB maximum row size, and trying to insert more than 8kB would throw an error. Fixing this row size limit was a priority for the Postgres core team.
The first attempt to work around the limit was an explicitly compressed field. Postgres 7.0 shipped an lztext data type that used the pglz compression algorithm. This implementation had tradeoffs: the 8kB row limit still existed, and users had to explicitly choose a compressed data type.
After the 7.0 release, the next logical step might have been to add more compressed data types like LONG or BLOB (as many closed source databases were doing at the time). Instead, the Postgres core team rejected additional data types and rallied around TOAST. Discussions on the pgsql-hackers mailing list show the group split the 8kB problem into two distinct problems: a data type problem and a physical storage problem. Compression and TOAST were the answer to the physical storage problem.
TOAST with pglz
With Postgres 7.1, TOAST was implemented using pglz.
The pglz algorithm lives in the pg_lzcompress.c file. Because Postgres is open source, we can read the author's reasoning for home-rolling a compression algorithm right in the comments:
- Trade ratio for speed: pglz is fast to compress and decompress, and willingly gives up compression ratio to get there. The source code calls this another "speed against ratio" preference characteristic of the algorithm.
- Minimal memory usage: the algorithm uses a 4096-byte sliding window, small enough not to affect Postgres' memory needs. The comments note that the compressor works best for attributes of a size between 1K and 1M, so it trades away performance on very large values.
- Aggressive fail-safe: the algorithm is designed to fail fast when data does not compress well, to avoid wasting CPU cycles.
- No external dependencies: the algorithm is self-contained and does not require any external libraries. Back then, Linux was not the default server OS for the cloud (nor was there a "cloud"), so Postgres needed a compression algorithm that would work everywhere it was compiled.
Jan Wieck authored the algorithm and left an acknowledgement at the bottom of the file:
Many thanks to Adisak Pochanayon, who's article about SLZ inspired me to write the PostgreSQL compression this way.
Adisak Pochanayon's SLZ article described a compression scheme built for the game industry, where it was used to compress graphics and audio data.
Why move from pglz to LZ4?
pglz was built for a different era, and LZ4 is a modern algorithm whose tradeoffs match modern hardware. Postgres' LZ4 rollout follows a path similar to the original pglz implementation: first as an option, then as standard. Since Postgres 14, LZ4 has been available via a system-wide setting (default_toast_compression = 'lz4') or a column-specific setting (column_name text COMPRESSION lz4).
- Faster compression: LZ4 compresses significantly faster than pglz. On an totally unscientific test, a 2,000 row INSERT of ~10 kB values, LZ4 completes in roughly 6 ms versus 50 ms for pglz (8× faster). Decompression throughput is similar between the two algorithms with this data set, as I/O and memory latency dominated over CPU decode time.
- Better compression ratio (sometimes): LZ4's 64 kB sliding window (versus pglz's 4 kB) finds more back-references in the data, which expands compression. On a similar, totally unscientific workload, LZ4 produced 111 bytes stored per 10,400 bytes raw (98.9% reduction) versus pglz's 186 bytes (98.2% reduction), and used 312 kB of total heap space versus pglz's 472 kB. There are situations where pglz has a better compression ratio.
- Continues to fail fast: LZ4 has an efficient early-abort mechanism designed to detect random or incompressible data quickly.
Postgres storage strategies
First off, you need to know that Postgres has a few different storage strategies for columns:
EXTENDED (we capitalize it because the Postgres docs do, not because we're yelling) lets Postgres use every tool available. This is the default for variable-length types like TEXT, VARCHAR, BYTEA, and JSONB. Values can be stored uncompressed, compressed, in the heap, or in TOAST.
PLAIN stores the column inline in the heap, uncompressed. It is the default for fixed-width types like INT, FLOAT, and BOOL. These values rarely benefit from compression.
EXTERNAL tells Postgres to store the column in TOAST, but not compress it.
MAIN tells Postgres to try compressing the column, but avoid moving it to TOAST if possible.
The varlena format
For variable-length types, Postgres uses a format called varlena to store the data. varlena is a self-describing format with a header that records the length of the data and whether it is compressed. It is used for all variable-length types (including TEXT, VARCHAR, BYTEA, and JSONB) and it is what gets stored in the heap, in TOAST, and in indexes.
Only variable-length types are compressed. Fixed-length types (like INT, FLOAT, and BOOL) are never compressed; they are stored directly in the heap.
The compression decision tree
When writing data (insert or update), Postgres attempts to get the row size below a threshold of roughly 2 kB (toast_tuple_target, default 2040 bytes). It uses the following decision tree for EXTENDED columns:
- If the entire row is already smaller than ~2 kB, Postgres writes the row directly to the heap, uncompressed.
- If the row exceeds the threshold, Postgres sorts the EXTENDED columns by size and attempts to compress the largest one. If compression succeeds and brings the total row size under the threshold, it stops and writes to the heap. If not, it moves to the next largest column.
- If all eligible columns are compressed and the row still exceeds the threshold, Postgres begins moving the largest EXTENDED or EXTERNAL columns out-of-line into the TOAST table, replacing each with an 18-byte pointer in the main heap tuple until the row fits.
- If it still doesn't fit, Postgres loops back to compress any MAIN columns inline. If that fails, it takes the last resort: moving those MAIN columns out-of-line into TOAST.
Checking actual compression savings
-- pg_column_size: bytes as stored in the heap or TOAST table (after compression)
-- octet_length:  bytes of raw character data (uncompressed)

SELECT
  pg_column_size(payload) AS stored_bytes,
  octet_length(payload)   AS raw_bytes,
  round(
    (1 - pg_column_size(payload)::numeric
          / NULLIF(octet_length(payload), 0)) * 100, 1
  ) AS compression_pct
FROM events WHERE length(payload) > 100 LIMIT 5;
pg_column_size reports the compressed data size. When it returns a value much smaller than octet_length, the value was successfully compressed. When the two are approximately equal, the value did not compress well enough to save space. In that case, if the value is large (above the ~2 kB threshold), it will still have been moved to the TOAST table uncompressed.
Compression in indexes
B-tree index pages store key values as IndexTuple entries. Each entry contains an IndexTupleData header (8 bytes) followed by the key datum. For variable-length types, the datum uses the same varlena format as heap tuples (piggybacking on the workaround built for the 8kB row limit).
Postgres uses a single compression framework tied to the TOAST architecture. It flags in the varlena header whether the data is compressed. If the heap already compressed a value, it goes into the index compressed. If a value is uncompressed and exceeds 510 bytes (TOAST_INDEX_TARGET, about 1/16 of the 8 kB buffer page), the index code invokes the same TOAST compression routine inline to try to make it fit. If the compressed form fits, it is stored compressed. If even the compressed form exceeds the limit, the write transaction fails.
This is why repeat('x', 5000) can be B-tree indexed: LZ4 compresses 5,000 repeated characters down to ~38 bytes, well within the 2704-byte cap. Random or pseudo-random data of the same length produces a compressed form nearly equal to the original, which exceeds the cap and cannot be indexed.
-- These succeed: both compressible, both fit after LZ4 compression
CREATE INDEX ON docs (body);

INSERT INTO docs VALUES (repeat('x', 5000));    -- stored: ~38 bytes compressed
INSERT INTO docs VALUES (repeat('ab', 2000));   -- stored: ~35 bytes compressed

-- This fails: md5 output is pseudo-random, essentially incompressible
INSERT INTO docs VALUES (
  (SELECT string_agg(md5(g::text), '') FROM generate_series(1, 88) g)
);
-- 2816 chars of MD5 → compressed form ≈ 2816 bytes → index row size 2832 > 2704
-- ERROR:  index row size 2832 exceeds btree version 4 maximum 2704 for index "..."
-- HINT:   Values larger than 1/3 of a buffer page cannot be indexed.
The future of compression in Postgres
There's a lot to learn about how Postgres moves forward by looking at compression. The early false step of dedicated compressed data types was acknowledged, and the underlying pglz work was retooled into TOAST, which has been a huge success. In moving from pglz to LZ4, Postgres is taking a similar approach: first a test, then a migration. The core team has moved intentionally to make sure the compression algorithm change is the correct path.
From Weeks to a Day: How We Made LLM Evaluation Fast Enough to Iterate on
Airbnb optimized LLM evaluation by caching generated references and judge scores, reducing turnaround times from weeks to under a day.
Decoder
- LoRA (Low-Rank Adaptation): A method for fine-tuning large models by freezing the base weights and injecting small, trainable rank-decomposition matrices.
- Judge: An LLM used to evaluate the output of another LLM, typically by scoring for quality, safety, or relevance.
Original article
Airbnb cut LLM evaluation cycles from weeks to under a day by caching generated references and judge scores, since over half of model outputs across candidates were identical strings and judge drift of about 1% per run. Small LoRA adapters with rank under 50 train in under an hour on a single GPU for same day fixes, and a final validation stage runs sampled traffic to catch failures.
Apple Sends Legal Letters to Dozens of OpenAI Employees
Apple is pressuring dozens of former employees now at OpenAI to preserve documents as part of its ongoing trade secret lawsuit.
Original article
Report: Apple Sends Legal Letters to Dozens of OpenAI Employees
Apple has reportedly sent legal letters to dozens of former Apple employees now working at OpenAI, telling them to preserve potentially relevant documents and communications as it continues to pursue its trade secret lawsuit against the AI company.
The Financial Times reports that Apple has targeted around 40 former employees with legal preservation letters, acting on its belief that the alleged misappropriation of confidential information may extend beyond the individuals named in its original complaint.
The development follows Apple's lawsuit filed last week against OpenAI, in which the company alleges a coordinated effort to obtain confidential information relating to its hardware engineering and product development.
Apple claims OpenAI recruited key engineers, including former Apple executives Tang Tan and Chang Liu, and benefited from proprietary designs, manufacturing processes, and other trade secrets. Tan is OpenAI's Chief Hardware Officer and a 24-year Apple veteran who led product design, while Liu is on the hardware team at OpenAI after working as a senior system electrical engineer at Apple.
The complaint says that more than 400 former Apple employees now work at OpenAI and suggests that the alleged misconduct is broader than a few isolated actions by individual employees. OpenAI has denied the allegations, saying in a statement to Bloomberg this week that it is "not aware of any evidence that this complaint has merit."
Apple has requested an injunction requiring OpenAI to cease using any Apple information during the development of OpenAI's AI hardware device. Apple is also seeking damages and suing Tan and Liu for breach of contract for violating their employment agreements. The company believes the evidence uncovered so far may represent only the "tip of the iceberg," according to its lawsuit.
Demis Hassabis and Google's AI Commitments
Demis Hassabis's AI framework is under scrutiny alongside Google's internal friction over military contracts and autonomous weapons development.
Original article
This post examines Demis Hassabis's framework for frontier AI alongside criticism of Google's military agreements. It also covers Alex Turner's resignation after unsuccessfully opposing broad government use of Google's models, including for autonomous weapons.

Claude Fable 5 will be included in all Max and Team Premium plans
Anthropic is expanding access to its Fable 5 model to subscription plans while providing credits to other users to manage unpredictable compute demand.
Original article
Beginning July 20, Claude Fable 5 will be included in all Max and Team Premium plans, at 50% of limits. Pro and Team Standard users will continue to have access to Fable via usage credits, and will receive a one-time $100 credit. Demand for Fable has been challenging to predict, which is why we rolled it out to subscription plans in stages, extending access several times as we secured additional capacity.

A Chinese AI startup is about to hit $1bn in sales while giving its best models away for free
Chinese AI startup Z.ai is projected to reach $1 billion in annual sales by leveraging an enterprise-heavy, on-premises deployment model.
Original article
One of China’s leading AI startups is closing in on a milestone the rest of the industry keeps missing. Z.ai, the company behind the GLM models, is set to become the first independent Chinese AI firm with $1bn in annual sales, Bloomberg reports.
The claim is a projection, not a booked result. But the trajectory behind it is real, and it points at something the West has struggled to copy.
Z.ai is making money at scale while open-sourcing its strongest models. That combination is not supposed to work.
The numbers
The base is small but the growth is not. Z.ai’s 2025 revenue was about 724m yuan, roughly $100m, up 132% on the year.
The forecasts are steep. JPMorgan expects 2026 revenue of about 4.6bn yuan, rising to 30.9bn yuan by 2028, the year it projects the company will finally turn a profit.
The billion-dollar line needs one caveat. It leans partly on annualised recurring revenue, a run-rate snapshot, rather than a full year of booked sales, and even JPMorgan’s 2026 revenue forecast sits below it in dollar terms.
How it actually makes money
The mix is enterprise-heavy. A large share comes from on-premises deployments for state-owned enterprises and financial institutions, alongside a fast-growing cloud business.
The API side is the momentum story. Annualised recurring revenue from its open platform reached 1.7bn yuan, up sixtyfold in a single year.
The open-source paradox
Here is the part that confounds the Western playbook. Z.ai releases its most capable models, including GLM-5.2, as open-source software anyone can download and run for free.
Giving the model away is supposed to destroy the ability to charge for it. Z.ai is betting the opposite, that free models drive adoption, and adoption sells cloud, support, and on-premises deployments.
It is the instinct its founder Tang Jie has defended in public, arguing frontier AI should stay open to everyone. The revenue figures are the commercial case for that philosophy.
Why it matters
Most AI companies, American and Chinese, lose enormous sums. Z.ai is no exception yet, and its losses have kept climbing even as revenue soars.
But approaching $1bn in sales is a different order of maturity from the pure cash-burn most labs live in. It suggests China’s machine for turning technology into revenue is now firmly pointed at AI.
TNW has argued that China’s real edge is commercialisation, not subsidies, the knack of scaling and monetising faster than anyone. Z.ai is that thesis applied to large language models.
The caveats worth keeping
The billion-dollar number is a forward projection, and projections in AI have a short shelf life. The company is still lossmaking, and much of its revenue leans on state-owned buyers, which blurs the line between commercial demand and state support.
The valuation is extraordinary too, at roughly $112bn after a rally of well over 1,000% since its January listing. Z.ai has already raised billions in a follow-on share sale, and the price assumes the projections come true rather than reflecting where the business is now.
It also operates in a brutal market, with cheap Chinese models undercutting each other and the US labs on price. Reaching $1bn in sales is one thing, and keeping enough margin to profit from it is another.
Still, the milestone would be a real one. Chinese AI’s story so far has been capability catching up and capital pouring in, and revenue at this scale is the first sign it can also start paying for itself.
Meta in Talks to Lease Computing Power to Anthropic in Potential $10 Billion Deal
Meta is negotiating a $10 billion computing deal to supply Anthropic with infrastructure over the next two years.
Original article
Anthropic proposed a computing deal with Meta in June that could be worth as much as $10 billion over two years. Meta is considering the deal, which would involve monthly payments and the option to opt out of any agreement early. The talks show how demand for more computing power is still high. The deal could open up a new line of business for Meta and provide Meta with a new revenue stream until demand for its own AI services catches up.
SpaceX in Talks to Provide Computing Power for Pentagon's AI Push
SpaceX is discussing a multi-billion dollar deal to provide the Pentagon with high-end AI computing capacity.
Original article
SpaceX is in talks to provide the Defense Department with computing capacity at a cost of up to several billion dollars. Some national security officials have raised concerns that the Pentagon is becoming too reliant on Elon Musk's services. Pentagon officials have said they want to reduce reliance on individual tech companies. The Pentagon is seeking $30 billion in funding for an initiative that will focus on securing high-end AI chips.
scroll-world (GitHub Repo)
The scroll-world tool builds immersive, scroll-driven 3D landing pages for agents using Higgsfield for asset generation.
Decoder
- Scroll-scrubbed: A UI technique where the progress of a video or 3D animation is bound to the user's scroll position, allowing the user to control playback speed manually.
Original article
scroll-world
An agent skill — for Claude Code, Codex, and any SKILL.md-compatible agent — that builds an immersive, scroll-scrubbed "fly through the world" landing page for any industry or brand — the kind where, as you scroll, a camera flies from outside each scene into its interior, then flows on to the next scene with no cuts. One continuous connected flight through a little generated world (think the Emons logistics site, applied to whatever you want).
Install
Claude Code — as a plugin (recommended)
/plugin marketplace add oso95/scroll-world
/plugin install scroll-world@scroll-world
Then just ask for a scroll-through world landing page, or invoke /scroll-world.
Codex & other agents — via the skills CLI
Using Vercel's skills CLI, which installs into Codex, Claude Code, Cursor, and 20+ other agents:
npx skills add oso95/scroll-world            # pick your agent(s) when prompted
npx skills add oso95/scroll-world -a codex   # or target Codex directly
In Codex, invoke it with $scroll-world (or /skills to browse), or just ask for a scroll-through world landing page.
Manually (drop-in skill)
Copy the skill folder into your agent's skills directory:
git clone https://github.com/oso95/scroll-world
cp -R scroll-world/skills/scroll-world ~/.claude/skills/   # Claude Code
cp -R scroll-world/skills/scroll-world ~/.codex/skills/    # Codex
Requirements
- The Higgsfield CLI, authenticated (
higgsfield auth login), with credits. ffmpeg/ffprobefor frame extraction and encoding.- Python 3 with Pillow (for the mobile portrait canvases; also the optional transparent-scene knockout).
- The Codex CLI (optional) — if present, the scene stills can be generated through Codex's built-in
image_gen(the same GPT Image model), billed to a ChatGPT subscription instead of Higgsfield credits.
What it does
It leans on Higgsfield for the art: cohesive isometric diorama scenes (GPT Image 2 — via Higgsfield, or the Codex CLI on a ChatGPT subscription) and the camera flights themselves (Seedance or Kling image-to-video — only models that can frame-lock a seam), scrubbed by scroll position — the same technique behind Apple's scroll-through product pages. The camera genuinely moves; scroll only drives time. It's framework-agnostic: you get the Higgsfield pipeline, the prompt templates, and a portable vanilla-JS scrub engine that drops into plain HTML, Next.js, Vue, or a Python-served page — nothing assumes a stack.
When invoked, the skill:
- Interviews you — the subject/industry + pitch, a brand kit (import from a URL, hand it over, or have it proposed), art direction, the ordered scenes the camera visits, whether you want the mobile version (a second chain rendered natively in 9:16 portrait — composed for phones, not a crop of the landscape film), and the budget — render tiers and stills source shown with estimated credit costs, approved before anything generates.
- Generates the assets — one still per scene, one "dive-in" camera clip per scene, and the connector clips that join consecutive scenes, generated from the actual rendered frames of their neighbours so every seam is frame-identical. Mobile opt-in renders a parallel portrait chain the same way, frame-locked against its own 9:16 renders.
- Wires it up — a config-driven scroll engine that plays the whole chain as one flight, serving the portrait clips and posters automatically on phones.
What's in the skill
skills/scroll-world/
├── SKILL.md                    the procedure + the seam rule + gotchas
└── references/
    ├── prompts.md              intake checklist + every Higgsfield prompt template
    ├── pipeline.md             copy-paste batch scripts (generate → frames → connectors → encode)
    ├── scrub-engine.js         portable, config-driven scrub engine (blob-seek, lazy load, seam crossfade)
    ├── index-template.html     a minimal standalone page that mounts the engine
    └── knockout.py             background knockout for floating scenes
Notes
- Asset generation costs Higgsfield credits (~N image gens + ~2N-1 video gens for N scenes; the mobile chain doubles the video gens) and takes a while — the skill runs generations in the background and polls. Per-generation pricing isn't exposed by the CLI, so the skill calibrates against your live balance and states the estimated total before spending.
- The generated
.mp4/.webpassets are produced per project; they're not shipped here.
License
MIT — see LICENSE.
Maybe Intelligence Ain't All That
High-level intelligence is not a silver bullet because most real-world problems are constrained by physical building and deployment speeds rather than pure reasoning.
Original article
AI chatbots are now smarter and more capable than a lot of people, but there has yet to be an explosion or take-off in usage. Coming up with ideas was never the hard part. Most problems can't be worked out at a desk by thinking. Reality stays bound by how fast a thing can be built and whether it holds.

Apple, Nvidia vie for title of world's most valuable company
Apple briefly reclaimed the title of the world's most valuable company from Nvidia in July 2026 as market sentiment shifted toward consumer AI product pipelines.
Original article
- Apple surpassed Nvidia in market value, reclaiming its spot as the world's most valuable company.
- Apple has outperformed the AI chipmaker in 2026 as investors reward its AI spending plans.
- Nvidia had held the title of world's most valuable company since June 2025, when it surpassed Microsoft.
Apple and Nvidia battled it out on Friday for the title of world's most valuable company, with the iPhone maker briefly topping the long-time leader in market value.
Shares of Nvidia briefly dropped about 3% and its market value dipped to $4.84 trillion in early morning trading, while Apple hovered near a $4.88 trillion market value. Those spots later reversed, and Nvidia closed slightly above Apple.
The two companies have had very different fortunes in 2026.
Apple has surged almost 23% this year, outperforming the market as investors reward its AI agenda and light capital spending model as businesses commit unprecedented capital to the infrastructure buildout.
Shares also hit fresh highs this week and HSBC upgraded the stock to a buy rating, citing new AI capabilities and a strong product pipeline.
"This AI boost comes at the right moment, when we think Apple has one of its most innovative product pipelines in place," they wrote.
Meanwhile, Nvidia has gained just 9% and largely sat on the sidelines as Wall Street pivots to the memory chip and infrastructure stage of the data center buildout. That's benefited memory stocks such as Micron Technology and Sandisk.
Nvidia had held the title of world's most valuable company since June 2025, when it surpassed Microsoft. In October, the company became the first to hit a historic $5 trillion market cap.
That same month, Apple crossed a $4 trillion market cap for the first time ever on the heels of strong iPhone sales.
AI Mania Is Eviscerating Global Decisionmaking
Corporate leadership is currently caught in a cycle of performative AI adoption, where the fear of appearing behind the curve forces managers to mandate failed projects.
Deep dive
- Widespread failure of internal AI chatbot and agentic workflow projects.
- Prevalence of 'AI-washing' where employees bypass AI tools but report usage to meet management quotas.
- The 'coordination problem' prevents executives from admitting AI projects are failing, as others have already staked their professional reputations on them.
- Misaligned incentives cause boards and leadership to demand AI investment regardless of actual business value.
- Recommendation to avoid direct confrontation in group settings and instead seek one-on-one alignment.
Decoder
- Agentic workflow: A system where AI agents are given the authority to perform a sequence of tasks autonomously rather than just answering individual prompts.
- AI-washing: The practice of rebranding existing software or manual processes as 'AI-driven' to gain favor with management or investors.
- Bimodal split: A data distribution where responses cluster at two extreme ends of a spectrum—in this case, users either claiming a project is a massive success or a total failure.
Original article
Full article content is not available for inline reading.
How to manage AI investments in the agentic era
OpenAI advises enterprises to shift their AI financial strategy from tracking token costs to measuring utility-based ROI and actionable capacity planning.
Original article
OpenAI highlights that falling AI costs should be evaluated through useful work per dollar, not token prices alone, emphasizing visibility, outcome-based ROI, governance, scalable workflows, and capacity planning. Enterprises can invest confidently by tracking usage, matching models to tasks, controlling risks, funding repeatable solutions, and scaling proven AI deployments.
Amazon EC2 now surfaces the public SSM parameters associated with public AMIs
Amazon EC2 now includes SSM parameter references directly in AMI metadata, making it easier to track the latest image versions automatically.
Decoder
- AMI: Amazon Machine Image, the template that provides the information required to launch an EC2 instance.
Original article
Amazon EC2 now surfaces the public SSM parameters associated with public AMIs
Amazon EC2 now surfaces the AWS Systems Manager (SSM) Parameter Store parameters associated with public AMIs directly in the AMI metadata. When you describe a public AMI, the response includes the associated public SSM parameter, making it easy to discover and reference in your configurations.
Previously, finding the SSM parameter associated with a public AMI required searching through SSM parameter namespaces manually. Now, when you describe a public AMI, the response includes the public SSM parameter it is associated with. This allows you to discover the SSM parameter for a public AMI easily and use it as an alias that always resolves to the latest version, simplifying AMI updates across your infrastructure.
This capability is available to all customers at no additional cost in all AWS regions including AWS China (Beijing) Region, operated by Sinnet, and AWS China (Ningxia) Region, operated by NWCD, and AWS GovCloud (US) Regions. To learn more, please visit the documentation.
OpenAI tweaks chat access in the ChatGPT app for Mac
OpenAI updated its ChatGPT Mac app to restore intuitive chat history access after user backlash over its clunky, redesigned interface.
Deep dive
- Restores easier access to past chat history and Projects.
- Introduces a toggle switch between standard Chat and Work modes.
- Adds a sidebar menu for quick model switching between ChatGPT and Codex.
- Addresses concerns regarding the application's heavy Electron-based architecture.
Decoder
- Electron: A framework for building desktop applications using web technologies like HTML, CSS, and JavaScript.
- Codex: A specialized OpenAI model family optimized for programming and code generation tasks.
Original article
OpenAI has updated its redesigned ChatGPT app for Mac after widespread criticism of its confusing interface, restoring easy access to chat history and Projects. The app now features a clear toggle between Chat and Work, while a sidebar menu lets users switch between ChatGPT and Codex, making the standard chat experience much easier to find again. Although the update fixes the biggest usability complaint, the app still relies on a larger Electron-based framework and has a more complex interface than before, leading some to question OpenAI's focus on integrating new AI tools over maintaining a polished Mac experience.

Meta's "regret" over its scrapped AI tool is like a burglar apologising for the mess
Meta scrapped a feature that scraped public Instagram photos for its Muse Image AI after backlash from talent agencies and unions.
Deep dive
- Meta's Muse Image AI initially allowed using public Instagram photos without explicit creator permission.
- The feature was enabled by default, requiring users to opt-out manually.
- SAG-AFTRA and major talent agencies like CAA condemned the practice as an exploitation of creative labor.
- Meta retracted the feature within three days of public outcry.
- The incident signals a recurring tech industry pattern of shipping aggressive data-scraping features first and apologizing second.
Original article
There's a specific flavour of tech industry apology we've all heard a hundred times now. Launch fast, break things, upset people, listen to the outrage, then reverse course while insisting your intentions were pure and you just got a little overexcited.
Meta delivered a textbook example of this last week, and if you're a creative professional whose work exists online, you need to pay attention.
Last week, Meta rolled out Muse Image, its first AI image generation model, "built by Meta Superintelligence Labs". Buried among the features was something quite shocking. Users could tag any public Instagram account and use that person's photos to generate or alter AI images, all without asking permission. Worse, the feature was switched on by default. If you didn't know to turn it off, you were opted in automatically.
Three days later, it was gone. Meta admitted the feature had "missed the mark" and was "no longer available." On the one hand, phew. On the other hand, what on earth were they playing at?
Predictable backlash
Let's be clear, it's not just pushy journalists like me who have a problem with this stuff. Hollywood union Sag-Aftra urged its members to protect themselves as soon as the feature launched, calling the opt-out approach "an utter miscalculation of public sentiment regarding the obvious dangers and harms inherent in such use." That's not the language of a niche complaint; it's the language of an organisation that saw this coming from a mile off.
CAA, the talent agency representing the likes of Tom Hanks and Meryl Streep, went further, framing the issue as one of basic creative rights rather than just privacy. "No one's name, image, likeness, voice or creative work should be used by any third party, including AI models, without clear, documented consent," the agency stated. It added that "true innovation puts creators first: respecting their rights, protecting their livelihoods, and giving them real control, not handing it over to platforms." Quite.
Privacy International, the London-based charity, put it even more bluntly, telling the BBC the episode was: "The latest sign AI companies see people's images and data as raw material to be exploited." Strident language perhaps, but hard to argue with when the default setting required no consent at all, and the burden fell on the individual to notice and opt out.
Giving the game away
Of course, none of this is new. OpenAI ran into near-identical criticism over an opt-out feature on its Sora 2 video model, before eventually changing course and shutting the feature down. In that light, such moves are starting to look less like an oversight and more like intentional strategy. Namely: launch the maximally aggressive version of a feature, gauge the backlash, then retreat to something more defensible while claiming you learnt something.
If you squint, it's almost a template. Ship it. Get shouted at. Apologise using the phrase "missed the mark". Repeat with the next product.
Indeed, Meta's own statement rather gives the game away. "Our intent was to provide a useful creative tool and to give people control over whether their public content could be referenced in this way," the company said, which is a curious thing to say about a feature that gave people control only after it had already been used without asking. It's the corporate equivalent of building a door with no lock, then apologising for the burglary rather than the door.
Key takeaway for creatives
For anyone earning a living from design, illustration, photography or any other kind of creative work, the issue isn't really one Insta feature. It's the assumption, baked into how these tools keep getting built, that anything public is fair game. But a portfolio shared to attract clients isn't the same thing as a training set or a remixing playground. And this distinction matters enormously to creatives.
So along with the need for outrage, unfortunately there's a need for vigilance. Until something drastic changes, default settings will keep favouring the platform over the individual… because that's the commercially convenient position to start from.
Meta reversed this particular decision quickly, but only because the backlash was loud, fast and came from organisations with real leverage: unions, talent agencies, privacy charities. Freelancers without that collective weight behind them don't always get the same swift correction.
The company says it's heard the feedback. But with an AI video tool reportedly already in development and more integrations planned across WhatsApp, Facebook and Messenger, it's worth asking whether "heard" means "understood" or just "noted for next time". Given the pattern so far, creatives would do well to keep checking their settings, rather than trust that the lesson has actually landed.

AI 3D Model Generator (Website)
V2Fun allows users to generate 3D models and game assets through text-based prompts or by uploading reference images.
Original article
Full article content is not available for inline reading.
The Agentic Creative Studio (Website)
Miora is an agentic design tool that persists user style preferences and iteratively collaborates on canvases.
Original article
Miora reads your canvas, remembers your style, and iterates with you. Not a one-and-done tool — a creative partner that gets smarter every session.

Databricks hits $188B valuation, extending its run as AI's favorite second act
Databricks secured a $188 billion valuation by successfully rebranding its data infrastructure as a mission-critical platform for enterprise AI agents.
Deep dive
- Databricks moved from big data analytics to AI orchestration with products like Lakebase (database for agents) and Unity (AI gateway).
- The company uses Omnigent to manage multi-agent workflows.
- Internal benchmarks show open-weight models like Z.ai’s GLM 5.2 now match proprietary models for complex coding tasks.
- Databricks found that the 'harness' (the agentic wrapper managing context) is as important as the model itself for controlling costs.
- The Pi harness outperformed competitors in context management, reducing unnecessary token usage.
- Rapid valuation growth reflects investor demand for companies that control the 'plumbing' of the AI ecosystem.
Decoder
- Lakebase: Databricks’ proprietary database architecture specifically optimized for indexing and serving data to AI agents.
- Open-weight models: AI models where the weights (learned parameters) are publicly available, allowing developers to host and fine-tune them on their own infrastructure rather than relying on a closed API.
- Harness: A software wrapper around an LLM that handles prompt engineering, context window management, and task iteration to improve agentic performance.
Original article
Databricks on Thursday announced a new round of funding that values the company at $188 billion. The round was led by Coatue.
Databricks didn’t disclose exactly how much it raised; it said the money isn’t in its hands yet and that the round will close later this summer. (Other outlets have since reported the raise is roughly $3 billion.) While it’s unusual for a company to announce before it gets the money, a VC tells TechCrunch that the deal is solid, with so many firms wanting in that the company had no reason to keep its shiny new valuation a secret.
In fact, Databricks has been on a year-and-a-half fundraising tear as it successfully transitioned its image into an AI provider and not just a yesteryear SaaS sensation. Yesteryear being back in the BC times (Before ChatGPT).
Only five months ago, in February, Databricks closed a $5 billion Series L raise at a $134 billion valuation. Five months before that, in September 2025, it raised $1 billion at a $100 billion valuation. And roughly nine months before that, in December 2024, it raised what was a record-breaking round at the time of $10 billion at a $62 billion valuation.
Databricks has raised so many rounds over the years that this latest one became the subject of memes about running out of letters of the alphabet. “Turning on alerts for when we get a Series AA,” one person posted.
But its image reconstruction has been legit. Founded in 2013, it initially grew to success back in the big data era, with software that enabled enterprises to store enormous amounts of data in the cloud, yet produce speedy analytics.
Because it already sat on troves of enterprise data, Databricks was then well-positioned to respond as companies started wanting AI with the same security and governance they expect from traditional enterprise software.
The company began rolling out one AI product after another, like Lakebase, its database built for AI agents, and Unity, its AI gateway, along with a “meta-harness” called Omnigent that manages multiple agents.
Databricks also increasingly became known as one of the big examples of enterprises adopting more affordable Chinese-based open-weight models (models whose underlying code is published for anyone to use and modify) for cost control, one of the big trends of 2026. It is a particular champion of Z.ai’s GLM 5.2 as a model for coding.
Last week Databricks CEO Ali Ghodsi shared the results of some internal benchmarking done to manage his own AI costs for his 3,000 software engineers.
The company compared AI models on the actual tasks its programmers do. Not surprisingly, in the blog post revealing the results, Databricks shared that “open models, and GLM 5.2 in particular, are now able to handle even the highest level of task difficulty” in coding, and at a total lower cost than proprietary models from Anthropic and OpenAI.
But it did surprise people by finding that the choice of harness — the agentic coding tool, like Codex or Claude Code, that wraps around a model and manages its context and instructions — equally impacted costs. It found open source harness Pi to be one of the best at managing context surrounding each prompt, and therefore one of the lowest costs choices without sacrificing quality.
“The lesson here isn’t that one harness is always cheaper or that native harnesses are worse,” the post declared. “Instead, model choice is only one piece of the puzzle.”
All of this has added to Databricks’ image as an AI company, even if it wasn’t founded as an AI lab. This, in turn, has granted it the AI-halo for raising money and leaping its valuation. As we previously reported, the AI effect is so strong these days, that even sandwich shop Jersey Mike’s mentioned AI 22 times in its S-1 documents.
Kimi K3 has received far more love than expected
Moonshot AI has paused new Kimi subscriptions as compute demand following the K3 release exceeds current capacity.
Original article
Kimi is temporarily pausing new subscriptions and prioritizing compute for current members.
China Joins Rush to Rethink the Smartphone for the AI Era
ZTE has released the NaviX Ultra, a smartphone designed specifically to surface agentic AI services like ByteDance's Doubao.
Original article
Several companies are now racing to develop devices with built-in AI agents. ZTE Corp. has unveiled a lineup of co-designed smartphones with built-in AI services. The NaviX Ultra, which it calls the world's first agentic smartphone, pulls up ByteDance's AI agent Doubao with a voice command or the press of a button. It comes in black, pink, white, and blue.
These AI-Native Companies Have Tiny Staffs and Fewer Bosses
AI-native companies are adopting a 'player-coach' organizational structure with fewer middle managers and higher ratios of engineers to general staff.
Decoder
- Player-coach: A management style where supervisors continue to perform individual contributor tasks alongside their leadership responsibilities.
Original article
The newest generation of AI-infused companies offer a vision of how work could soon be structured in other American corporations. They have fewer workers, more on-staff engineers, and a flatter structure where everyone is a player-coach instead of strictly overseeing teams. The structure is a proving ground for the philosophy that corporate giants are trying to channel through reorganizations, de-layering, job cuts, and investment into AI.
On-brand Ads, Generated in Seconds (Website)
Branda automatically extracts branding and product assets from a website URL to generate ready-to-use ad campaigns in seconds.
Original article
Paste a public domain, and Branda pulls the logo, colors, style, and products, then generates 4–6 ready-to-ship ads: three for the company and up to three for its products.
20+ Handpicked Fonts for Subtitles & Subheadings
A collection of over 20 fonts curated specifically for subtitles and subheadings, focusing on high legibility and diverse visual styles.
Original article
This roundup features 20+ fonts suited for subtitles and subheadings, spanning styles from geometric sans serifs to slab serifs, handwritten, and pixelated designs.

Are we stuck in the typographic principles of the 20th century? Matter Of's new anti-design manual investigates
Matter Of’s new book, New New Typography, challenges the rigidity of 20th-century design standards through a chaotic, experimental anti-manual.
Deep dive
- Features 243 figures exploring typographic theory.
- Uses six distinct sans-serif typefaces to challenge the evolution of established fonts like Helvetica.
- Includes historical context dating back to 1602.
- Explores machine-generated and body-scanned text generation methods.
- Blends high-design theory with ironic, disruptive visual layouts.
Decoder
- New Typography: A movement pioneered by Jan Tschichold in the 1920s that prioritized asymmetric layouts, sans-serif type, and extreme legibility over classical aesthetics.
- Sans-serif: A category of typefaces that do not have small lines or strokes (serifs) at the ends of character strokes.
Original article
New New Typography challenges traditional typographic principles through historical references, contemporary experiments, and contributions from nearly 100 designers, encouraging readers to rethink what typography can become.

Data Modeling isn't Dead, You Just Stopped Doing It with Joe Reis (65 minute video)
Data modeling remains a critical skill for avoiding 'firefighting' and technical debt in modern, AI-driven data architectures.
Original article
Data modeling is still essential, especially in the AI era, because clear structures, standards, and context help teams avoid bad data, wasted work, and constant firefighting. Modern data professionals need a flexible “mixed model” approach that uses the right modeling style for the problem rather than forcing everything into one method.
Dremio's Exit Is the Clearest Sign Yet That Lakehouse-Only Won't Survive AI
Dremio's acquisition by SAP is framed by competitors as a failure of 'lakehouse-only' data platforms to meet the complex demands of modern AI.
Decoder
- Lakehouse: A data architecture that combines the low-cost, scalable storage of a data lake with the data management and performance features of a data warehouse.
Original article
Dremio's sale to SAP is presented as evidence that data platforms built around a single lakehouse will struggle with AI's demands for broad reach, freshness and unpredictable querying.