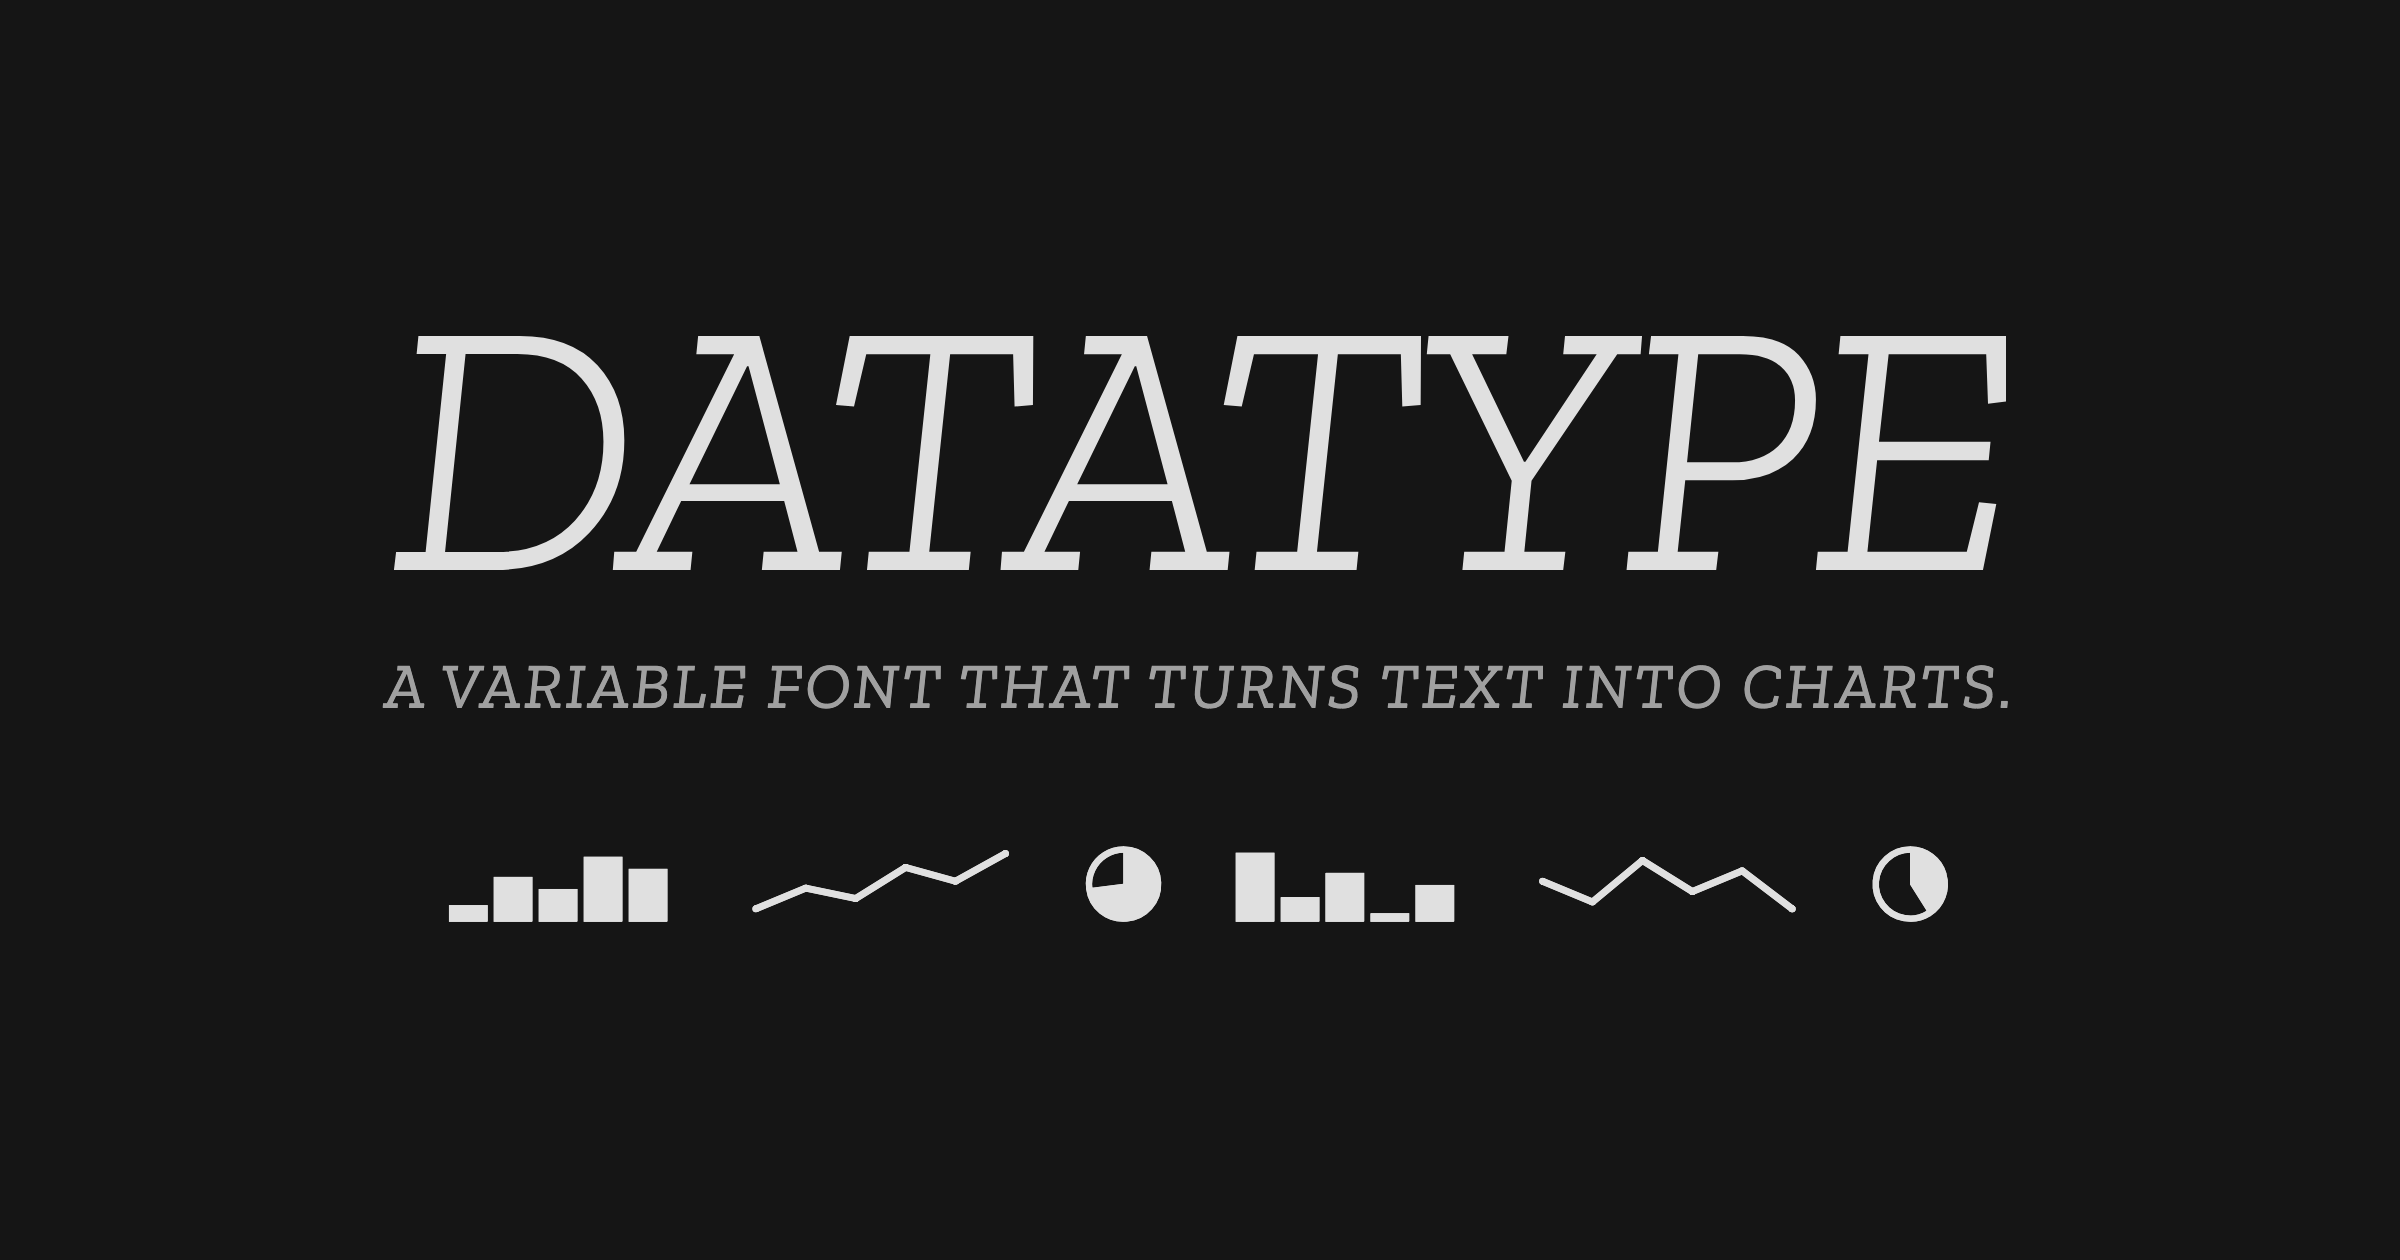
Datatype (Website)
Datatype is an OpenType variable font that renders inline bar charts, sparklines, and pie charts directly from text expressions using ligatures.
Deep dive
- Rendering mechanism: Relies on OpenType ligature substitution to map text input to graphical glyphs.
- Variable controls: Users can manipulate chart density and weight via font-variation-settings ('wdth' and font-weight).
- Supported types: Includes bar charts ({b}), sparklines ({l}), and pie charts ({p}).
- Integration: Does not require JavaScript; charts scale natively with surrounding font metrics.
Decoder
- Variable font: A single font file that contains multiple variations of a typeface, allowing developers to adjust weight, width, and other properties dynamically via CSS.
- Ligature: A specific character in a font created by joining two or more letters; here, used to substitute a string of text for a chart graphic.
Original article
Datatype is data as type
Datatype is an OpenType variable font that turns simple text expressions into inline charts. No JavaScript, no images, no rendering library — just type the syntax and Datatype's ligature substitution does the rest.
{b:30,70,50,90} Bar chart
{l:10,50,30,80,20} Sparkline
{p:65} Pie chart
Datatype is a variable font
Two axes give you control over chart density and weight. Drag the sliders to see charts respond in real time.
Datatype at different sizes
The same expressions rendered from 14px to 64px.
Datatype in context
Datatype charts work anywhere text does — tables, dashboards, reports. Here's a stock watchlist with sparklines rendered entirely in Datatype.
| Stock | 30d trend | Price | Change |
|---|---|---|---|
| AAPLApple | {l:40,25,1,0,34,73,93,100,85,26} | $255.78 | -2.27% |
| MSFTMicrosoft | {l:86,86,75,100,52,39,0,26,14,10} | $401.32 | -0.13% |
| NVDANvidia | {l:55,70,63,71,100,67,0,88,88,53} | $182.81 | -2.21% |
| TSLATesla | {l:81,77,100,73,37,47,0,39,60,39} | $417.44 | +0.09% |
| AMZNAmazon | {l:86,91,81,90,97,100,54,23,12,0} | $198.79 | -0.41% |
Charts sit naturally within running prose, matching the surrounding typeface's metrics.
Merriweather (Serif) Revenue grew steadily through Q3 {l:15,28,40,52,63,78,88,95,74,58} before a seasonal dip. Market share {p:34} held firm against competitors, and our product mix {b:60,45,80,30} shifted toward higher margins.
IBM Plex Sans (Sans-serif) The patient's heart rate {l:68,82,55,90,42,78,60,85} remained within normal range. Blood oxygen {p:97} was excellent, and the weekly activity breakdown {b:25,40,55,75,90} showed consistent improvement.
Fira Code (Monospace) cpu_load {l:15,45,90,30,75,20,85,95} spiking mem_used {p:78} req/s by endpoint {b:90,35,70,15,60}
How to use Datatype
Add Datatype to your CSS, then just type chart expressions in your HTML.
/* Load the font */
@font-face {
  font-family: 'Datatype';
  src: url('Datatype.woff2') format('woff2');
  font-display: swap;
}

/* Use it on chart expressions */
.chart {
  font-family: 'Datatype', sans-serif;
  /* Optional: adjust axes */
  font-variation-settings: 'wdth' 15;
  font-weight: 400;
}

<!-- Then just type -->
Sales <span class="chart">{l:20,40,70,50,90}</span> are up.
Budget <span class="chart">{p:73}</span> utilized.
Results <span class="chart">{b:30,70,20,90}</span> by quarter.
Bar charts {b:values}
Comma-separated values, each 0–100. Up to 20 bars.
Sparklines {l:values}
Comma-separated values, each 0–100. Up to 20 points.
Pie charts {p:value}
A single value, 0–100, representing the percentage filled.
Fresh dev news, AI-digested daily. Never miss a trend at devoured.fyi