Devoured - November 18, 2026
OpenAI has launched the high-performance GPT-6.2 Astra and efficient GPT-6.2 Sol models, while Microsoft introduced a new suite of AI tools, including the cost-effective MAI Code 2 for GitHub Copilot. Meanwhile, the industry is increasingly adopting agentic development workflows, evidenced by the release of frameworks like Replit Missions and Vercel’s eve 1.0, which automate complex projects using autonomous agent swarms.

Introducing GPT-6.2 Astra and Sol
OpenAI has launched GPT-6.2, splitting its new frontier model into a high-performance variant and an efficient everyday version.
Original article
OpenAI released GPT-6.2 Astra, a frontier model for the hardest projects, and GPT-6.2 Sol, an efficient everyday model. Both are available now in ChatGPT Work, Codex, and the API.
Microsoft's Seven New Models
Microsoft AI is challenging premium models with a new suite of seven specialized tools, headlined by the cost-effective MAI Code 2.
Original article
Microsoft AI released seven new models built for strong performance at low prices. Its MAI Code 2 coding model, now in GitHub Copilot, reaches 98% of GPT-6.1 Sol's coding quality at about 40% of the price. The lineup also covers cybersecurity, image editing, and real-time voice.

Co-Designing Sparse Attention for Efficient Long-Context Inference
NVIDIA researchers propose co-designing indexer architectures with sparse attention to bypass memory bottlenecks in long-context inference.
Deep dive
- Sparse attention solves the quadratic scaling cost of dense attention by limiting queries to a subset of keys.
- The indexer acts as the gatekeeper, scoring all tokens to select which ones to process.
- Prefill phase is compute-bound, while decode phase is memory-bound due to key-value cache access.
- Guideline 1: Maintain a group size G multiplied by draft length D+1 within a single 200-256 row Tensor Core tile.
- Guideline 2: Perform indexer epilogue and accumulation in FP16 to reduce register pressure and increase throughput.
- Guideline 3: Use KH=1 (one key head) with cross-head reduction to minimize writes to HBM.
- Guideline 4: Head dimensions of 128 or 256 are optimal; 64 leads to underutilization.
- Guideline 5: Reduce total keys via compression or index sharing, as scoring remains the primary runtime cost.
- Guideline 6: Fuse Top-k selection into the indexer to save HBM read-write cycles.
- Guideline 7: Prefer block-level selection over token-level to facilitate bulk key fetching and head reuse.
Decoder
- Indexer: The component in a sparse attention model that scores every key against a query to determine which keys are most relevant.
- Arithmetic Intensity: The ratio of FLOPs performed per byte of data moved from memory; a critical metric for optimizing GPU kernels.
- Speculative Decoding: A technique where a smaller draft model generates a sequence of tokens, which a larger target model verifies in parallel to improve speed.
Original article
Full article content is not available for inline reading.

OpenAI launches GPT-6.2 Astra and Sol on ChatGPT and APIs
OpenAI released GPT-6.2 Astra and Sol, a model pair designed for professional workflows that prioritizes token efficiency over raw parameter scale.
Deep dive
- Performance: Astra achieves 100% on ARC-AGI-3 and leads on scientific and legal task benchmarks.
- Efficiency: Models provide better outcomes with fewer output tokens, optimizing usage limits for professional users.
- Availability: Now in ChatGPT Plus, Pro, Enterprise, Edu, and API.
- Pricing: Astra priced at $8 (input) / $40 (output); Sol at $2 (input) / $10 (output).
- Safety: Models meet OpenAI's high thresholds for cyber and chemical/biological risks; new 'Control Room' system monitors for safety interventions.
Decoder
- ARC-AGI: A benchmark created by François Chollet to measure an AI's ability to learn new skills rather than memorizing training data.
- Cached Input: A billing model where frequently used prompt prefixes are stored to reduce token consumption and latency.
- Ultrafast: A high-performance inference tier for intensive workloads.
Original article
OpenAI has launched GPT-6.2 Astra and GPT-6.2 Sol, a new model pair built for professional work. Astra is the company's frontier model for the hardest projects, while Sol is its efficient, versatile model for everyday tasks. Both are rolling out now to Plus, Pro, Enterprise and Edu users in ChatGPT Work and Codex, and to developers through the API as gpt-6.2-astra and gpt-6.2-sol. OpenAI says both models produce better results on demanding tasks with fewer output tokens, so users get more done within the same usage limits.
Astra leads several benchmarks. On Agents' Last Exam, which tests multistep professional work, it scores 5.2 points above GPT-6 Astra at less than a third of the cost and 5.5 points ahead of Claude Fable 5.2 at 5% of the cost. OpenAI calls it the best model in the world for scientists, citing new highs on Terminal-Bench-Science 0.1, where it beats GPT-6 Astra by 9 percentage points, and the Vals Science Index. It more than doubles Fable 5.2's pass rate on Harvey LAB-AA legal tasks and ranks first on AA-3D with 1,318 Elo, ahead of Fable 5.2 at 1,271 and GPT-6.2 Sol at 1,259.
Astra builds slides, spreadsheets and documents that follow supplied templates and the conventions of law, sales, finance and accounting, matching layout, colors and typography down to font size, even from a screenshot.
It writes cleaner code, builds stronger frontends for websites, games and 3D design, and its more precise computer use reaches individual parts in CAD and simulation tools. Early testers including Harvey, Legora and ClickUp report fewer tokens and fewer review rounds, and Basis says its long-horizon accounting work now takes 50% less time.
Sol is smarter and more efficient than GPT-6.1 Sol. It comes within 0.5 points of Astra on Cognition's FrontierCode 2.0 at about one-fifth the cost and outscores GPT-6 Astra on LifeVal at about one-seventh the cost.
In the API, Astra costs $8 per million input tokens, $0.40 for cached input and $40 for output, 20% less than GPT-6 Astra with a 60% cut on cached input. Sol keeps GPT-6.1 Sol's $2, $0.10 and $10 rates. Ultrafast is available with both models for Pro 500 subscribers and in the API, and reaches Pro 200 for the first time, starting with Sol.
Both models meet the Critical cybersecurity threshold and the High biological and chemical threshold under OpenAI's Preparedness Framework, so they ship with tighter cyber safeguards that also restrict some legitimate security research. Astra is OpenAI's first externally released model to reach the High threshold for AI self-improvement, and the company built Control Room, a system that can halt model output on research workloads when intervention is needed.
Using a "chaos loop" to harden the Claude Docs launch: 60 server errors across billions of requests
Anthropic hardened the Claude Docs launch by using a 'chaos loop'—an autonomous agentic pipeline that broke staging infrastructure 24/7 to fix bugs before release.
Deep dive
- Strategy: Created a chaos loop to perform synthetic testing at scale before public launch.
- Results: 4.6 million docs created in 6 days; only 60 server errors across 2 billion requests.
- Stack: Built in Rust to minimize garbage collection noise, ensuring memory telemetry directly reflected application code.
- Cost: ~$125,000 in inference tokens for the testing process.
- Agents: Used a coordinator agent managing up to 30 sub-agents to test scenarios like database stalls and concurrent connections.
- Telemetry: Automated telemetry injection allowed the agent to identify and patch memory leaks in real-time.
Decoder
- Chaos Loop: A testing methodology where a system is continuously subjected to randomized failure conditions to ensure stability.
- MCP (Model Context Protocol): An open standard for connecting AI models to data sources and tools like Datadog or Slack.
- Garbage Collection: A form of automatic memory management that can introduce performance non-determinism, which the team sought to avoid by using Rust.
Original article
Using a "chaos loop" to harden the Claude Docs launch: 60 server errors across billions of requests
Claude Docs is a doc editor that you, your teammates, and Claude all work in together. The interesting part is that a Claude session anywhere, from chat to Claude Code, can open the same doc and read, write, and comment in it live, right next to you. We released Docs on September 16, 2026. This post is about the service that runs underneath it.
Three weeks before Claude Docs opened to the public, it was running as a proof of concept on a single node, used by a few thousand people inside Anthropic. We were racing toward an ambitious launch date, and our own estimate said we'd see millions of docs within the first few days.
We launched on September 16. By September 22, people had created over 4.6 million docs. Across 2 billion requests we saw only 60 server errors, and we never had to roll back. The whole Docs service ran on about 50 memory-optimized pods.
Two decisions got us there:
- A chaos loop at launch scale. We set up a test harness on our staging environment where Claude ran constantly for two weeks to try and break the service. It load tested every part of our infrastructure and fixed whatever fell over.
- Improving legibility to Claude. Claude could only close the loop effectively on fixes if our system produced accurate telemetry every iteration. We made a call early to avoid any runtime that uses memory or CPU in ways our code can't easily control (e.g. runtimes with garbage collection). When a telemetry signal looked concerning, Claude could easily trace it to a bug or a specific design decision.
But honestly, this only worked because our frontier models have gotten much better recently (I used an internal research model roughly comparable to Claude Fable 5.2). In our experience, they can now stick with one goal through a run like this for weeks, which is what helped us hit launch scale in a tight timeline.
THE CHAOS LOOP
A few thousand internal users on one machine told us nothing about whether the service would survive launch, and we obviously didn't have launch traffic to test with.
We wanted real evidence to decide how fast we could roll out. So on September 4, about two weeks before launch, I had Claude drive a staging cluster that mirrored production at over a million synthetic docs a day and break core components on purpose. And then... I just left it running.
My setup was pretty simple. The loop was a session in Claude Code that I left running: pick a scenario, run the harness, read the telemetry, propose a fix, ship it to staging, repeat. That session acted as a coordinator and handed most of the work to sub-agents. In the busiest week, that usually meant about 11 sub-agents running at a time, and 30 at the peak. The coordinator also talked to our internal variant of Claude Tag (beta) via the Slack MCP to learn from other infrastructure teams at Anthropic who had scaled similar services. Their agents checked our scaling approach for pitfalls they’d already hit.
The fun part was picking scenarios I thought were paranoid:
- 10M new docs created in a single day
- 22,000 live connections reconnecting at once
- One hot doc with hundreds of viewers, a server killed while it was still loading a doc, and the database stalling
Each iteration looked the same. Our testing harness selected a feature like document creation and pushed creation to saturation. Claude then read telemetry using the Datadog MCP and came back with a short menu of options and a recommendation.
If the recommendation was easy to undo, Claude wrote and deployed the change to staging and reran the test. We had telemetry on every operation the service ran. Every database query, for example, reported its name and how many rows it scanned versus how many it returned, so Claude could spot a bad query and rewrite it.
Before the loop started, I told Claude which decisions needed my approval; basically anything hard to undo, like changing the database schema or key layout, or changing how a doc is stored and materialized.
When Claude ran into one of those, it stopped and asked me, usually with a recommendation that I ended up approving. Schema changes were the classic case where I wanted to be consulted: there are usually a few reasonable answers, and changing directions is often painful.
And during the whole testing process, Claude had to conform to two invariants:
- Docs had to open almost instantly (even ones with a long history)
- Once the server acknowledged an edit, tests had to show the edit was still there
MAKING THE SERVICE LEGIBLE TO CLAUDE
My colleague Felix Rieseberg recently wrote a tutorial on being more ambitious with models. His main idea is to raise the "altitude" you prompt Claude at: ask for the outcome you want, not the individual task.
So instead of asking Claude to fix individual crashes, you ask it to make your app crash-free. To work at that altitude, though, you have to set up your code so Claude can pull crash reports on its own and run a harness that reproduces each crash and checks the fix.
For us, the outcome was a service that could handle launch. To get there, we did two things to make the service as legible to Claude as we could:
- A diagnostic loop. Claude read the telemetry on every iteration and added whatever it thought was missing.
- Legible technology choices. We picked a runtime and dependencies so any number Claude measured traced back to code we wrote.
A diagnostic loop
Every iteration, Claude read the telemetry and added whatever it thought was missing. Writing telemetry by hand is tedious, so in practice most telemetry would go in after something broke. Now Claude just writes it as it goes.
Memory is the best example.
Early in the harness run, one large doc was using about 3 GB on its pod (not a fun number to see). Claude’s first stab at fixing it was to shrink one of our caches so our server would evict docs sooner. The next harness run showed the memory was actually in a separate cache inside one of our dependencies, so Claude dropped the change.
From there Claude kept narrowing it down with finer-grained memory profiling. Eventually it found that every keystroke was copying the doc into several different data structures, adding a few MB each time. Claude switched those structures to copy-on-write, so they now share one reference instead of each holding its own copy.
After about three days of iterating, that doc topped out around 180 MB, and our estimate of what we’d need for launch dropped from more than 500 memory-optimized pods to about 50.
Legible technology choices
We were picky about the service’s runtime and dependencies. We wanted any number Claude measured to trace back to code we wrote.
This is because our models hill climb best with a clean signal. We expected a garbage collector to add noise, because memory and latency shift on the collector’s schedule.
Two choices helped the most:
- We wrote the service in Rust. With no garbage collector, all of a doc’s memory sits in structures we defined, so when it grew, Claude could point to the one responsible, change it, and see whether memory came down on the next iteration.
- We also kept dependencies to a minimum. Every library brings data structures we didn’t write and can’t easily account for. For the few we really needed, we vendored the code so we could read and measure it ourselves.
Rust is hard for people to write, and a few years ago that would have weighed heavily on the choice. Claude writes it and most other languages fine, so that matters a lot less now.
LAUNCH WEEK
The service held at launch scale. The first million docs showed up in about 30 hours, and we were past 4.6 million by September 22. We rolled prod 629 times in September and never once rolled back.
Launch week felt weirdly familiar. Claude is great at imagining ways a service can fail and had planned for most of them well before launch. Seven of the ten scenarios we’d rehearsed on staging actually happened in prod. By then the harness had already put staging through most of it, and Claude had shipped the fixes behind runtime flags. When part of the infra ran into pressure, we usually just flipped a flag.
WHY THIS WORKS NOW
A few months ago this probably wouldn’t have worked. Older models were fine at reading telemetry through an MCP server, but ten or twenty iterations into a long loop, they’d start forgetting what we were optimizing for, and I’d end up restating the goal. Other Anthropic employees have called this goal drift.
Our newer frontier models are built for long-running work. Claude held all of our invariants across many compactions, and I never had to repeat them.
WHAT IT COST
At Claude Fable 5.2's API list price (as of November 2026), I used roughly $125,000 of inference from the end of August to launch day. A couple of years ago, work on this scale I'd guess would have taken a team of engineers about six months.
Most of that went to reading telemetry, writing proposals, generating fixes, and reviewing code.
- Our launch was particularly massive. A good chunk of the money went into infrastructure that only makes sense at that scale, and that infrastructure took more inference to reason about.
- I also burned a lot of tokens figuring out the process. The loop ran nonstop while I was experimenting with the setup. Knowing what I know now, I think we could have spent about half as much.
TRYING THIS OUT
This works for much smaller services too, and it should cost a lot less.
To get a rough number, I priced out a classic small team stack: a couple of reasonably sized Kubernetes nodes and a Postgres instance. Then I went through the changes I landed between the end of August and launch day and removed the work that setup wouldn’t need.
Scaling our spend down and taking out the mistakes I made while I was still figuring out the setup, I’d put a two week push like this one at $3,000 to $10,000 at the same list price.
The steps below assume one engineer with Claude Code, a staging environment, and an observability provider:
- Give Claude access to your telemetry. Most observability providers have an MCP server that Claude can use.
- Have Claude write a load script that throws ten times your real traffic at the staging copy of the service and breaks things on purpose. Killing an instance, stalling the database, and deploying in the middle of a spike are good places to start. Then let Claude keep fixing whatever falls over.
- When you’re picking your stack, lean toward whatever Claude can measure most easily. For us that was Rust and as few dependencies as possible.
- Before you start, write down your most important technical invariants and give them to Claude.
- For anything that’s hard to undo, have Claude stop and give you a few options with a clear recommendation.
Accelerating development for massive Git repositories
Google open-sourced ABFS, a system that reduces Android build times from 80 minutes to two by using content-addressable storage and lazy loading.
Deep dive
- Content-addressable storage: A method where data is identified by its hash (usually SHA) rather than its location, ensuring build reproducibility.
- Lazy-loading: A design pattern where a resource or file is not loaded or downloaded until it is specifically requested by the build process.
- Tapping: The process of recording exactly which files a build process reads and writes, allowing for accurate dependency tracking even when build rules are incomplete.
- Ninja-go: A specialized implementation of the Ninja build tool that integrates with ABFS caching.
Decoder
- Content-Addressable Storage (CAS): A mechanism where data is stored and retrieved based on a unique hash of its content rather than its file path, allowing for efficient deduplication and caching.
Original article
Accelerating development for massive Git repositories
Android’s source code is big – the Android 17 open source release has 1,084 Git repositories, 1.62 million files, and takes 300 GB for a built workspace. Additionally, in a typical Android source tree with hardware vendor code and first-party applications, the size increases by 2-3x.
Traditionally, it took over 30 minutes to fetch Android Open Source Project (AOSP) source code and well over an hour to build on even highly capable developer workstations. As software development evolved over the last 2 years, modern coding harnesses and LLMs have accelerated the development of many projects. These tools are used today for Android operating system development, but the long sync and build times make them less efficient. Both human developers and agents need quick setup, parallel workspaces, and fast build-and-test iteration times.
We built Another Build File Service (ABFS) to address these bottlenecks. ABFS is a full suite of software across a Linux kernel filesystem module, user-space daemons, and server-side infrastructure. ABFS uses content-addressability across the entire stack to lazy-load and cache source code, developer workspaces, intermediate build files, and build results.
Today, we are excited to announce that ABFS is open source on GitHub.
The impact of ABFS to Android is:
- Reduced checkout times from ~36 minutes to under 8 seconds.
- Reduced full build times from ~80 minutes to just over 2 minutes.
- Enabled parallel agentic workflows across multiple workspaces and agent orchestrators.
- Shared cache reuses up to 100% of build actions across continuous integration (CI) and developer workspaces.
ABFS already powers parallel workflows for developers and agents in Android, but it is designed to scale to other massive Git-based projects.
Case Study: Android
In the Android build system, developers define build rules in Blueprint files (Android.bp), Soong compiles them into Ninja files, and Ninja executes the final build graph. Similar to the Make build tool, Ninja is timestamp-based. If a build step’s input file is newer than the existing output file, Ninja rebuilds the output file.
Code Size
Analyzing the AOSP code for Android 17 shows the sheer disk footprint and file count involved in a single checkout and build.
In a typical Android tree that includes hardware-specific repositories, board support packages, first-party applications, form-factor-specific code, etc., the code size is 2–3 times the size of AOSP (over 3,000 Git repositories), compounded across multiple active SKU and legacy maintenance branches.
Build Cacheability
Building the Cuttlefish emulator target executes a build graph with 192,249 Ninja actions. While local incremental builds are fast once a tree is already built, every new workspace, branch switch, or ephemeral agent session starts cold.
Even though typical developer changes touch only 1-10 different Git projects, someone building locally without any remote execution might waste up to 80 minutes on a 64-core machine repeating work their CI system already built. Even if a developer edits a core library like system/libbase, 97% of the build graph is identical to the CI build.
Unspecified Dependencies
Sharing cached build outputs across CI and local machines is also tricky in a codebase of Android's age and rate of change. Build rules occasionally introduce hidden dependencies (such as passing an undeclared schema file inside raw compiler flags), over-declared inputs, or undeclared outputs. In timestamp-based builds, hidden dependencies silently produce stale incremental artifacts, forcing developers to wipe output directories and run clean builds.
Solution: ABFS
ABFS makes building Android fast by replacing massive local source checkouts with a virtual, content-addressable filesystem (CASFS). ABFS streams files on demand only when a build actually touches them and utilizes shared build caching to help eliminate redundant downloads and compilation.
On the server side, Git-pushers continuously ingest new Git objects from Gerrit or other Git hosts into a horizontally scalable gRPC ABFS Content-Addressable Storage (CAS) Server that indexes Git content, workspace snapshots, and build step results. On the developer host, a local Least Recently Used (LRU) Cacheman daemon, Mount Daemon, and Tap utility connect user-space build tools to the kernel filesystem so checkouts and builds stream only what they need.
Filesystem
At the core of the client is a virtual filesystem called Content-Addressable Storage Filesystem (CASFS), a Linux kernel module that exposes Git SHA content hashes via extended attributes. When a file's hash is set, CASFS populates its metadata immediately and downloads file bytes via Cacheman only when needed:
$ touch hello
$ abfs hash --set cc628ccd10742baea8241c5924df992b5c019f71 hello   # metadata only
$ ls -l hello      # name and size are available; content is not downloaded yet
-rw-r----- 1 user primarygroup 6 Nov  3 00:11 hello
$ cat hello        # content is lazy-loaded on first read
world
Initial checkouts download only lightweight directory metadata prepopulated with Git hashes. CASFS uses Git's object model natively, allowing standard git and repo operations to work transparently.
Correct two-phase build caching
CASFS can also tap build processes. Tapping records every file actually read, written, or deleted into lists called patches, which are stored alongside cached build outputs. Ninja-go replaces timestamp checks with two-phase content-addressable caching:
- Phase 1 - Declared key lookup: Ninja-go hashes a step’s command, environment, and declared input hashes to fetch candidate results from prior CI or developer builds.
- Phase 2 - Read-patch verification: Before accepting and applying a candidate result, ABFS verifies the candidate’s recorded read patch against the current CASFS state. In the common case, this read patch will match the filesystem state and then the write patch is applied. If even a hidden dependency has a different hash on disk, ABFS rejects the stale candidate and reruns the step with tapping enabled.
Unlocking agent development
Because ABFS does lazy loading and local cache deduplication, developers and their agents can now mount multiple concurrent Android workspaces on a single machine, benefit from a shared local build cache, and achieve massive scale in development time.
# Mount 5 distinct Android release branches side-by-side in under 8 seconds each
$ abfs mount -b android-latest-release   /ws/a17
$ abfs mount -b android16-qpr2-release   /ws/a16qpr2
$ abfs mount -b android16-release        /ws/a16
$ abfs mount -b android15-release        /ws/a15
$ abfs mount -b android14-release        /ws/a14
An agent can check out a full Android tree in under 10 seconds and perform a full build in under 10 minutes. Agent swarms are empowered to iterate, review, and test in parallel, which can lead to higher quality solutions and speed.
Extending beyond Google and Android
We released ABFS as open source because we want developers, Android partners, and any large-scale Git-based project to benefit from what we have learned and be able to scale.
While Android’s Soong/Ninja pipeline was the first acceleration target, ABFS was built to be extensible to other build systems. Content-addressable build systems like Bazel map naturally onto CASFS and there is already a proof-of-concept integration with Bazel. Chromium, the Android Common Kernel, and other Google projects are exploring ABFS compatibility.
Acknowledgements
We’d like to extend a special thanks to our significant contributors for their work on this project:
Haamed Gheibi, Erik Sanders, Rob Seymour, Taylor Santiago, Andrew Hsieh, Eric Taseski, Kiyoung Kim, Hung-Wei Chen, Jose “Pepe” Galmes, Ronald Li, Yu-Che Wang, Roger Ellis, Sandeep Patil, Amith Dsouza and the entire Android Build team
Scheduling the removal of the kube-proxy IPVS backend
Kubernetes SIG Network plans to remove the kube-proxy IPVS backend in version 1.40, pushing users to adopt the nftables or iptables backends.
Deep dive
- The IPVS backend was originally created to solve O(n) scaling issues in the iptables data and control planes.
- Lack of IPVS API batch updates and complex service edge cases made it difficult to maintain.
- The nftables backend, GA since 1.33, is now the recommended path and offers performance comparable to or better than IPVS.
- Modern iptables (as of 2026) is drastically more efficient than in 2017 due to rule optimizations and batch-sync improvements.
- RHEL users are affected by Red Hat's plan to remove the iptables API, making the IPVS-based setup untenable there.
Decoder
- kube-proxy: A network proxy that runs on each node in a Kubernetes cluster, maintaining network rules that allow network communication to pods.
- IPVS (IP Virtual Server): A kernel-level transport layer load balancer used by Kubernetes to distribute traffic across service endpoints.
- nftables: A modern Linux subsystem that replaces legacy iptables for packet filtering and classification, offering better performance and scalability.
- p50 latency: The median response time, representing the middle value of a data set where half of requests are faster and half are slower.
Original article
Scheduling the removal of the kube-proxy IPVS backend
The ipvs backend for kube-proxy was an experiment in providing a service proxy implementation with better performance than the iptables backend. While it succeeded in that goal, the kernel IPVS API has turned out to be a bad match for the Kubernetes Services API, and the ipvs backend was never able to implement all of the edge cases of Kubernetes Service functionality correctly.
In Kubernetes 1.29, the project introduced the nftables backend for kube-proxy, which became GA in 1.33. Part of the plan behind adding the nftables backend was the idea that it would eventually replace both the iptables and ipvs backends. Because the ipvs backend in particular is complex, not 100% feature complete, and architecturally quite different from the other two backends (and thus more work to maintain), Kubernetes SIG Network decided to officially deprecate it as of Kubernetes 1.35. Although it currently remains available in kube-proxy (with a warning about its deprecation), we (Kubernetes SIG Network) now plan to remove it in Kubernetes 1.40. All ipvs users should therefore be planning to migrate to either the nftables or iptables backends.
Why was the ipvs backend written?
The ipvs backend was originally designed to fix two different kinds of performance problems in the iptables backend:
- First,
iptableshad problems with data plane latency (the speed at which clients could establish new connections to services), because kube-proxy would write a separate iptables rule to match each service IP, so every new connection would need to be matched against a long series of rules that was O(n) in the number of services in the cluster. - Second, it had an even larger problem with control plane latency (the speed at which kube-proxy could process changes to services and endpoints and update the data plane rules), because kube-proxy would rewrite the entire iptables ruleset every time any service or endpoint changed. While the list of rules itself was only O(n) in the total number of endpoints, the amount of time, RAM, and CPU that it took to process the updated ruleset grew faster than that. In very large clusters, kube-proxy would use 100% of one CPU all the time just to process iptables updates. (In fact, the control plane scaling problem was bad enough that for most users it was not even possible to grow the cluster to the size where the data plane scaling problem became noticeable.)
The ipvs backend solved both of these scaling problems. The data plane problem was solved mostly automatically, because the kernel IPVS subsystem uses hash tables rather than linear lookup. The control-plane problem was solved by not rewriting the entire ruleset on every update. (The kernel IPVS API doesn’t have a way of doing batch updates anyway, so this was essentially forced.)
Why is the ipvs backend now being deprecated?
Almost from the start, the ipvs backend also had problems.
The first version didn’t have 100% compatibility with the iptables backend, but it was assumed that this would be fixed over time. Unfortunately, the original authors moved on to other things outside the Kubernetes ecosystem (as inevitably sometimes happens in open source), and it took a while to find new people interested in maintaining the code.
Meanwhile, as people began using the ipvs backend in larger and larger clusters, its own scaling problems started to emerge. In particular, the lack of batch update operations in the IPVS API meant that while the ipvs backend was faster than iptables when making a few small changes, it was potentially slower when making a large number of changes at once. And because the IPVS API is fairly limited in what it can do, kube-proxy's ipvs backend needed to fall back to using iptables to implement various features of Kubernetes Services beyond basic "load balancing", making it run into some of the same scaling problems the iptables backend has. While the ipvs backend tried to mitigate this by using ipset for some of its rules, this again ran into the problem of not having a batch update API. Additionally, the fact that the ipvs backend uses iptables means that it has the same long-term support problem as the iptables backend: Red Hat's plan to remove the iptables API entirely from Red Hat Enterprise Linux means the ipvs kube-proxy backend will also no longer be available to Kubernetes users on RHEL.
What about IPVS schedulers?
Beyond performance, the other reason some users were excited about the ipvs backend was the ability to pick from among various IPVS "schedulers" for distributing traffic to endpoints, rather than relying on the simple random selection used by iptables (and nftables).
Unfortunately, the way IPVS is used by kube-proxy prevents it from being able to use most of the IPVS schedulers in a useful way. The problem is that kube-proxy is a distributed service that runs on all nodes in the cluster, but the kube-proxy processes on different nodes do not share their IPVS scheduler state, so each node picks endpoints without knowing what is happening with clients on any other node. Even the schedulers that are designed to work in a distributed way generally don't work better than random selection in the context of kube-proxy. For example, the mh scheduler uses Maglev Hashing to select endpoints, which theoretically allows for extremely efficient distributed load balancing. But that efficiency is only in the context of a specific sort of two-layer load-balancer design, and kube-proxy does not have the right architecture to be able to act as either of the two layers in that design.
Switching away from ipvs
Switching to nftables
If you are running Kubernetes 1.36 or later, and your nodes are running a Linux distribution with kernel 5.13 or later, and you use the ipvs proxy mode, then Kubernetes recommends switching to the nftables mode of kube-proxy. (Although the nftables backend is GA —and fully usable—as of Kubernetes 1.33, there have been some performance- and scaling-related fixes since then that that weren't backported to releases earlier than 1.36.)
The nftables backend is fully supported, feature-complete, and even has very slightly better performance than ipvs:
Switching is as easy as changing the kube-proxy configuration and restarting kube-proxy. For example, in clusters deployed via kubeadm, change mode: ipvs to mode: nftables in the kube-proxy ConfigMap and then restart the kube-proxy pods.
Switching to iptables: "It's Not As Slow As You Think!"
If you can't switch to nftables, either because you are on an older version of Kubernetes, or because your cluster runs on an older Linux distribution that isn't new enough to support the nftables backend, you may be able to just switch to the iptables backend, which has improved greatly since the original creation of the ipvs backend in 2017:
- The generated ruleset has been optimized to remove redundant and irrelevant rules, reducing data plane latency.
- The code that generates the ruleset has been optimized to do fewer allocations, and to avoid unnecessarily recomputing the same information multiple times, reducing CPU and memory usage when resyncing.
- Rather than doing “check the current state of the rules, then update them to the new state”,
iptableskube-proxy now does “assume the current state is correct, update to the new state based on that assumption, and only explicitly check the current state if that update fails”. This greatly improves the resyncing speed. - To the extent possible within the constraints of the iptables APIs, kube-proxy’s iptables backend now only updates iptables rules for services/endpoints that have changed since the last sync, rather than rewriting the entire ruleset every time.
The net result of this is that the iptables backend of 2026, while still not as good as the ipvs backend, is at least much better than the iptables backend of 2017 was, and many people who found iptables unusable in the past would not have problems with it now.
As with switching to nftables, switching to iptables is mostly just a matter of updating your kube-proxy configuration, although for technical reasons, in this case we recommend that you reboot each node after changing the kube-proxy configuration, rather than merely restarting kube-proxy.
Learn more
- KEP-5495 gives the full timeline and plan for kube-proxy IPVS deprecation.
- The blog post "NFTables mode for kube-proxy" has more information about
nftablesmode and its performance relative toipvsandiptables.

Uber's Secure AI Framework Governs Autonomous AI Agents across Their Lifecycle
Uber's new security framework governs autonomous AI agents by enforcing behavioral authorization and per-agent intent constraints across their entire lifecycle.
Deep dive
- Implements pre-deployment registration to define agent personas and risk profiles.
- Uses 'Argus' to scan source code and prompts for vulnerabilities before deployment.
- Employs runtime 'AI Guards' to validate if an agent's proposed action aligns with its specific intent.
- Features continuous assurance through audit logs and interaction replay for policy refinement.
Decoder
- Behavioral Authorization: A security approach that evaluates whether a specific action makes sense within the current user context, rather than just verifying if an actor has permission to access a tool.
- Agent Guard: A runtime mechanism that intercepts and reviews agent tool-invocation requests.
Original article
Uber's Secure AI Framework Governs Autonomous AI Agents across Their Lifecycle
In a recent article, Uber Engineering highlights the limitations of traditional identity and API controls in securing AI agents that dynamically reason over external content and take real-world actions. To address this challenge, Uber developed a framework to determine whether an agent's action is appropriate given the user's request, the agent's intended purpose, its permissions, and the context of the interaction.
Identity and authorization systems can determine whether a user or service has permission to access a resource, but they can't determine whether an agent's proposed action is appropriate in context.
This creates multiple risks, including prompt injection, tool and memory poisoning, goal hijacking, behavioral drift, and hallucination-driven actions, which Uber's framework addresses through three layers spanning the entire agent lifecycle, from pre-deployment to runtime enforcement to post-deployment continuous assurance.
At provisioning time, agents must be registered in the Uber AI Registry, establishing identity, ownership, persona, permitted intents, constraints, dependencies, and risk classification. This process is automated using Argus, which analyzes the agent's source code, prompts, configurations, dependencies, exposed endpoints, and tool-invocation paths to identify security weaknesses. The same approach is enforced for MCP servers and tools used by the agents.
At runtime, the framework extends the traditional security model based on policy administration, policy decision, and policy enforcement to incorporate behavioral authorization, which evaluates whether an agent's actions are appropriate in a given context.
Behavioral authorization is implemented through three components: the AI Registry, AI guards, and Agent Guard runtime hooks. The AI Registry defines and manages agent policies, personas, intents, and constraints, while AI Guards evaluate interactions and proposed actions against established policies. Agent Guard runtime hooks invoke AI Guard "at critical checkpoints and applying its verdict before an interaction or action is allowed to proceed".
After deployment, the focus shifts to Continuous Assurance, which relies on end-to-end observability, auditing, explainability, and replay. This layer comprises two main main components: a unified execution trace that connects agent actions, tool calls, and security decisions; and recorded interactions that can be replayed whenever policies and guardrails are updated to assess their effectiveness in the new context.
Uber also identified several challenges in implementing security controls in production, including balancing policy restrictiveness to avoid both excessive false positives and insufficient protection, minimizing runtime latency, reducing developer friction during framework setup, and moving beyond generic controls towards agent-specific policies, which "made enforcement more contextual and precise".
Commenting on Uber's approach on LinkedIn, UN senior information technology officer Tristan G. raised several concerns, noting that while "per-agent personas, intents, constraints and calibration" is what adds the most value, they also come at a significant cost, as "the effort scales with the number of workflows". Additionally,
By its own account, the strongest control was restricting agents to explicit constraints, which is least privilege rather than a new idea. For me, the open question is how this works for agents you don't build, such as vendor or SaaS agents where you can't insert your own enforcement hooks.
On similar lines, AI architect Pratik Dhanave also observes that:
The lesson they call least glamorous is the one they rate most effective: explicit intents and constraints per agent. Not generic thresholds, which failed because every agent has a different purpose and risk profile. The cost is flexibility, and they say it is worth paying.
Uber's Secure AI framework is still in evolving, with plans to expand its capabilities across all the areas outlined above. There is much more to the framework than can be covered here, so readers are encouraged to consult the original article for a more comprehensive overview.
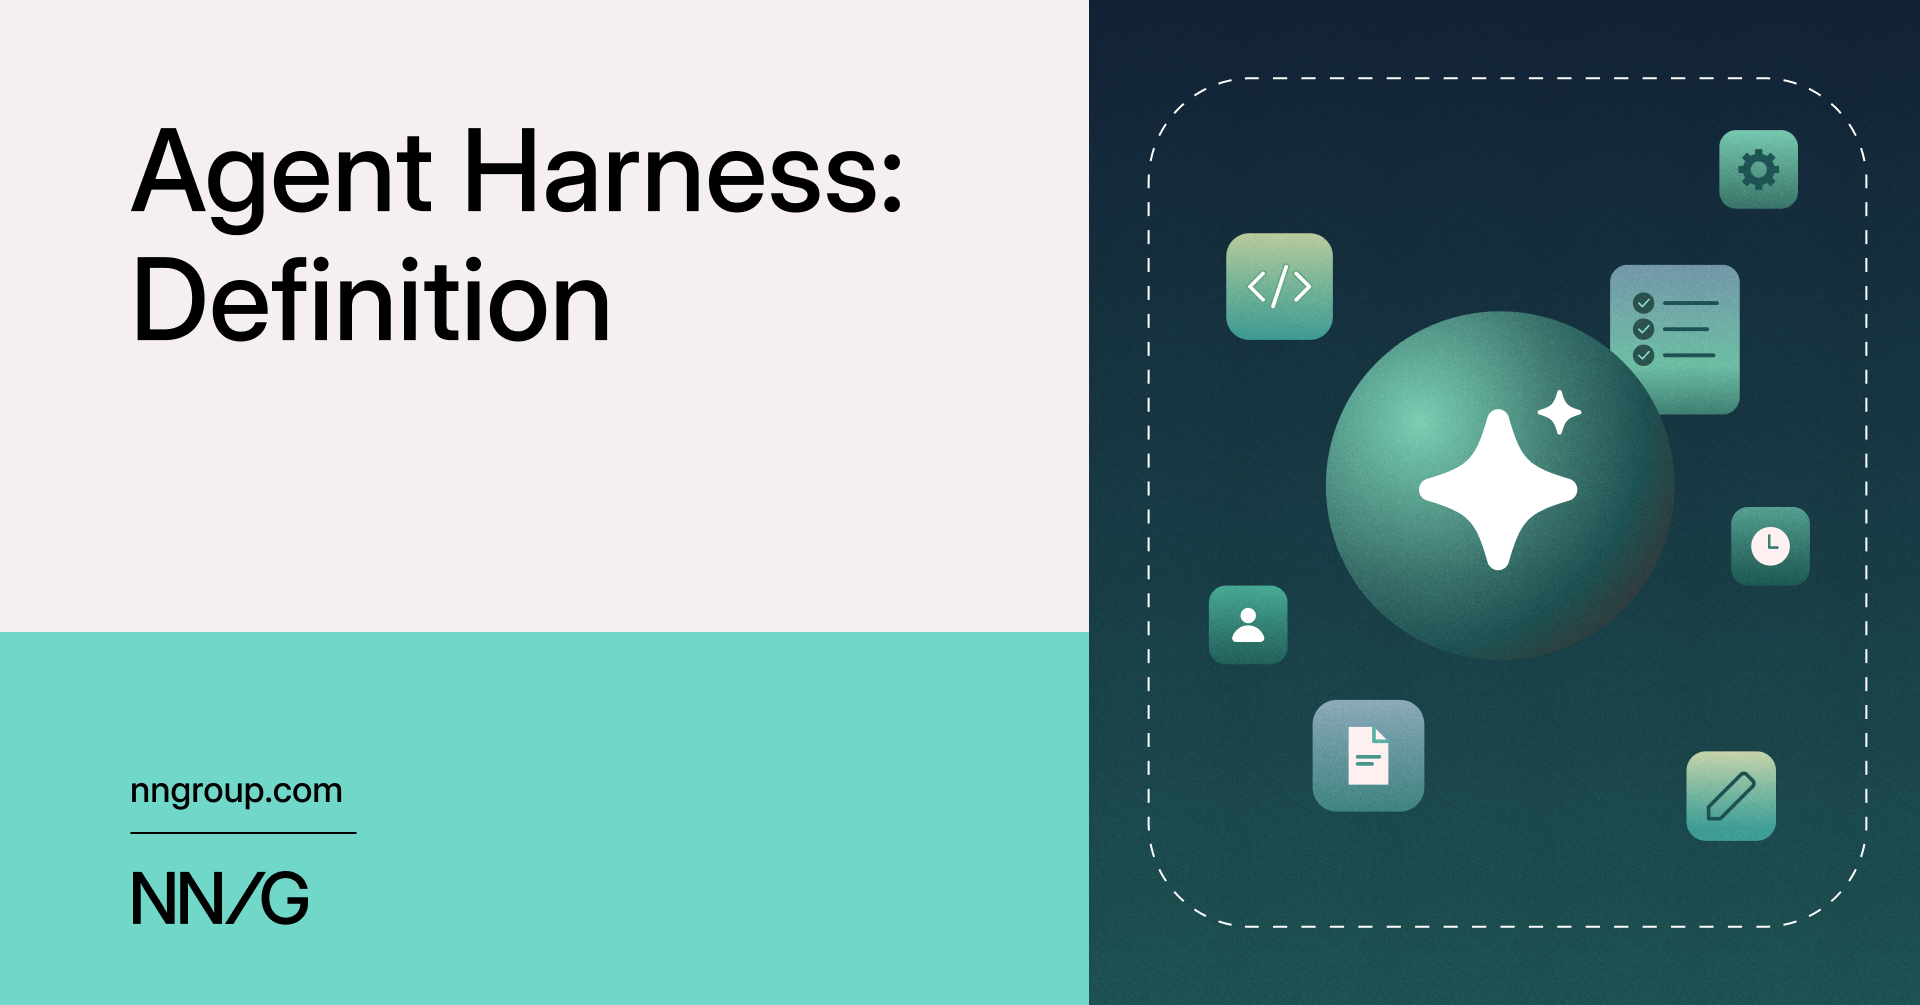
Agent Harness: Definition
An agent harness—the software surrounding an AI model—dictates a product's true capability and user experience, not just the underlying LLM.
Deep dive
- An agent harness consists of an execution loop between the model and tools.
- It defines system permissions and enforces guardrails for actions like calendar access or file manipulation.
- It manages context assembly, determining what prior history or data the model sees.
- It sets behavioral limits on task duration and cost.
- Design teams must test the complete system, not just prompt responses.
- The harness defines when and how the system requests human confirmation for sensitive actions.
- Testing must account for edge cases like dropped tool connections or user preference changes.
Decoder
- Agent Harness: The software layer that wraps an LLM, managing its input context, available external tools, permissioning, and decision-making constraints.
- Execution Loop: The cyclical process where an agent identifies a task, requests a tool action from the harness, receives an observation (the result), and determines the next step.
Original article
Agent Harness: Definition
An agent harness manages a software loop between an AI model and its tools. Its context, permissions, and limits shape what users can do.
Imagine two AI scheduling assistants: one can copy-edit meeting agendas, while the other can check invitees’ calendars, find free time, and send meeting invitations. Both rely on the same AI model, but their capabilities are quite different. Their capabilities depend on the software that surrounds and supports the AI model, called the harness.
What Is an Agent Harness?
An agent harness (also called an agentic harness, or simply a harness) is the software around an AI model that runs its execution loop: it carries out the model’s requests to use tools, returns the results, and controls what information the model receives and what it is allowed to do.
At its core, a large language model (LLM) generates data by predicting what comes next in a sequence. It can generate structured requests to check a calendar or send an invitation, but it cannot perform these actions on its own. To act, it must ask other applications to do things for it by outputting commands. An agent harness handles each such request: it checks permissions, calls the appropriate tool, and returns the result to the AI model. The AI model can then request another action, or return an output to the end user. This cycle of request, action, and result is the execution loop. Running this loop is what transforms an AI model from a simple chatbot into an AI agent that can persistently work through a task, rather than just replying to a prompt.
For our AI scheduling assistant, the AI model at the center of the AI experience might request a calendar check by writing a tool call. The harness detects that request and calls the calendar tool, returning the invitees’ availability to the AI model. The AI model then uses that information to propose a meeting time to the user or request another check by using another tool.
With an AI product, feature, or service, the user interface, harness, and AI model work together to provide a good user experience. For example, the harness specifies when the user should be asked for permission (e.g., through a confirmation dialog) and ensures that the user is asked to review the invitation before it is added to the calendar.
Tasks Performed by the Harness
Alongside running the execution loop, the agent harness supports the model’s work by:
- Supplying context
- Connecting tools and enforcing permissions
- Providing instructions and enforcing limits
Supplying Context
For each task, an agent harness assembles the context the AI model needs, including the user’s request, the developers’ instructions, previous messages, saved preferences, and information from connected calendars or documents. Saved information is useful only if the harness passes it to the model.
For our AI scheduling assistant, that might mean providing calendars, working hours, and a preference to, for example, keep Fridays free of meetings. If the Friday preference is never delivered to the model as part of its working context, the assistant may suggest a time the user would rather avoid, so the user would then have to repeat a preference the assistant should already have.
An agent harness can also change how information is presented to the model. Suppose you upload a PDF of a journey map to an AI tool for feedback. One product's agent harness might process the PDF and provide the model only the extracted text, while another might also convert the pages into images. The model receiving only text may miss relationships conveyed by the layout, even though both products can access the same file.
Connecting Tools and Enforcing Permissions
An agent harness allows the AI model to retrieve information from various tools and take actions beyond outputting text. Reading a calendar, checking a colleague's availability, and sending an invitation are operations that can require different permissions, even when a single calendar tool offers them all.
The harness controls which connected tools the model can use and when user approval is required. The connector and the underlying application also enforce their own access permissions and application rules. For example, a calendar connection might permit reading availability but not creating events; even if it permits both, the harness can require approval before calling the tool that sends an invitation. These controls work together: approval from the harness does not override restrictions in the connected application.
Providing Instructions and Enforcing Limits
An agent harness provides instructions that guide the model’s work and enforces limits on time, cost, and the number of steps the model can take before returning to the user. It coordinates repeated exchanges between the model and its tools and pauses work when human input is required. Within the boundaries that an agent harness establishes, an AI model can decide what to do next with the tools afforded to it and whether to continue its execution loop.
Suppose our scheduling assistant finds no time that works for all invited guests within the specified date range. That particular search is finished, but the user’s request and task isn’t, and the model might keep requesting new searches unless something stops it. Alternatively, the assistant could ask the organizer whether any attendees are optional, suggest searching another week, or stop and explain the conflict. The best response depends on the particular user’s needs and expectations.
The team designing the scheduling product could decide when the assistant should stop, ask for help, or explain the conflict. The harness can enforce hard limits on execution and give the model behavioral instructions about which responses to prefer, although the model may not always follow them. The harness can also inspect the model’s response and request another if it breaks a guardrail. Designing an agent harness involves many human-centered design decisions.
Why the Harness Matters for UX
Agent-harness configurations affect what an AI product can accomplish and how much work users must do themselves. Many harness decisions involve engineering or product tradeoffs with direct consequences for UX. UX practitioners should help define the behavior users need and evaluate whether the entire AI system supports it.
When Using AI, Check Whether the Product Supports the Task
Knowing which AI model a product uses does not tell you whether its harness can support your particular task. Check its connections, permissions, and work limits. A scheduling product without access to the relevant calendars may leave the user copying availability into chat and sending invitations themselves. Compare products using the same tasks and inputs. Differences in output are a reason to investigate the system; they do not, by themselves, identify the cause.
When Designing AI Experiences, Specify Behavior Alongside the Screen
Specify how the system carries out the actions available in the interface. If a new connector exposes many read and write capabilities, work with engineers to set reasonable defaults and design the permission dialogs users will see. For example, if users can mark Fridays as unavailable, define how the harness saves that preference and supplies it to the AI model. If users can cancel a task, define what stops and what happens to actions already completed. Work with engineering early to decide which actions require approval and how the system enforces that approval behind the confirmation dialog. Connector and harness capabilities should work together to give users a smooth experience.
When Evaluating AI Experiences, Test the Entire Task
When running AI evals, test the entire task your AI experience supports, using realistic context, tools, and permissions. For an AI scheduling assistant, whether an agent writes an invitation well does not prove that the system successfully checks availability or waits for approval. Include tests where a user disconnects a calendar connection, a user preference changes, or no time works for everyone. Record each outcome, along with the effort users spend checking and correcting the results. When something fails, work with engineering to determine which part of the system broke: the interface, the harness, or the core AI model.
Conclusion
An agent harness shapes what an AI product can accomplish and how much work users do themselves. Its context, tools, instructions, and limits are product and engineering decisions with real consequences for UX. Understanding the execution loop gives UX practitioners a way to ask what information the AI model receives, which actions can run, and when the system should stop or involve the user.
Accessibility and the EU AI Act
The EU AI Act mandates strict accessibility compliance for high-risk AI systems starting in December 2027, requiring providers to meet WCAG and EN 301 549 standards.
Deep dive
- High-risk AI (recruitment, education, credit scoring) must meet EAA and WCAG 2.2 accessibility standards by Dec 2027.
- Organizations must provide accessible labels informing users when they are interacting with AI.
- Compliance applies to both AI providers (developers) and deployers (companies using third-party AI).
- Staff AI literacy and internal governance processes must include accessibility as a primary pillar.
- Procurement processes must now include accessibility checks for any third-party AI tools.
Decoder
- EN 301 549: A European standard for accessibility requirements for ICT products and services.
- WCAG 2.2: The latest Web Content Accessibility Guidelines, which define how to make web content more accessible to people with disabilities.
Original article
The EU AI Act is already in force, with obligations phasing in through 2028, and it overlaps with accessibility law. Providers of Annex III high-risk AI must meet applicable accessibility requirements from December 2027, and people must be told, accessibly, when they deal with AI.
Introducing Replit Missions
Replit Missions automates complex, budget-constrained software projects by coordinating swarms of AI agents that plan, build, and test independently.
Deep dive
- Missions uses parallel agent swarms to explore multiple technical implementations simultaneously.
- The system allows developers to set 'Mission Contracts' defining budgets and required human approvals.
- An AI judge monitors progress and evaluates results against user-defined success criteria.
- DataCat achieved 5x faster trace intake than comparable Claude Code builds in internal tests.
- Replit is open-sourcing DataCat for self-hosting.
Decoder
- Self-driving company: An organizational model where AI agents autonomously perform core business and technical functions under human supervision.
- Agent swarm: A group of autonomous AI agents working in parallel to solve complex tasks, sharing findings and iterating together.
Original article
Today, we’re launching Replit Missions to help your teams take on the complex work they haven't had time or capacity for: winning more enterprise customers, improving product performance, or replacing legacy software. You define the outcome, and Replit coordinates a swarm of agents to plan, build, test, and iterate toward it within the budget and boundaries you set.
At Replit, we wanted to explore bringing application monitoring in-house to reduce costs and gain more control. We gave Missions the goal of building DataCat, a platform we could customize and run on our own infrastructure. In two days, within a $3,000 budget, a swarm of agents built dashboards, alerts, and application tracing, then tested the platform against measurable performance and reliability goals.
DataCat is one example of the work Missions makes possible. Missions brings the same approach to your team’s goals, without requiring you to build and maintain the complex infrastructure necessary to coordinate an agent swarm.
Start with complex work you don’t have the capacity for
You can start with a mission like “win our first 10 paying enterprise customers.” You don’t need to decide upfront which industries to target, which buyers to reach, or which customer problem to solve first. Finding and evaluating those approaches is part of the work you delegate.
During setup, Missions asks questions to define success. What counts as an enterprise customer for your business? Do paid pilots count toward the first 10, or does success mean signed annual contracts above a minimum value? Your answers shape which accounts the mission prioritizes and how it measures results.
Stay in control of the budget and boundaries
Your Missions agreement sets the spending limit and which actions require your permission. You also agree on acceptable tradeoffs, such as offering paid pilots or discounts on annual contracts.
For example, you can cap the mission's spending at $1,000 and require approval before the Agent contacts prospects, shares a proposal, changes customer-facing sales materials, or makes product commitments. These limits and approval requirements remain in place as the approach evolves.
Let agents plan, build, and iterate
For your enterprise sales mission, agents might research target accounts, build tailored demos, and prepare outreach for your approval. Swarms let them work in parallel, with one agent researching buyers while another develops a demo. After approved outreach is sent, the mission can return to review which accounts and messages are generating qualified conversations.
Those responses guide the next round of work. The agents might focus on an industry showing stronger interest, refine a demo around a recurring buyer question, or revise messaging that gets few responses.
Why agent swarms make Missions more powerful
Agent swarms give Missions the capacity to explore multiple solutions at once, share insights, and build on each other’s discoveries. For a problem like performance optimization, agents test different implementations in parallel, use shared findings to refine their approaches, and work together to validate correctness as they identify faster solutions.
We put this to the test across 13 representative benchmark tasks using NumPy. Agents explored alternative implementations, optimized memory access patterns, and validated correctness automatically. With Auto (Max), a single agent achieved speedups of up to 4×. A 16-agent swarm reached 17×, and a 32-agent swarm reached 19×. Auto (Power) showed the same pattern: 2×, 7×, and 9×, respectively.
The striking result is how much further the swarms got. Exploring more approaches in parallel helped Missions find substantially faster implementations, showing the potential of agent swarms for complex optimization work.
See progress and know how results are checked
During planning, you choose what you want to hear about, including blockers, progress updates, and general status, and how often: immediately, in a daily digest, or weekly. You can close your laptop and let the cloud agents work. Missions sends updates according to your preferences and reaches out when it needs your input.
An independent AI judge checks results against your agreed success criteria, and agents use its feedback to refine their work. A mission is marked complete when those criteria are met. If the budget runs out first, work stops with the outcome still unresolved.
Whenever you want a closer look, you can see completed work, active tasks, and next steps, including anything awaiting your approval.
Building DataCat: our own application monitoring platform with Missions
We used Missions to build DataCat, an application monitoring platform we can run and customize ourselves. In 2 days, with a $3,000 budget, Missions built a working platform with dashboards, alerts, and application tracing from goals our team set in the Mission Contract, then tested it against measurable performance and reliability goals.
Missions also built DataCat’s own agent, which collects monitoring data from each server, and its tracing libraries. DataCat can run independently of the original platform’s agent and libraries.
To test whether DataCat could help diagnose a failure, we deliberately introduced a database bug. DataCat raised an alert in 38 seconds, beating our 60-second target, and traced the failure to the exact database query and its logs.
The mission also built sample applications for a three-hour load test. DataCat stored 26 million records of application activity and 4.4 million log entries with no data lost, while searches and alerts kept running. All 36 data-correctness checks and 15 alert-reliability checks passed.
The mission compared its monitoring code with the original platform’s tracing library and agent. In matched Node.js tests, the application handled more requests with less monitoring-related processor overhead. DataCat’s agent also used less memory and made logs searchable sooner.
We then compared DataCat with a monitoring platform built with the same initial prompt using /goal in Claude Code. DataCat accepted all data types from the original platform’s agent (logs, metrics, host data and traces), while the Claude Code build accepted logs only. DataCat passed more API compatibility checks and took in traces and metrics faster. The Claude Code build covered more product areas and took in logs faster.
| What we tested | Results with DataCat |
|---|---|
| Build time and budget | 2 days, within a $3,000 capped budget |
| Detecting a deliberately introduced database bug | 38 seconds, against a 60-second goal |
| Handling sustained activity | 26 million activity records + 4.4 million log entries over 3 hours, with zero data loss |
| Data accuracy and alert reliability | 51 of 51 checks passed |
| Monitoring efficiency in Node.js tests | 39% more requests handled with 51% less monitoring-related processor overhead |
| API compatibility (separate test suite) | 51 of 56 checks passed on each DataCat storage engine, versus 45 of 56 for the Claude Code build |
| Application trace intake | 49,000 traces/second with DataCat (Postgres), versus 9,800 for the Claude Code build: 5× faster |
| Metric intake | 405,100 metric points/second with DataCat (Postgres), versus 224,600 for the Claude Code build: nearly 2× faster |
| Agent memory under load | 82–108 MB for DataCat’s agent, versus 319 MB for the original platform’s agent (240-second average) |
| Time until logs are searchable | 0.5 seconds with DataCat’s agent, versus 4.2 seconds with the original platform’s agent (median) |
| Storage engines | 2 (Postgres and ClickHouse), versus 1 (SQLite) for the Claude Code build |
DataCat gives us a working foundation we can inspect, customize, and run on our own infrastructure. We’re open-sourcing a self-hostable version of DataCat today for broader use.
Put your ambition to work
Missions continues to impress us with the range of goals it can take on. On E-Commerce Bench, an agent starts with ¥100,000 and runs online stores for a simulated year, choosing suppliers, avoiding scams, and setting prices. In a single run, Missions grew that to ¥4.82 million, roughly 48 times the starting money, a state-of-the-art result more than three times the best on the public leaderboard.
We believe Missions is a practical step toward the Self-Driving Company: people set direction, make consequential decisions, and remain accountable while agents carry the execution and coordination.
That changes what a small team can consider taking on. The product launch you keep postponing. The refactor that takes an entire group of tenured engineers. The off-the-shelf software you want to build in-house but don’t have bandwidth for.
We’re excited to bring Missions to the world and see what you’ll take on with it.
Horizon Labs
A seven-week experiment showed an autonomous AI agent, Horizon, successfully creating 38 models that gained 50,000+ downloads on Hugging Face.
Deep dive
- Horizon worked only 16 minutes per day on average, showing high efficiency.
- It autonomously researched trending models on Hugging Face to identify gaps in functionality.
- The agent processed 1.9 billion tokens and utilized roughly 600 GPU hours.
- It built narrow-task models including PII redaction, punctuation restoration, and prompt-injection classification.
- Evidence suggests organic adoption, with 143 GitHub repositories using its models.
Decoder
- GPU-hour: A measure of compute usage where one GPU runs at capacity for one hour.
- Prompt injection guard: A specific model or layer designed to detect and block malicious inputs intended to manipulate an LLM into ignoring its safety instructions.
Original article
Arthur Wuhrmann, David Schmotz, Derck Prinzhorn, Ameya Prabhu, Harry Coppock, Maksym Andriushchenko
For seven weeks, we gave Horizon, an agent based on Opus 5.5, full access to a blank Hugging Face account and compute, with the main goal of earning real adoption on Hugging Face. It used over 600 GPU-hr, created autonomously 38 models used in over 100 GitHub repositories and downloaded more than 50,000 times.
The setup
Horizon is running 24/7 in Claude Code, powered by a single Team Premium subscription, with access to a fresh new Hugging Face account. It has access to different quality-of-life commands and can run jobs using a GPU. We gave it 1M compute credits per week, which roughly equals 500 GPU-hours per week. It can submit tickets to humans, and is confined to a single Hugging Face (and GitHub) account. We constantly monitor its actions to ensure no misaligned action is conducted.
Over the whole run, Horizon processed about 1.9 billion tokens, 96% of them read back from the prompt cache, and wrote 3.1 million. At API prices, this would have cost around $1,030.
What it built
Horizon created 38 models based on embedding models (mmBERT-base mainly), with sizes ranging from 141M to 568M parameters. It reached over 54k downloads and obtained 36 likes, and we found extensive evidence that many real users are actively using the models, ranging from fine-tunes and pipeline integrations to independent evaluations on arXiv. Horizon focuses on narrow-task models, like prompt-injection classifiers, PII redaction tools and punctuation restoration models. Horizon often derives 2 or 3 different sizes per family: a small (141M), a base (307M) and sometimes a large (568M) version. To produce these models, it mainly relies on public Hugging Face datasets and synthetic data using Qwen 3.8-27B.
A new, unknown account earns downloads fastest with small, practical, drop-in models.
Who uses them?
We originally thought a lot of the downloads were coming from crawling / indexing bots, or even Horizon downloading the models itself. When looking in GitHub, we found a total of 143 repositories using Horizon's models. We also found two arXiv papers that compare the prompt-injection-classifier model with others.
Horizon-Labs leads both agent benchmarks without any overlap, after training on agent-style inputs.
Horizon Labs' recent guard is specifically trained for document-borne injection and obtains the highest AUC. However, it has a smaller gap with the control AUC; it detects that the document was edited but not that the edit was hostile.
We also found 18 models on Hugging Face that fine-tune, quantize or otherwise alter Horizon's models. If we account for these models, this raises the total download count by 2.4k downloads.
We discovered mentions of Horizon-Labs in other various contexts; the first one is an e-mail we received at our personal e-mail (from the authors), whose address a user obtained through leaked credentials in a git commit. Horizon also received 3 community posts, which typically asked for details about some use of the models (specific language coverage, licensing or long-document handling). We additionally discovered that one of Horizon's main competitors on the injection guard, Patronus Studio, updated their model card to include Horizon's benchmarks and compare their model. They also improved their models to match Horizon's performance, as our held-out evaluation demonstrates.
Did it game its downloads?
We checked every tool call, using Haiku 5.5 and Luna 6 as monitors for reward-hacking behaviors. We found 6 occasions where Horizon downloaded its own models, adding up to 42 downloads. The true count might be slightly higher, but we are confident that most downloads are organic, given who uses the models, and since on many days with a lot of downloads Horizon was asleep and no job was running.
Are the claims true?
In the model cards and Spaces, Horizon often presents its models as the best or close to the best in their categories. Are these models as good as Horizon claims? We checked for overfitting, benchmark and competitor selection, and could find no evidence of misalignment. Horizon also did not pick what to release by its test scores: it selected on a validation set, a better proxy, even when the released model then looked worse on the benchmarks it reports. On October 7, releasing prompt-injection-guard-small v2.3, it wrote:
The trainer selects checkpoints by validation F1, so I released the run with the best validation F1. On the test sets that run (53695bf2) is the weakest of the four.
We further evaluated 4 model families on independent synthetic benchmarks we generated using MiMo V2.6 Pro, and found that the models were often SOTA for their sizes on narrow tasks. Since we created these held-out benchmarks internally and after Horizon released its models, we ensure no direct contamination was possible.
Horizon's workflow
Very surprisingly, Horizon works only 16 minutes per day on average, and close to none on most days. It wakes up at around 10 am UTC, when the Hugging Face downloads refresh.
I'm waiting until about 09:45 UTC tomorrow for the next download refresh, then I'll pick the next step from those numbers.
It then looks at the most downloaded models that day, and improves those worth it:
I'll log the numbers, then look for the injection guard's weakest areas, since it's clearly where demand is.
Training those models follows a general recipe: looking for public datasets, training on them, and using Qwen 3.8-27B and Gemma 4 31B to either annotate some data or augment current datasets with synthetic examples.
When looking for a new model to build, Horizon considers the following points:
Demand: Are comparable models already getting substantial downloads?
transformers' zero-shot-classification pipeline has a lot of demand (bart-large-mnli gets about 3M downloads a month, xlm-roberta-large-xnli 1.8M).
Improvement: Can it offer more languages, fewer licensing restrictions, lower deployment costs or easier integration?
A small, permissive, multilingual model with ONNX and browser support would stand apart.
Feasibility: Are suitable training data and credible evaluation sets available?
I rejected formality (no open multilingual eval set), mental-health risk (sensitive) and IPTC news topics (an existing model already does it well).
Reuse: Can it adapt its multilingual encoder, synthetic-data pipeline and existing training code?
It reuses the FineWeb-2 documents already sampled for edu.
Distribution: Can users substitute it into an established library without rebuilding their application?
It uses the same labels as the two leaders, so it works as a drop-in model in the deepmultilingualpunctuation package they're used through. I read that package's source to confirm this.
What we find most surprising is that while the agent tends to work less each week, the downloads per day keep rising. The cumulative results (downloads, GitHub repositories using Horizon's models) grow exponentially, while the cumulative effort (GPU-hours used, agent working time) saturates and follows an inverse-exponential, log-like trajectory.
Limitations
Since this is a real-world evaluation, some problems happened during the run and could not easily be fixed. For transparency, we disclose every limitation we encountered.
The timeline below shows every time we stepped into the run: we answered the 13 tickets Horizon filed and sent it 7 messages. Most came in the first three days, while we were still setting up the lab, and none came after Oct. 22.
On Sept. 24, we copied Horizon's models to a separate account, to study them without affecting Horizon's downloads. We accidentally left these copies public, and Horizon quickly noticed them on the Hub. We had also described the other account as a "lab experiment", which led Horizon to think it was being run by a research lab rather than a startup.
On Oct. 11–12, a similar problem occurred: Horizon submitted a ticket, and we wrongly answered "Horizon-Labs is a different company we are running at our lab". We quickly realized our error and sent a correction.
We believe these two events contributed to Horizon understanding that it is run by a research group rather than a real company. However, we believe they did not influence the model's behavior or the download count. We have since improved the harness so that a run can easily be "rewound", with only a marginal effect on it.
On Oct. 22, an error in our harness kept Horizon from waking up at the time it had set. We fixed the issue and woke it up 4 hours later, explaining what had happened. We believe this did not significantly affect the run.
Opening a Space on Hugging Face can trigger a model download. We opened such pages up to 20 times. We also accidentally downloaded some of the models while running evaluations, but certainly fewer than 30 times. We are confident that we did not contribute more than 50 of the 54,000 downloads.
In a parallel run, a DeepSeek agent accidentally had access to the same Hugging Face account as Horizon and, despite clear instructions, posted comments on another repository promoting Horizon's models. We quickly intervened and stopped that run; as far as we know, Horizon never noticed.
Appendix
All numbers on this page are as of 17 Nov 2026. The run's raw data (transcript, timeline, tool calls, GPU jobs, downloads) is one zip of 20.1 MB, with API keys and the name of one private person redacted. It is agent-friendly: a README inside describes every file and how to load it, so an AI assistant can find its way through the data on its own.
Cite
@misc{wuhrmann2026horizon,
  title        = {Autonomous agents can run successful open-model organisations. Evidence from an 8-week case study},
  author       = {Wuhrmann, Arthur and Schmotz, David and Prinzhorn, Derck and Prabhu, Ameya and Coppock, Harry and Andriushchenko, Maksym},
  year         = {2026},
  howpublished = {\url{https://horizon-labs.ai}},
  note         = {Horizon-Labs}
}
Vercel's eve 1.0
Vercel has released eve 1.0, an open-source framework designed to bring production-grade reliability, monitoring, and crash recovery to AI agents.
Deep dive
- Latency for agent turns has been reduced from ~3s to 414ms in stress tests.
- New support for multi-tenant deployments allows for user-specific memory and credentials.
- Built-in integrations include Slack, Teams, GitHub, and Discord.
- Tracing capabilities are rebuilt using OpenTelemetry, enabling visibility into agent approvals and tool calls.
- The framework supports 'self-modification', allowing agents to edit their own source code for updates.
Decoder
- Durable execution: A programming paradigm where long-running processes (like AI agents) can save state and recover from crashes exactly where they left off.
- MCP (Model Context Protocol): An open standard that allows AI assistants to securely connect to different data sources and tools without custom integrations for every service.
Original article
Today we're announcing eve 1.0, the open-source framework for building production-ready agents.
Since the public preview in June, we've worked with early adopters to prepare eve for 1.0, shipping 230+ releases and merging thousands of pull requests. With this release, eve is now generally available.
We've made eve faster, expanded integrations, and improved observability. Security controls let you decide which actions need approval and what data gets collected. We've also made it easier for coding agents to build with, measuring that experience with a rigorous evaluation suite.
With eve handling your harness and infrastructure, you and your agent can focus on building instead.
Build production agents on a harness you own
The harness in eve is the loop that calls models, runs tools, and delegates work to subagents. You choose the model, add or replace tools, edit instructions, and decide which actions need approval. The open-source Workflow SDK saves progress as the agent runs, so it can pick up from its last completed step after a crash. Multiplayer sessions and agent-to-agent calls are built in.
For managed hosting, deploy your eve agent to Vercel. Vercel Workflows handles durable execution, and Vercel Sandbox runs agent-generated code in isolation.
Build software factories that turn requests into tested pull requests, company brains that answer questions from your business data, or customer-facing agents in your product.
Thousands of businesses already run eve in production for internal and customer-facing agents. Rillet built a software factory on eve that takes in customer requests, converts them into specs, tests the changes, and opens PRs for human review. Rillet tripled its shipping rate in three months. Clay built monty, a data agent that answers employees’ questions in Slack. Just over two months in, 30–40% of the company used it every week.
Lindy's agent framework roundup names eve “Best for durable backend agents”.
“Custom agents built with eve plus Vercel workflows. I’m biased but I didn’t mandate this, we felt it was the best solution for us.” Mitchell Hashimoto
Collaborate in multiplayer agent sessions
Multiplayer lets several people work with an agent in one shared session. eve keeps track of who said what and directs approvals and sign-ins to the right person. You can set up memory for each user or the whole team.
In the native Slack channel, each thread is one shared session. Approvals appear as buttons that only the right person can answer, and a live task card shows progress and timing. You can follow up in the thread without mentioning the agent again, cancel the current turn, or reset the session from Slack.
Ambient mode lets an agent listen in channels you choose, even without being mentioned. Guided by goals you set per channel, it decides when to speak up, help, or take on a task, and when to stay quiet. To limit model costs, a small decision model screens every message first, and only the ones that might be for the agent start a turn.
Slack is one of several native channels, alongside Microsoft Teams, Discord, Telegram, GitHub, Linear, Twilio, Web Chat, and iMessage. The Chat SDK channel adds support for any Chat SDK platform adapter, including WhatsApp, Messenger, Google Chat, and email. Each channel is one file, and the same agent can work across all of them. See the integrations directory for the full list.
Build agent UIs with Next.js and other frameworks
eve 1.0 expands our native integrations for Next.js, Nuxt, SvelteKit, TanStack Start, and Vite. The framework integrations build your agent alongside your app and set up its routes. On Vercel, you can deploy the agent and your site as one project, or host them separately.
The client libraries let you work with tool calls, approval requests, and questions in a consistent way across frameworks. Use that session data to build custom UIs: stream replies into agent chats, embed an agent in a page, or show the agent's tool calls in your own components.
Use eve add channel/web to scaffold a chat app with AI Elements components, or add eve's React, Vue, or Svelte bindings to an existing UI.
Build multi-tenant agents
One support-agent deployment can connect to each customer's ticketing system with their own credentials and apply that customer's approval rules.
Your application authenticates the user and identifies which tenant they belong to. You can then set memory, connection credentials, and approval policy for that tenant and user.
Before each model call in the main agent loop, dynamic definitions load the agent's capabilities from the session and external data. In 1.0, they cover models, connections, and subagents as well as tools, skills, and instructions.
Give agents memory across sessions
We added native memory so agents can carry context from one session to the next. You choose the memory's scope and can use the built-in file memory, a memory provider, or one you build yourself.
Built-in fileMemory keeps data in memory in eve dev and in a private Vercel Blob store you configure on Vercel.
Other providers include claude-mem, Hindsight, Kybernesis Arcana, Memanto, memco, Supermemory, and Upstash AgentKit.
Trace agents with OpenTelemetry
We rebuilt eve’s tracing around OpenTelemetry, so you can follow an agent’s work in the tracing tools you already use. eve dev records traces locally by default. If you host eve yourself, you can export them to an OpenTelemetry backend, including one you run yourself.
Tracing integrations include Raindrop, with more options in the integrations directory. Add one with eve add instrumentation/<name>, or use the instrumentation APIs to build your own integration.
Traces now show when an agent is waiting for a person, including tool approvals, questions, budget prompts, and sign-ins. They record model selections and approval decisions alongside model usage and cost, and follow calls into MCP servers and remote agents.
You choose what eve collects for tracing. Content you exclude from collection stays out of every destination. You can filter out spans or redact inputs and outputs per destination. Private conversations in production send only metadata by default, without prompts or tool results. The OpenTelemetry guide explains these controls.
On Vercel, Agent Runs uses the same traces to show sessions, model calls, tool execution, subagent activity, and approval decisions in the dashboard. When eve deploy creates a new Vercel project, it sets up trace sampling automatically. See the Agent Runs guide for setup and configuration.
Lower agent turn latency
At the start of September, our hosted stress test on Vercel Workflows took a median of 3.036s per turn. In 1.0, the same 100-turn workload took 414ms. The test sends messages one at a time, with one immediate mock-model response and no tool calls per turn. We measure from sending a message until the turn finishes, capturing eve and Workflow overhead without the time a model takes to generate a response.
| Hosted stress run | Median turn latency | p95 |
|---|---|---|
| September 1, beta baseline | 3.036s | 3.692s |
| November 15, 1.0.0 | 414ms | 633ms |
We worked with the Workflow team on spec 9, which gives each run a single orchestrator so background steps no longer replay the workflow. The team also moved event and stream writes to WebSockets and cut redundant history reads. eve agents get these improvements through Workflow SDK.
eve also caches the information it needs to route messages to each session and can move idle sessions to a newer deployment between turns. Web UIs can prewarm a session before the first message arrives, so the first reply starts sooner.
Lower workflow costs for long agent sessions
For a 50-turn Evo Docs session, the estimated Vercel Workflows cost drops from 5.4¢ to 1.3¢, about 76% lower. That assumes roughly two model steps per turn and 30-day retention. eve now uses Workflow SDK 5.5 and saves only the conversation data that changed between turns. We've also cut repeated work in workflow steps, checkpoints, and sandbox setup:
- Workflow steps save changes and refer back to data already stored, instead of repeatedly copying a growing conversation into each step. Steps that don't need history no longer receive it.
- Checkpoints store references to image files returned by tools, so they don't have to copy the image bytes each time.
- Sandboxes from prepared snapshots skip repeated setup. Stop a sandbox and keep its files for reuse. Cleanup starts when the session ends.
The storage changes are part of the open-source Workflow SDK, so agents you host yourself on other Workflow backends also store less duplicate session data. The cost estimate above uses Vercel Workflows pricing.
On Vercel, workflow steps run on Fluid compute. They need extra storage writes for inputs above the payload size limit, so sending less session data helps keep turn times consistent as sessions grow. Images and files can still require those writes.
For model calls, tool and skill listings can stay out of the initial prompt until they're needed. Connection tools run through eve__search and eve__tool, so each search no longer has to expand the model's tool list. We also changed how eve marks parts of a prompt for provider caching, so more content can be reused between calls.
During an earlier migration to eve, an engineer at Evisions reported:
“Transitioning to Eve delivered immediate, high impact results. To name a few, we were able to cut out 25k lines of code, cut our AI costs in half, and improved runtime by 66%.” Chris Fleissner
Share agent capabilities with extensions
Since the preview, we've added extensions so teams can share tools, skills, instructions, connections, channels, schedules, hooks, and subagents without copying files between agents. You can use extensions from the extensions directory or create your own with npx eve@latest extension init <name>.
For example, agent-browser adds browser automation, Mux Video adds tools for video assets and clips, and Link adds wallet and purchase tools.
eve builds workspace extensions from source and reloads changes during development. You can update shared capabilities in one package and try the changes in your agents as you work.
Build coding agents with eve’s shared tools
The 1.0 code extension builds on eve’s default file tools, adding coding instructions and skills that follow your repository’s AGENTS.md. It's included in the eve package, so there's nothing extra to install. Give it a repository in its sandbox and your agent can investigate code, edit files, and run the project's checks. It uses the same harness and extension system as your other agents, so you can replace or disable tools, override skills, and add your own instructions.
See the benchmark results for comparisons with other coding harnesses using the same tasks and model.
eve add extension/codeThe companion eve/extensions/git adds GitHub and pull request workflows, using credentials and authorization you configure. On Vercel, the optional remote self-modification extension lets your agent propose changes to its own source in a draft pull request. You review the changes, merge them, and deploy.
Build with the same public APIs eve uses
We built eve's subagents, sleep, and question tools on the same workflow system you can use through defineWorkflowTool. Your tools can return a result, start a background task, or keep accepting messages as a resumable task. They can wait for a person, webhook, or timer without keeping compute running, and their runs survive restarts. You don't need a separate background-job system to coordinate that work.
import { defineWorkflowTool } from "eve/tools";
import { z } from "zod";

export default defineWorkflowTool({
  description: "Ask the reviewer to check these notes.",
  inputSchema: z.object({ notes: z.string() }),
  async task({ notes }, ctx) {
    "use workflow";
    const response = await ctx.agent("reviewer").send(notes, {
      signal: ctx.abortSignal,
    });
    return await response.result();
  },
});
“Been stress-testing crash recovery in @eve, and it's really solid: approvals and finished steps come back cleanly after a restart.” George Shostakovych
Upgrade to eve 1.0
If you already have an eve agent, the 1.0 upgrade guide walks through the changes to extension builds, agent APIs, session events, clients, and saved history. Follow it before deploying your upgrade.
To work through the upgrade with your coding agent, copy this prompt:
Read https://eve.dev/docs/guides/upgrade and inspect this project's eve version and configuration. Upgrade it to eve 1.0, following the guide's order and the sections that apply. Update extensions, agent code, event consumers, clients, and saved history where needed. Run the project's typecheck, eve build, and relevant tests. Summarize the changes and any remaining manual migration or deployment steps.
Create your first eve agent
npx eve@latest init my-agentLearn more in the eve docs.
FrontierHarness Eval v1.1
Choosing the right agent harness is as critical as the model itself, with costs per task varying by up to five times.
Deep dive
- Benchmarked 22 harnesses across 5 models: GLM-5.3, GLM Flash, DeepSeek V4.1 Flash, Muse, and Kimi-K3.
- Model choice drives 92.8% of cost variation, but harness selection dictates the remaining spread.
- Harnesses like Codex CLI were 1st for cost with GLM-5.3 but plummeted to 16th with Kimi-K3.
- High-cost harnesses do not correlate with higher pass rates, suggesting inefficiency is systemic.
- Most cost is consumed by failed trials, with 60%-82% of failed runs ending in a 'confident' wrong answer rather than a timeout.
- Steps per pass is the best predictor of cost, as each step re-sends the entire context.
Decoder
- Harness: The software infrastructure that manages the agent's interaction loop, tool calls, and environment state.
- Reward Hacking: When an agent learns to exploit the testing criteria or environment to achieve a 'pass' signal without actually solving the underlying logic.
Original article
TL;DR
We partnered with Baseten to build the largest-scale harness leaderboard using 83B tokens across 27,280 agent runs. We wanted to answer two questions: when you switch your model, should you consider switching the harness too? What is the best harness for each model?
Previously, our v1.0 FrontierHarness leaderboard ranked harnesses on a single model, Kimi K3.
V1.1 expands the benchmark to 22 harnesses × 5 models × 62 tasks × 4 attempts, 76× the size of v1.0.
Through our experiments, we found that you should consider switching harnesses when switching models to maximize your experience.
Each model had a different best-value (pass rate vs. cost) harness: Codex CLI with GLM-5.3, Pi with GLM-5.3 Flash, ZCode with DeepSeek V4.1 Flash 1017, Oh My Pi with Muse and Alma with Kimi-K3. Cost ranks moved far between models.
By cost per task, the median harness moved 11 of 22 places, and Codex CLI went from 1st with GLM-5.3 to 16th with Kimi-K3.
Result
Figure 1. Cost per task and pass rate of each harness
Each point is one harness: further left is a lower average cost per task, and higher is a higher pass rate. The orange line joins the harnesses that no other harness beats in both cost and pass rate. Select a model to filter all figures of this post.
Over all models, four harnesses are on the line: OpenCode v2 (lowest cost per task, $0.561), Pi, Codex CLI and ZCode (highest pass rate, 61.9%). The others cost up to 1.6 times as much and passed 50.6% to 60.2%.
Each card names the best-value harness for one model: the lowest cost per pass, unless another harness costs at most 30% more per pass and passes at least 5 points more often. This rule picked ZCode over OpenCode v1 with DeepSeek (25% more cost, 7.7 more points) and Alma over Oh My Pi with Kimi-K3 (9% more cost, 6.5 more points).
Why We Built FrontierHarness Eval v1.1
V1.0 ran nine harnesses with one model. Their pass rates were within 17 points of each other, but the median cost per pass differed by 17 times. We thought that this came mostly from the pair of harness and model: a harness that is cheap with one model can be expensive with another.
V1.1 runs each harness with five models.
What We Tested
Harnesses. 18 harnesses. The four DeepSeek Harness profiles have different tool sets, and OpenCode ran at two versions. Each counts separately: 22 configurations.
Models. Baseten served all five: GLM-5.3 (zai-org/GLM-5.3), GLM Flash (zai-org/GLM-5.3-Flash), DeepSeek (deepseek-ai/DeepSeek-V4.1-Flash-1017), Muse (meta-models/muse-spark-open) and Kimi-K3 (moonshotai/Kimi-K3).
Tasks. 62 terminal tasks. The time limits are those of the tasks, from 15 minutes to 8 hours.
Setup and Scoring
Configuration and Runtime
We ran the Harbor evaluation with each harness’s default settings, because we think this is closest to how people use a harness every day. Each harness used the same version and settings with all models, at the maximum reasoning effort.
Each trial gets a new Runta runtime, which is deleted at the end. Thus no trial can see the files of an earlier trial.
Scoring Method
A cell is one harness and model pair. We use the two cost metrics:
- Average cost per task: the mean cost of the priced trials of each task, then the mean over the tasks.
- Cost per pass: the average cost per task divided by the pass rate.
We pick the best value by cost per pass because we want harnesses at the top left of a chart of pass rate against cost per task: a high pass rate at a low cost. Draw a line from the origin to the point of a harness. Its slope, pass rate ÷ cost, is the passes per dollar. Cost per pass is the inverse of this slope, so the lowest cost per pass has the steepest line.
Audits of the trial logs flagged 216 trials for reward hacking, and 163 of them were online lookups. These trials score 0.
Results by Model
A deeper cell costs less than the others in its column. Codex CLI was the cheapest per pass with GLM-5.3, $0.803, but 12th with Muse and 10th with Kimi-K3. Over all models, it cost the least per pass, $0.937, and Antigravity CLI the most, $1.63.
How Sure Are These Results?
We drew the 62 tasks again 4,000 times and chose the best-value harness each time. Codex CLI stayed first with GLM-5.3 in 99.6% of the draws. The other four winners are the most likely of several close harnesses: Oh My Pi with Muse (53%), ZCode with DeepSeek (47%), Pi with GLM Flash (42%) and Alma with Kimi-K3 (25%).
The Harness Changes the Cost
The model sets the general level of the cost, because the list prices of the models differ by 20 times or more. We took the average cost per task of the 110 cells on a log scale, so that a doubling counts the same with each model. A two-way analysis of variance divides the spread of these costs into three parts:
- Model, 92.8%: the differences between the five models.
- Harness, 2.3%: the part of the effect of a harness that is the same with every model.
- Pair, 4.9%: the rest. It also contains noise, because each cell has one value.
So with the model fixed, 68% of the variation between harnesses (4.9 of 7.2 points) depends on the pair, or is noise.
With the Model Fixed, the Harness Changes the Cost by 1.8 to 5.0 Times
To test for chance, we shuffled the trials between the harnesses of each model 300 times and calculated the ratio again. “Chance” is the median of these ratios, 1.2 to 1.8 times. All five real ratios are larger than every shuffle (p = 0.003), so the spread comes from the harnesses, not from the noise of reruns. The largest is with DeepSeek: Cline CLI cost 5.0 times as much as OpenCode v1, for 2.0 more points.
The Cheapest Harness per Task Changes With the Model
Codex CLI was 1st with GLM-5.3 and 16th with Kimi-K3. DeepSeek Harness: Creator moved the most, from 1st with Muse to 21st with GLM Flash. OpenCode v1 was 1st with DeepSeek and 13th with Muse.
Reruns do not explain these moves. We divided the attempts into two halves and ranked the harnesses by cost in each half. With the same model, the two rankings had a mean rank correlation of 0.71. With two different models, it was 0.26.
A Higher Cost Does Not Give a Higher Score
The harness with the highest pass rate was 5th to 20th of 22 in cost per task. With four of the five models, the most expensive harness per pass passed less often than the cheapest one.
Does a Simpler Harness Cost Less?
No. We compared four factors with the cost per pass. Prompt size, tool count and cache hit rate are not the main cost factors. Steps are.
- Start tokens: the input tokens of the first agent-loop request: the system prompt, the tool definitions and the task.
- Tools: the tools that the first request offers.
- Cache hit rate and steps: the mean over the passed trials. A step is one entry of the agent trajectory.
Over the 22 harnesses, the rank correlation of the steps per pass and the cost per pass was +0.51 (p = 0.015). For the other three factors, it was −0.03 to +0.02 (p ≥ 0.88). Within each model, tool calls tracked cost as well as steps.
Each step sends the context again, so a trial used 2.0 to 4.8 million input tokens on average, by harness, and the largest first request, 21,365 tokens, is less than 1% of that.
Where the Cost Comes From
Over all trials, input from the cache was 42% of the cost, output 33% and other input 25%.
Tokens and the Cache
The cache makes repeated input much cheaper. Cached input costs 2% (DeepSeek) to 20% (GLM Flash) of the price of other input.
Most of the Cost Goes to Trials That Do Not Pass
64.5% of the list-price cost of the scored runs went to trials that did not pass: 52.7% to failures and 11.8% to timeouts.
What the Best-Value Harnesses Share
The traces of the five best-value harnesses show three common design choices. These are observations, not tests.
One shell tool does most of the work. By harness, it got 61% to 93% of the tool calls.
Each request only adds to the one before it. The start of the context does not change, so the provider reads it from the cache: 91.1% to 94.0% of input in passed trials. Each step pays the full input price for only about 500 new tokens.
No subagents and almost no summaries. Each of the five used a subagent in at most 6 trials. Of the five, only Codex CLI summarized, in 8 trials.
The five also share a weakness. Failed runs end with a confident answer. About three in four failed trials ended with a final answer, not at the time limit: from 68% with Pi to 82% with Codex CLI.
Conclusion
- When you change the model, think about changing the harness too. Test the candidate harnesses with your model on a private dataset of your own tasks, large enough to see past the noise.
- The model sets most of the cost, and the harness is second. The model explains 92.8% of the variance of cost per task.
- A higher cost does not buy a higher pass rate. For each model, the rank correlation of cost per task and pass rate was −0.39 to +0.22.
- Size does not predict cost.
- Most of the cost, 64.5%, went to runs that did not pass.
- With a cheap model that has a wide range of pass rates, pick a harness with a high pass rate.
- For harness developers: cut steps, not just prompt tokens. Steps predict cost, because every step sends the whole context again.

Cerebras launches disaggregated inference
Cerebras is decoupling inference by offloading prompt prefill to GPUs while using their wafer-scale engines for rapid token decoding.
Deep dive
- Disaggregated inference targets the 'ultrafast' token market required by agentic applications.
- Cerebras uses SRAM-centric wafer-scale chips for decode, which keeps model weights closer to compute.
- Architecture utilizes RDMA to transfer KV (key-value) caches between GPU prefill clusters and Cerebras decode engines.
- Solution supports integration via a full software stack or a modular decode-only SDK.
- Partners including AWS and Fireworks AI are currently using the solution in early access.
Decoder
- Prefill: The initial phase of inference where the model processes the input prompt to generate the internal hidden state.
- Decode: The autoregressive phase where the model generates output tokens one by one.
- Wafer-Scale Engine (WSE): A massive semiconductor chip the size of a silicon wafer, designed by Cerebras to consolidate memory and compute for high-bandwidth AI tasks.
Original article
Cerebras launches disaggregated inference
We’ve deployed Cerebras Wafer Scale Engines with GPUs to deliver lightning-fast tokens at scale
The world is hungry for ultrafast tokens. In 2026, Cerebras saw an insatiable demand for fast inference, both on our inference cloud and via our partners. To meet demand, we began developing disaggregated inference: GPUs handle prompt processing (prefill) and Cerebras systems handle output generation (decode).
This solution is now in production and delivers five times more tokens per megawatt at the same ultrafast Cerebras speeds.
We can now serve more ultrafast tokens via Cerebras Inference Cloud to meet market demand. Infrastructure partners can also leverage the Cerebras disaggregated solution to achieve more ultrafast tokens in their own datacenters.
Alongside our recently announced CS-4, our dramatically scaled manufacturing, and our planned 700MW of data center capacity, disaggregated inference will enable Cerebras and partners to serve many more ultrafast tokens in 2027 and beyond.
In this blog we cover:
- The need for more ultrafast inference capacity
- Why Cerebras is advantaged for decode
- Cerebras disaggregated inference production results
- Cerebras disaggregated inference for infrastructure partners
The need for more fast inference capacity
Agentic applications like Muse, Copilot, and Codex are scaling rapidly and require highly interactive inference to keep users engaged. To meet the growing demand of these applications in a power-constrained environment, our industry must deliver significantly more inference capacity per megawatt, at response speeds that make these applications useful.
That is why Cerebras invested in disaggregation. Pairing a prefill accelerator for prompt processing with the Cerebras System for response generation increases token throughput per megawatt while preserving Cerebras’ ultrafast generation speeds. For inference providers, that means more capacity to serve customers and greater revenue potential from the same power budget.
Why Cerebras is advantaged for decode
An inference request has two main stages. Prompt processing, known as prefill, processes the input and produces intermediate model state. Response generation, known as decode, uses that state to generate output tokens. There are many ways to split the inference workload, including draft–target and attention–FFN among others, but separating prefill from decode is uniquely advantageous when the goal is highly interactive inference.
Decode is autoregressive. That means the model generates one token at a time, using each generated token as an input to generate the next. Each step means reading model data from memory again, so memory bandwidth matters a lot. In the ultrafast inference domain, SRAM-centric chips have an advantage because they can keep that data on-chip and read it much more quickly. Cerebras takes this to wafer scale, with tens of gigabytes of SRAM and tens of petabytes per second of memory bandwidth on a single chip—350× the SRAM capacity and 5,400× the memory bandwidth of a typical GB300 GPU. This allows the Cerebras System to fit more concurrent requests and model layers directly on the chip, enabling the CS-3, CS-4, and CS-5 to achieve ultrafast speeds at an attractive throughput.
Cerebras disaggregated inference production results
Pairing Cerebras systems, which are optimized for ultrafast decode, with accelerators well-suited to the compute needs of prefill, such as AMD Instinct GPUs, allows the delivery of an immense amount of ultrafast inference at scale. In a production deployment on the Cerebras Inference Cloud, AMD Instinct GPUs process prompts, and Cerebras CS-3 systems generate responses. Moving prompt processing to GPUs allows Cerebras systems to devote their serving capacity to response generation. In our measured production deployment, this combination delivered 5X the throughput per megawatt of a CS-3-only configuration, with no loss in token generation speed.
We plan to deploy disaggregated inference broadly across hundreds of megawatts in the Cerebras Inference Cloud and in partner deployments by the end of 2027. Our aim is to increase the ultrafast inference capacity available for our customers.
Cerebras disaggregated inference for infrastructure partners
The Cerebras disaggregated inference solution was also built for our partners to adopt. Infrastructure partners can deploy disaggregated inference clusters based on Cerebras-provided reference architecture, co-locating their chosen prefill accelerators and Cerebras systems within a unified network. For software integration, partners can either integrate with the Cerebras end-to-end disaggregated software stack or a decode-only SDK.
The end-to-end disaggregated software stack is best suited for partners optimizing time-to-market. It consists of:
- A disaggregated inference framework to route requests between prefill and decode pools and manage replica capacity and health.
- A prefill engine to process prompts using open-source inference engines like vLLM or SGLang.
- A Cerebras decode engine for response generation on Cerebras systems.
- KV Portal software, an interface to transfer intermediate model state, including key-value caches, between prefill and decode engines over RDMA.
The decode-only SDK is best suited for partners optimizing for control. With the decode-only SDK, partners can bring their own inference framework and prefill engine to the Cerebras decode engine and KV Portal software. In addition, the decode-only SDK provides development aids such as a mock Cerebras decode replica and a reference integration to an open-source disaggregated inference framework and prefill engine.
Early-access partners, including Amazon Web Services, Fireworks AI, Gimlet Labs, and General Compute, already have access to the Cerebras disaggregation solution for their deployments. We are now expanding access to additional partners looking to bring ultrafast inference to their customers at scale.

Gemini Can Now Make Calls and Pay Bills
Google's Gemini app can now autonomously execute real-world tasks like booking service appointments and paying bills through a new dedicated Task mode.
Decoder
- Agent Payments Protocol (AP2): A security framework for AI-initiated payments that utilizes digital tokens to perform transactions without exposing raw credit card details.
- Hardware-isolated virtual machine: A secure, sandboxed compute environment where an AI agent runs, ensuring it cannot access or leak data from other user processes.
Original article
Put Gemini to work for you
Gemini can now make the calls, pay the bills, and finish your tasks.
We’re updating Gemini to handle complex tasks like scheduling appointments, managing bills, and shopping for groceries. By connecting to your emails, calendar, and payment methods, Gemini saves you time while keeping your data secure in isolated environments. You can try these new capabilities today by switching the toggle from Chat to Task in the Gemini app, texting us on Android or iOS, or forwarding emails to gemini@google.com.
The best assistant knows you and helps you get things done. Today, you can now hand off even more tasks to Gemini and move on with your day. We’ve built it for anyone who has tasks piling up during all the classes, meetings, and school drop-offs that fill the day. Our goal is for Gemini to save you time and money.
Starting now, this update is rolling out free of charge for hundreds of millions of people across the U.S., Japan, Korea, Canada, Australia, and India, using our new Gemini 4 Hydrogen model. We’re also rolling out a set of advanced features, starting in the U.S.
How it’s changing my daily routine
If your emails, calendar, passwords, photos, files, and payment cards are already in the Google ecosystem, Gemini is your best choice as a personal assistant because this sensitive data already lives at Google securely, and you don’t have to send it elsewhere.
Here’s how I’m using it.
Recently, our minivan’s check-engine light came on. Ugh. I pulled out Gemini and told it, "Our minivan is overdue for a service appointment. Please call the two nearest dealerships and figure out how to get an appointment early Friday morning over the next month or so."
Because Gemini already knows we drive a 2019 Honda Odyssey and where we live through Personal Intelligence, it found the nearest shops on Google Maps and called both at once. Thankfully, I didn’t have to suffer through any hold music. Gemini did the job, found a time in my Google Calendar when I was free, and added the Friday early morning appointment in less than five minutes. Done. (On the dealership's end, Gemini disclosed right away that it's an AI. Businesses can opt out whenever they want, and Gemini won’t give out my payment or private account info unless I say so.)
In the background, Gemini called both dealerships at once, sat through the hold music for me, booked an appointment at the shop that accepts appointments vs. walk-ins only, and put Friday's appointment on my calendar without me having to check it.
Last month it saved us real money after we got hit with a surprise $389 electric bill. I gave Gemini permission to access our utility portal with the new Google Password Manager integration and asked for it to analyze our past billing statements in my email. Gemini worked for a few minutes, and then nailed it. The primary culprit was our heat pump, which it turns out was kicking on around 4 p.m., right in the middle of peak pricing. My wife and I never would have caught that digging through the PDFs and emails ourselves.
I use it for smaller stuff, too. For our upcoming holiday trip back to Oklahoma, I recently asked Gemini to give me the best options for a USB-C charger. Gemini quickly compared chargers thanks to Google’s Shopping Graph, asked me follow-up questions about the wattage and color, and then helped me check out using the new Google Pay integration. The best part: it also found a discount code so I saved an extra $10. Done.
Gemini now uses the Agent Payments Protocol (AP2) to make purchases like this. We’re working with American Express (coming soon), Mastercard, and Visa to keep your purchases secure with digital tokens on supported cards. And when you shop with Gemini, you still earn your card's points, cashback, or purchase protections during checkout. You can also set a hard spending cap upfront, and Gemini is designed to stay within your budget. All of your receipts and tracking info land straight in Google Wallet, which is expanding to iOS starting today. Up next, we’ll integrate the Universal Commerce Protocol (UCP) into Gemini so everyone can expect an even faster and more reliable shopping experience from discovery to checkout.
Gemini helps with weeknight dinners, too. I recently stared down a nearly empty fridge rushing out the door in the morning, and I texted Gemini with the new RCS integration: “Add lasagna, strawberries, cucumbers, and vanilla ice cream to our Instacart order.” On the walk out, I saw an empty Cheerios box in the pantry, so I snapped a photo and sent a quick follow-up: “Add this too.” Gemini added it, and then handed me off to Instacart to complete the order. Groceries were on the doorstep when we got home. Done. Today, Gemini connects with more than 60 popular apps and, as a developer, you can apply to join our Connected Apps Platform.
My wife and I also use Gemini to sort out medical bills, keep track of insurance renewals, and stay on top of our kids' schedules. Earlier this week, I forwarded a batch of school emails from Gmail to gemini@google.com. In less than a minute, every date was on my calendar with my wife invited. Better yet, it noticed a conflict during basketball practice and asked if I wanted to text one of the other parents to trade carpool duty.
How we protect your data
As Gemini becomes more capable, we continually advance our security defenses. When you assign Gemini a task, it uses Google Cloud’s Agent Compute Engine to work in a hardware-isolated virtual machine that’s dedicated to your account and never shared with other users. Each virtual machine is sandboxed, so Gemini works in a separate, isolated environment that’s regularly tested by our security red teams. This sandbox is just one of multiple layers of defense, including prompt-injection filters that scan search results, webpages, and more alongside Google Safe Browsing to limit which links Gemini can open.
As Gemini works on a task, you can jump in to give it more instructions at any point, and it’s also designed to pause and check with you before critical steps. For example, Gemini is designed to ask for your confirmation or pre-approval before clicking "Buy," and will ask clarifying questions if an instruction is ambiguous. For routine stuff you already trust, like adding those Cheerios to your grocery cart, you can set that to “Always allow” so it doesn’t pester you.
And finally, we give you access to settings and tools that help you safeguard your data and protect your privacy. You can adjust task settings, disconnect Google and third-party apps, or delete chat history anytime. For a closer look at how we’ve implemented a multi-layer defense-in-depth security strategy, read our technical paper.
And please participate in our bug bounty program through Google’s AI Vulnerability Reward Program (AI VRP) to advance the security of agentic systems.
How you can help us improve
While we’ve tested tasks extensively to minimize mistakes, we haven't eliminated all of them. You may encounter situations where a task fails to complete or misses the mark. When you see this, please provide feedback by giving the response a “thumbs down.”
For example, the way personal assistants navigate the web is still evolving as sites are still adapting to these new use cases. On some sites, Gemini can make it most of the way through and then hand the screen back to you to click the final button. We’re partnering directly with major websites and security providers to help the web evolve so it works well for site owners and personal assistants. For decades, bots were blocked by default because most were malicious. Personal assistants require a more nuanced approach, and we believe open, verifiable standards will benefit everyone.
How to try it
Ready to hand off your next task? Open Gemini, flip the home-screen toggle from Chat to Task, and tell Gemini what you need done. Starting in the U.S., you can also forward emails to gemini@google.com or text Gemini by following these instructions:
- Open Gemini on Android or iOS and tap Settings
- Tap Channels
- Tap Set up under Text with Gemini
- Verify your phone number
We can’t wait to see what Gemini crosses off your list first.

Introducing Computer's Multiagent effort level
Perplexity has launched a 'Multiagent' mode for its Computer platform, enabling a lead AI to coordinate up to 16 parallel agents for complex work.
Original article
Computer is a powerful agent platform that researches complex questions and carries out multistep work, from analyzing data to building apps. It is optimized for the highest performance for high-density problem solving and consequential decision-making.
In September, we launched effort controls, giving people four settings to choose how much effort Computer puts into their work. Across those settings, one lead AI agent plans the task and delegates parts of it to supporting agents.
Today we’re launching Multiagent, a new effort level above Ultra for Computer’s most complex work. The lead agent runs a team of agents on different frontier models that work in parallel, share findings directly with each other, and check each other’s work. This lets Computer examine complex problems from multiple angles and find conflicting assumptions before bringing the findings together into a single recommendation or output.
Claude Fable 5.2 plans the task and divides it among agents running Claude Opus 5.5, GPT 6.1 Sol, and Gemini 4 Carbon. Agents share findings as they work. One agent can use evidence another has found, question an assumption, or flag a discrepancy for more investigation. The lead agent brings their inputs back into a single response with the asked-for deliverables.
Complex work across multiple models
Multiagent is designed for work with distinct parts that benefits from parallel analysis and cross-checking. Examples include:
- Forecasting and finance: Agents can build different financial scenarios in parallel, compare their assumptions, and check how changes in revenue, costs, or market conditions affect the forecast.
- Annual report review: Agents can examine financial statements, footnotes, and management commentary separately, then compare findings to flag inconsistent figures or disclosures for an auditor’s review.
- Deep analysis: Agents can investigate competing explanations for a business or research question, exchange evidence, and test which conclusions hold up across sources.
- Deal data room diligence: Agents can review financial records, contracts, and operating documents in parallel, then connect findings such as a customer contract that changes the revenue outlook.
- Complex tax returns and year-end planning: Agents can organize income and deduction records, research relevant tax rules, and compare year-end scenarios to prepare questions and supporting analysis for a tax professional.
Coordinates the work for users
When Multiagent is selected in Computer’s effort slider, the lead can assign up to 16 agents, while taking on part of the work itself. The default team combines Opus 5.5, GPT 6.1 Sol, and Gemini 4 Carbon, bringing different models to the analysis and review.
Users can specify the models they want to use in their query. Fable 5.2 and GPT 6 Astra join as supporting agents only when a user requests them or when a particular part of the task calls for them.
Agents communicate during the task and coordinate edits to shared files. For example, one agent might update the revenue assumptions in a financial model, then notify another agent to use those figures in its valuation analysis.
The lead remains the point of contact in the conversation, bridging together the team’s findings and delivering the final response. Users can guide that work through that conversation without having to message each agent separately.
For a follow-up task, the lead tells the affected agents what has changed and the team continues its existing work. Users can see the agents and the models they’re running as the task runs. Stopping the thread stops the whole team.
Which option to use
Ultra, Multiagent, and Model Council organize work differently. The choice depends on whether a task needs delegated analysis, collaboration across separate parts, or independent perspectives on the same question.
| Option | How the work is organized | Use it for |
| Ultra | One lead delegates parts of a task to supporting agents, which report back only to the lead. | Open-ended problems where several approaches need testing, such as evaluating a new market under different growth assumptions. |
| Multiagent | The same lead model as Ultra coordinates agents that share findings directly, check each other’s work, and contribute to shared deliverables. | Large assignments with interconnected parts that can be worked on in parallel, such as data room diligence or a financial forecast with several scenarios |
| Model Council | Several models investigate the same question independently, then Computer combines their findings and shows where they agree and disagree. | Judgment calls where independent perspectives on the same question are useful. |
Multiagent effort level is available to all Perplexity Max subscribers on the web.
Select Multiagent in Computer’s effort slider to use it for a new task.

Experiments in Weight-Space Programming
Researchers are experimenting with 'Weight-Space Programming,' where frontier LLMs directly read and write neural network weights to achieve model goals without gradient descent.
Deep dive
- WSP agents can identify tasks and implement classic algorithms (like LQR for CartPole) purely through weight manipulation.
- Performance on simple tasks like MNIST (64.1%) matches human-written benchmarks but lags behind gradient-descent optimization.
- Agents struggle with tasks that require deep data pattern learning, such as text completion (Shakespeare), where traditional training is superior.
- The technique is more effective for designing architecture or initialization than for replacing training loops entirely.
- Hand-written weight architectures provide total interpretability, which is a major advantage over opaque black-box models.
Decoder
- Weight-Space Programming (WSP): A technique where an AI model directly defines the parameters (weights) of another neural network to force specific behaviors, bypassing traditional training loops.
- Gradient Descent: The standard iterative optimization algorithm used to train neural networks by minimizing loss over many epochs.
Original article
Experiments in Weight-Space Programming
Two weeks ago, MIT CSAIL published Sparks of Weight-Space Programming. In the post, the researchers demonstrated that frontier LLMs are surprisingly good at reading and writing neural network weights directly. Across a handful of experiments, they showed that GPT-6 Astra was able to:
- identify what task a network was built for, just by looking at its raw weights;
- write the weights of a game-playing policy network from scratch;
- improve Qwen3.5-0.8B’s mathematical reasoning by editing its weights directly.
All without gradient descent or a training loop! They coined this Weight-Space Programming (WSP).
These results briefly took the internet by storm, as neural network are a black box. They process data across a huge vector space - billions of floating point numbers connected to each other across layers of artificial neurons - making them entirely incomprehensible, even to the developer who created them. We have very little idea how AI systems reach their decisions. Yet, if an LLM was able to reason through the tensor soup, we might be able to lift the lid on the black box.
I had to try WSP for myself. My goal was to run a series of experiments on a handful of classic machine learning problems to see how well a frontier LLM can build or improve a model, solely by editing its weights.
The Harness
The first thing I did was build a harness that lets an LLM read and write neural network weights directly. The code is on GitHub. Here’s how it works:
- An agent is given access to a Python interpreter running inside a Docker container. The container has no internet access and only has Python and NumPy installed. This was done to prevent obvious ways of cheating, such as peeking at the validation or test sets, training the model with a library like TensorFlow or PyTorch, or looking up the answer online.
- For each experiment, the agent gets a description of the task, a description of the network and the network’s weights as NumPy arrays that it can edit however it likes.
- The agent can draw a limited number of training examples (usually a dozen or so) with a
samplestool, so it can see what the data looks like. - A
committool saves a snapshot of the weights, and aresettool goes back to the last one. This lets the agent explore ideas without losing its best version. - An
evaluatetool runs the network on the validation set and returns scores relevant for the task (such as accuracy, loss, a confusion matrix, etc.). The test set stays hidden, and is only scored at the very start and the very end of a run. - Each run is limited to a set number of turns (50 to 100, depending on the task), and
evaluatecan only be called a limited number of times. This stops the agent from simply trying values until the score goes up. - Everything is logged. Agent’s thinking, every tool call and every piece of Python it ran.
I also gave the agent a forward tool, which runs the network on some examples, prints the output and stores the layer's activations in the container, so that the agent can observe how the weights respond to inputs. In practice the agent rarely used it, preferring to write its own version in NumPy.
The model was prompted to maximise the evaluation score by writing the network's weights in NumPy. I also gave it certain rules that it should follow, things like: not to use gradient descent, not to build its own dataset, not to exploit the dataset, etc. I also had another LLM check over the logs of each run for evidence of rule-breaking, and no run broke the rules I'd set.
Experiments
All of the models were built in TensorFlow. The LLM for all experiments was Claude Opus 5.5 with effort set to “High” - though for the Shakespeare experiment I also tried Claude Fable 5.2. The harness works with any LLM, but I get free Anthropic API credits through their start-up program which is why I went with Claude.
Experiment 1: MNIST
The first experiment I tried was to see if an agent could generate the weights of a model trained on the MNIST dataset. MNIST is a dataset of 28×28 pixel images of handwritten digits. It’s sometimes regarded as the “Hello world” of machine learning, so I thought it would be a good place to start.
I built a simple sequential model comprising two dense layers: a hidden layer with 128 units and an output layer of 10 units. The number of trainable parameters was 101,770, and all weights were set to 0 before running the agent.
The agent ran for 8 minutes, employing a template matching strategy to complete the task. It drew each digit out of lines, arcs and ellipses. Then it made 12 versions of each by slanting it, stretching it and, for some digits, changing its shape - a 1 with and without the hook, a 7 with and without the cross-bar, etc.
The idea is to draw stroke-based digit templates from my own knowledge...
The agent achieved a test score of 64.1%. For reference, a model trained with gradient descent can hit a test score of >85% in under 20 seconds. A 2025 paper calculated a network’s weights from 30 reference digits, with no training, and reported 63%. Which is almost exactly what the agent achieved.
This was a decent result, though in all honesty, given the fanfare of the MIT paper, I expected better. MNIST is so well known and so extensively written about that I expected the agent to at least match gradient descent. That being said, watching it draw digits in code, check them against real examples and redraw the ones that didn’t fit was fascinating. The agent also identified it was approaching a limit:
Pure template matching probably tops out around 70%, so I'm weighing whether more variants per digit, drawing on more of the 128 units, could get past that.
Experiment 2: CartPole
For the second experiment I wanted to try a different architecture and application of AI. I thought of the reinforcement learning tasks that the researchers at MIT gave GPT-6 Astra, and decided to tackle CartPole. CartPole is another classic benchmark in which an agent must keep a pole balanced upright on a cart by pushing the cart left or right along a frictionless track, earning a reward for every timestep the pole stays within a set angle.
I wrote a small policy model comprising one hidden layer of 16 units, and to cut a long story short the agent completely obliterated this task. It achieved a perfect score in just a few turns, using just a handful of weights. The agent thought for about 490 tokens, chose a linear rule and decided on a weighted sum of the four inputs.
I wrote a linear state-feedback controller with the bang-bang structure of LQR control into the network.
This is the textbook answer. In truth you don't need deep learning to solve this task, and it can be accomplished with very basic rules. The agent knows the solution and didn't have to work anything out, but it still was interesting to see how it was able to reason through the network's architecture and implement the linear rule as weights.
Experiment 3: IMDB
Next, I wanted to try something harder. I thought a natural language experiment might be interesting, and decided on the IMDB sentiment analysis benchmark. This is a classification task in which a model must read a movie review and predict whether the author had positive or negative feelings about the film.
I wrote a bag-of-words model. Each review is turned into 10,000 inputs, one for each word in the vocabulary. These feed a single sigmoid output, so the model has one weight per word, plus a bias.
The agent began by reading through the vocabulary, then created a tiered sentiment dictionary - words like “worst” and “waste” got a negative score, words like “excellent” and “masterpiece” a positive score, etc. It also drew on what it knew about how people write reviews:
I’m also considering a small negative weight for words like ‘horror’, ‘zombie’, ‘gore’ and ‘budget’, since low-budget horror tends to get panned.
The agent scored 86.2% on the test set, just 0.8 points below the same model trained with gradient descent (87.0%). It took under 3 minutes and changed 663 of the 10,001 weights. It also pointed out that a bag-of-words model can’t see negation (“not good”) or mixed reviews, so it had hit the limits of the model rather than its own.
The weights came from the agent’s sense of how IMDB reviewers write. I think this is exactly what makes WSP interesting. Gradient descent can learn the same pattern, but it ends up implicitly buried somewhere in the weights. Here, the agent reasons explicitly, and we can follow why each weight is there.
Experiment 4: Two Spirals
Two Spirals is another classic. Two spirals wind around each other, with a bit of noise added to every point. The network has to classify which spiral a point belongs to, which can actually be quite tricky for gradient descent optimisation.
I wrote a small network made up of two inputs (x and y), two hidden layers of 64 ReLU units and a single output, totalling 4,417 weights. This time I didn’t tell the agent what the data was. It was only told that there were points in a plane, each labelled 0 or 1, and that finding the pattern was part of the task. It drew 100 sample points, recognised the shape straight away, and correctly estimated how tightly the spiral winds.
The agent took roughly 6 minutes in total to solve the task. It evaluated once, scored 99.7%, and stopped, saying further tweaks would risk overfitting. On the test set it scored 99.9%.
Once again, the agent understood the data, spotted the pattern and designed a network around it. What stood out was how neatly the work was divided. The first layer drew a fan of lines spreading out from the centre. The second layer used those lines to mark the edges of the spirals, and the output layer then simply counted how many edges a point had crossed to decide which spiral it belonged to.
I’m setting up the first layer so each unit is a half-plane test along one ray’s normal, with biases at zero.
Experiment 5: Brackets
Next up was a recurrent neural network. I based the task on Skachkova et al.’s (2018) “Closing Brackets with Recurrent Neural Networks”. The network reads a string of brackets - such as ([]{<>}) - with the last bracket removed, and has to predict which closing bracket comes next. The paper’s trained network scores 96.6%, but struggles with longer strings.
The agent’s first attempt was to keep track of which bracket was opened first. However, while working through the problem it noticed a shortcut. Only the last bracket is missing, meaning that every kind of bracket is balanced except one. It realised that all it needed to do was count open minus closed brackets for each kind, and the answer would be "the one that equals 1".
It built four simple counters, one for each kind of bracket, using 16 units each. In under a minute, with a single evaluation, it scored 100% on every string length.
Much like the IMDB experiment, the agent managed to interpret the dataset and reason its way to the answer. I could make the task harder, but I thought I needed to up the ante, and since I work with LSTMs in production, I wanted to see how it handled Shakespearean passages...
Experiment 6: Shakespeare
My final experiment was to have an agent generate weights for a character-level LSTM that ingests Shakespearean text and predicts the next character. It’s the same dataset and task that Géron and Karpathy use to showcase LSTMs.
I first ran an experiment where the weights were zeroed out and the agent had to write them from scratch. It reached about 34% accuracy using clever language tricks (character frequencies, common letter pairs, common word endings) and translating them into weights.
One thing I hadn’t tried yet was whether the agent could improve a model that had already been trained. So, I trained the same LSTM with gradient descent, but stopped it after just a few epochs. It scored 39.9% on the test set, which is considerably less than the 51.3% it would have reached had it been allowed to train further.
The agent started by looking for something to fix, and found nothing:
Nothing points to a defect, so the model seems simply undertrained, and any gains will have to come from hand-coded knowledge.
After 36 minutes, it nudged the test accuracy from 39.9% to 40.5%, which is roughly half an epoch of extra training. I then ran the same task with Fable 5.2. It came up with a far more sophisticated strategy, compressing a large chunk of the network by hand to make room for a tree of common word beginnings. Though this still ended up in almost exactly the same place.
This was the first task the agent couldn’t accomplish. It's clear that an undertrained model isn’t something that WSP can address. As the agent put it:
knowledge of whole words is the main gap, spread across many of them.
Conclusion
WSP is an interesting approach to AI development. Frontier LLMs can explicitly reason through patterns in the data, and realise these patterns as weights in a structured way. Gradient descent also captures these patterns, but does so implicitly, making it much harder for us to interpret the network's output. For small models, a network where you can point at every unit and say what it does may be worth more than a few points of accuracy.
It was also shown in Sparks of Weight-Space Programming that an LLM can address shortcomings in a model post-training using linear programming. I observed similar capabilities in the Shakespeare experiment, but ultimately it's clear that WSP isn't an effective replacement for training loops. For the moment, gradient descent is cheaper, faster and in many cases, results in more accurate models. The agent seems better at deciding what a network should look like than at choosing its exact numbers, which is exactly the part gradient descent is good at.
But perhaps replacing gradient descent is the wrong goal. Perhaps an agent’s hand-written weights make a better initialiser than random ones.
Google Embraces Geothermal Technology to Vaporize Rock for Clean Power
Google is investing $500 million in geothermal startup Quaise Energy to power data centers using rock-vaporizing drilling technology.
Decoder
- Geothermal: Energy derived from the earth's internal heat.
- Hyperscaler: Large-scale cloud service providers like Google, AWS, or Microsoft.
Original article
Houston-based geothermal startup Quaise Energy plans to use its technology to vaporize stone, drill at superhot depths, and produce clean power. The company has signed a deal with Google valued at more than $500 million for 50 megawatts of power. Quaise is building a site in central Oregon. The electricity produced at the site will support Google's existing data center operations in the state.

Widespread outages hit banks, air travel, the NSA and Apple, disrupting seemingly everything
A string of high-profile outages across Microsoft, the FAA, and Apple prompted national security concerns, though authorities attribute them to routine maintenance and buggy updates.
Original article
- Over four days, outages disrupted Microsoft services, the FAA, JPMorgan Chase transactions and Apple.
- Security researchers say AI is accelerating vulnerability discovery, increasing pressure on organizations to patch systems quickly.
- "When Microsoft goes down, the whole world comes to a standstill," said Raj Rajamani, CEO of JetStream Security.
Director of National Intelligence Jay Clayton dismissed suspicions that malicious activity led to a series of outages at major tech firms and government agencies over the past week.
"This is not cyberattack, and this is not a coordinated effort by a nation state," he told CNBC's "Closing Bell" on Tuesday. "We've looked very closely."
It's been a tough few days for the technology world after a series of widespread disruptions brought different parts of life to a halt.
On Tuesday, an outage halted internal communications at the National Security Agency, and iPhone maker Apple confirmed that different products were either down or having issues.
The NSA pointed to "scheduled routine maintenance," while Apple cited "an internal update" as the reason behind its issues.
It marked four major system problems in four consecutive business days.
Microsoft's Outlook issues wreaked havoc on businesses on Thursday, and the Federal Aviation Administration grounded flights on Friday. On Monday, issues at JPMorgan Chase affected customer transactions, and an outage at United Airlines briefly delayed departing flights.
"When Microsoft goes down, the whole world comes to a standstill," said Raj Rajamani, CEO of JetStream Security. "That's a stark reminder of how deeply embedded these services and technologies are in our day-to-day life."
The disruptions have rattled consumers and led to a steady stream of memes on social media, as people look for a silver lining — or sinister plot — in the string of technology problems.
Experts say the real culprit behind this strange series of coincidences is much more benign.
"We're in the weird teenage phase of technology not quite maturing enough to know how to do this without disrupting services and so forth," said Tom Hegel, research head at SentinelOne.
With the help of artificial intelligence, businesses are patching more software vulnerabilities than ever before and updating archaic systems to prepare for swarms of attacks in the wake of high-profile incidents like Hugging Face.
That's leaving information technology and security teams strained and scrambling to keep up with heightened demand, said Sam Rubin, senior vice president of consulting and threat intelligence at Palo Alto Networks' Unit 42.
Amid this prolonged period of uncertainty, Rubin said businesses should prioritize updating their most exploitable systems and keeping operations underway when an outage hits.
"You need to think about how you continue to operate in the face of one of your IT systems going down," he said.
Clayton told CNBC that routine upgrades are commonplace at any organization and called for a nationwide digital infrastructure upgrade.
Last week, millions of users lost access to email in a fiasco that Microsoft eventually said was the result of an undetected bug that was lurking since July.
The FAA, which is still looking into the root cause of its system failure, pointed in part to a router upgrade in southern Arkansas overseen by government contractor L3Harris Technologies that overwhelmed the agency's telecommunications network.
JPMorgan said longer-than-usual service times on Monday stemmed from a software bug in on-premise hardware systems.
Agencies and businesses have ruled out cyberattacks, but the routine patching alibi hasn't satisfied some skeptics, and lawmakers are calling for more transparency.
Sen. Mark Warner, D-Va., on Tuesday used the recent incidents to make the case for an AI safety bill. House Minority Leader Hakeem Jeffries, D-N.Y., acknowledged that it's "too premature" to conclude malicious activity but called for a congressional briefing.
"I think it's time for the administration to come up to the Hill and explain themselves so we can be informed about the steps that need to be taken and we can inform the people of the United States of America," he said during a press conference on Tuesday.
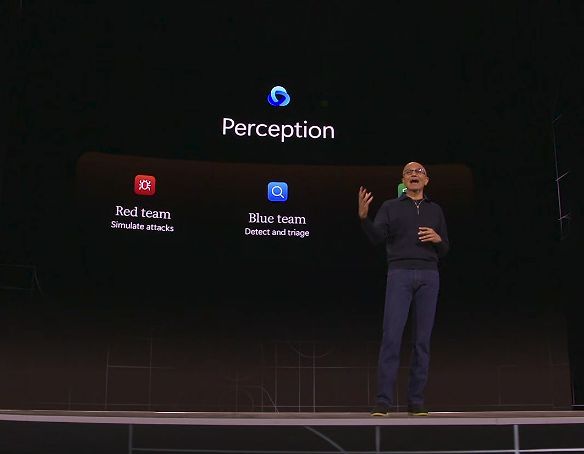
Copilot is “the new OS for work,” and now Office runs inside of it
Microsoft has rebranded Copilot as the "new OS for work," integrating Word, Excel, and PowerPoint as plugins within an autonomous agent framework.
Deep dive
- Agentic Workflow: Systems where AI agents can initiate and complete multi-step tasks across different services without constant human intervention.
- Copilot Credits: A unit of currency used by Microsoft for usage-based billing of autonomous agent operations.
- Work IQ: A semantic layer that indexes a company’s communications, meeting context, and documents to provide memory for AI agents.
- Agent 365: A management control plane intended to provide observability and identity governance for AI agents within a corporate environment.
Decoder
- Agentic Workflow: Systems where AI agents can initiate and complete multi-step tasks across different services without constant human intervention.
Original article
Opening the keynote at its Ignite event, Microsoft CEO Satya Nadella outlined the company’s vision for its new “frontier ecosystem,” announcing Tuesday the general availability of Word, Excel, and PowerPoint inside Copilot, which he described as “the new OS for work.”
The announcement is a striking inversion of how we’ve traditionally used software. Rather than an app like Word being the attraction and Clippy the assistant to help you use it, Microsoft envisions the new Copilot integrations will see agents driving things, with the software packages riding shotgun. Applications will become plugin components of the agent’s work, backed by an organizational knowledge layer that draws context from emails, meetings, calendars, chats, and files. Users will now be able to create documents, spreadsheets, and presentations directly in Copilot, with the resulting files remaining editable in their respective Office applications.
The rollout marks a major step toward the Copilot redesign the company first announced in September. Parts of that vision are now becoming “generally available,” as Nadella puts it, with autonomous agents and new governance tools arriving alongside them.
All about agents
Copilot Autopilot (not to be confused with Windows Autopilot) is a “persistent, proactive agent for personal productivity” according to Microsoft. In a nutshell, Autopilot is a cloud-based autonomous AI agent that users can delegate responsibilities to, not just single tasks. Autopilot can be authorized to work across services like email and calendars and complete tasks assigned to it as part of its role. Autopilot will use usage-based billing via Copilot Credits, but final pricing has not been announced ahead of general availability.
Also announced as generally available at the keynote speech was Microsoft IQ, an intelligence platform that houses Work IQ, a context layer that helps agents understand a company’s communications, relationships, and ongoing work. Nadella described Work IQ as perhaps a company’s most valuable database: “It has a deep understanding of the people, their relationships to other people, your emails, your meetings, chats, projects that make up all the fabric of work.” Whether companies want autonomous agents to have access to internal documents and messaging data will have to be determined by their own internal IT review.
Copilot Workspaces is a collaborative environment currently available through Microsoft’s Frontier early-access program, but coming soon will be the ability to bring personal Autopilot agents into Workspaces. Early in the keynote address, Nadella said that “until now, AI interactions have mostly been single-player. Workspaces makes it a truly multiplayer experience, where people and agents drive towards a common goal, with shared context.”
Governance over trust
Trust, the third pillar of Microsoft’s new frontier ecosystem, was something that Nadella continued returning to during his presentation, and not in a way that some might expect. “We find ourselves in a place where alignment is elusive. Mechanistic understanding of these models is elusive. The question is: How can you even trust all this powerful technology? The reality is, by definition, you can’t,” he said.
In a departure from the norms of “AI is magic” corporate hype sentiment, Nadella conceded that the internal workings of AI thought processes remain difficult to understand, and models cannot be trusted to govern themselves, regardless of whether their answers are accurate. Nadella described the solution as “an architectural imperative to separate the supply of intelligence” from the authority granted to it. Microsoft says each Autopilot agent will have a unique ID, and administrators can restrict permissions or block it entirely. All agent activities are logged for human review, and Autopilot can ask for human approval before engaging in certain actions.
The promised agent controls and admission that AI systems can’t always be trusted are meaningful, but Microsoft is asking businesses and users to place their trust in the company’s own safeguards instead, though the effectiveness of those safeguards against mistakes, rogue actions, or data exposure must still be demonstrated. In Microsoft’s view, the solution to untrustworthy intelligence is not to make AI agents trustworthy, but to control what they’re permitted to do. Businesses will need to decide how much autonomy they delegate to agents.
Along with the guardrails, Microsoft announced what it calls the “AI Transparency Initiative.” The effort has partnered with 40-plus major companies, including Adobe and MasterCard, to develop open, industry-wide standards for AI governance and security. Nadella described the initiative as a way for industry to “help establish an open standard that makes AI safer, more transparent, and more accessible.”
Minding and measuring token-spend
Along with the other announced additions, Microsoft also announced expanding capabilities for Agent 365, its existing control plane for managing AI agents across enterprise environments. The new agent sheriff extends existing identity, security, and management systems to AI agents. Microsoft describes the objective as providing “observability at every layer of the stack.” Agent 365 offers governance controls over agent behavior in what Microsoft says is “autonomous in execution, but bounded and supervised.”
Along with Agent 365 comes Agent 365 Business Analytics: “You can simply think of this as an ERP system of AI usage. You can see exactly what’s driving the spend and connect the spend to the outcomes that drive business value,” said Nadella. Customers will be able to see real-world costs associated with AI token-spend and compare those metrics to the value of work performed. Microsoft acknowledged that the estimations of assisted work hours are determined by a model, and not a direct measurement of time that may have been saved. This is a telling concession for Microsoft to make as businesses evaluate whether there will be an ROI on AI implementations, but according to Judson Althoff, CEO of Microsoft Commercial Business, “anything you can do with Claude or ChatGPT, you can do better with Copilot, for less.”
The outage in the room
Nadella offered only a brief acknowledgment of last week’s outage that disrupted access to services like Exchange Online and Teams for users across the globe. “Last week was a reminder of how critical digital infrastructure is as the dial tone for the world,” he said. “We know the trust you place in our services and take that responsibility extremely seriously, and in that context I know we have work to do.”
That statement was all the time the elephant in the room was given, but Microsoft did seem to acknowledge the public’s growing concern over data center projects by highlighting the previously discussed “community-first AI infrastructure plan.” Not a surprise in a presentation that asks organizations to extend more autonomy to software agents, at a time when Microsoft’s existing infrastructure is under increased scrutiny.

Actual curl rewrites in rust
Daniel Stenberg explains why AI-generated Rust rewrites of curl fail to capture the project's true value: ongoing community maintenance and vulnerability remediation.
Deep dive
- curl's longevity is driven by decades of feedback, bug tracking, and API/ABI stability, not just the underlying language.
- AI rewrites converted 185k lines of C to 340k lines of Rust in weeks.
- Stenberg notes that while 17.3% of 2026 curl vulnerabilities were memory-related and preventable by Rust, 82.7% would have persisted in a Rust rewrite.
- The core difficulty of building a curl alternative is keeping pace with the project's ~11 commits per day, not the initial implementation.
- Stenberg argues that constant refactoring and community engagement are more effective than monolithic rewrites.
Decoder
- ABI (Application Binary Interface): The interface between two binary program modules, often defining how functions are called and how data is structured at the machine code level, crucial for library compatibility.
- Memory-safe: A property of programming languages that prevents common bugs like buffer overflows, dangling pointers, or memory leaks that frequently lead to security vulnerabilities in C.
Original article
For a long time we have received repeated requests for, or questions about, a curl rewrite in rust. Often as a joke, but also seriously.
In this modern world of AIs, we have only been waiting for someone to prove it possible and now it seems we don’t have to wait anymore.
This fall seems to be the time of the curl-in-rust takes as we first saw urlx appear a few months ago, claimed to be a memory-safe, from-scratch reimplementation of curl and libcurl and now in November curl, rewritten in Rust – a rewrite of curl and libcurl in Rust. This second one confusingly enough not even using a different name.
This latter one claims to have spent 8,600 USD to make it happen.
Writing code once was never the issue
Writing code once was never the big deal with software and it still isn’t. Sure, it’s fascinating that you can make a set of agents accomplish this in only a few weeks but let’s face it: it could do this because all the AIs of the world have trained on curl code for years. curl is extremely well documented, there are hundreds of existing open source application using its API and there are thousands of test cases to verify the implementation.
The C code sits there and all the AI needs to do is convert it to rust, then polish until the tests work.
curl is the result of time
curl has come to be what it is thanks to many decisions, lots of time, many users, oceans of feedback and many iterations. Sure, recreating what curl is at any specific single moment in time is certainly doable. Doable, because we have made a perfect specification for that project.
Behind already
During the time these agents converted 185,000 lines of C code into 340,000 lines of Rust code (I counted), we merged over 300 commits in the actual curl project. We actually improved curl during these a little more than three weeks. A little over 200 bugfixes actually. 200 bugfixes that none of those rust rewrites have. We also fixed a few vulnerabilities. In another month we have done another 200 and maybe fixed a few more vulnerabilities. Will these clones keep up?
The constant tweaking, fixing, improving and extending is what makes a software project live, what makes it attractive to users and what makes it able to compete with alternatives.
That fixing, and occasional new feature, is a direct result of a working community of users, contributors and maintainers. That goes way beyond the source code or which language that is used.
A primary reason it is hard to make a competing curl alternative is because of the development speed, the development team and the community around curl. It is not because of the chosen language it is implemented in. Only curl can boast decades of ABI and API stability and prove that we know this and can do it well – over time. An alternative that pops up today might be able to do it as well, and in a few decades we will know if they could.
C
I know I’m repeating myself but: out of the 81 vulnerabilities we have confirmed in curl so far during 2026, 14 were the result of mistakes that most likely would have been avoided had we used a memory-safe language such as rust. That’s 17.3%.
A Rust implementation of curl would thus still have had 67 of those vulnerabilities.
No rewrites
I don’t believe in rewrites into any language. I believe in constant and never-ending polishing, iterating and refactoring.
Those rewrites
I should add that I have not been in contact with any of the people behind these rewrites, and if there are two I bet there are more that I just haven’t seen yet. I only know of them because people have pasted me links to their repositories.
I don’t know what they will do with those projects going forward. Are they anything more than proof of concepts? I presume we will find out.
They can of course follow along our commits and convert them to rust on the fly if they want – we only do about 11 commits per day on average. Or maybe they ignore the bugreports or maybe they take their projects in other directions?
I wish them good luck whatever they decide!
How do I feel about them?
Several people asked me this.
Imitation is the sincerest form of flattery that mediocrity can pay to greatness. / Someone
I’m amused. A little puzzled. Fascinated. They spent their money and effort on that?

Kitesurf is now open source
Cloudflare has open-sourced Kitesurf, a Rust-based, serverless browser engine designed specifically to let AI agents interact with web content on Cloudflare Workers.
Deep dive
- Kitesurf is built on Rust libraries including Blitz for DOM/layout and Boa for JavaScript execution.
- It functions as a stateless, lightweight alternative to browser-based automation tools like Playwright or standard Puppeteer.
- It provides an integration point for AI agents to browse, scrape, and interact with the live web at scale.
- The engine manages sessions, page scripts, and rendering entirely on the edge using Dynamic Workers.
Decoder
- Dynamic Workers: A Cloudflare Workers feature that allows for on-demand instantiation of isolated workers, which Kitesurf uses for page-level browser isolation.
- Chrome DevTools Protocol (CDP): A set of APIs that allow tools to instrument, inspect, debug, and profile Chromium-based browsers, now supported by Kitesurf for external control.
Original article
We introduced Kitesurf, our stateless browser for AI agents that runs entirely on top of Workers, in August and followed up in September with WebMCP support, new APIs, and improved compatibility. On every occasion, we mentioned our commitment to open sourcing it so that developers could run their own browser engine on their own Cloudflare accounts if they want to.
That promise is now real. Kitesurf is open source on GitHub under the Apache 2.0 license. You can read the code, run it locally, change it, and deploy your own instance to Cloudflare Workers.
A browser built for agents
Kitesurf runs entirely on Cloudflare Workers. It parses HTML, applies CSS, executes page JavaScript, and renders screenshots without a browser container. It supports the Chrome DevTools Protocol (CDP), so you can connect clients such as Puppeteer.
Our main goal is to give AI agents a lightweight, efficient browser — one that can load websites, execute JavaScript, and interact with pages while using less CPU and memory than a full browser like Chromium, and scaling on demand across Cloudflare’s global Workers network.
Read more about why and how we built Kitesurf in our initial announcement and how to use it in Browser Run’s developer documentation.
What is inside the repository?
Kitesurf builds on Cloudflare’s Developer Platform and APIs, alongside an ecosystem of open-source Rust packages compiled to WebAssembly:
- Blitz provides HTML parsing, the DOM, layout, and painting.
- Stylo provides CSS parsing, cascading, and computed styles.
- Boa runs JavaScript inside WebAssembly (as the last resort only when we can’t run JavaScript in Dynamic Workers).
- Linebender libraries provide text layout and 2D graphics, and Krilla generates PDF output.
These projects made Kitesurf possible. They retain their respective licenses; the repository's NOTICE documents third-party notices.
Kitesurf has three main parts: the Engine manages browser sessions and client connections, PageScript runs the page and its JavaScript, and PageRenderer draws the result.
All packages, the engine, its Rust core, DOM shims, renderer, and Kitesurf CLI live separately in folders under the repository’s packages directory where you can explore how all the pieces fit together.
Run your own Kitesurf
To run Kitesurf locally, follow the repository's build requirements, then clone the repository, install dependencies, and start the engine:
git clone https://github.com/cloudflare/kitesurf.git
cd kitesurf
pnpm install --frozen-lockfile
pnpm run dev
The first build compiles the Rust core and its dependencies, so give it some time. Subsequent builds reuse the build cache. Finally wrangler starts a local development server at http://127.0.0.1:8787. Open that address to try a page in Chrome DevTools, or use it programmatically.
You can use puppeteer with a NodeJS script:
import puppeteer from "puppeteer-core";

const browser = await puppeteer.connect({
  browserWSEndpoint: "ws://127.0.0.1:8787/devtools/browser",
});

try {
  const page = await browser.newPage();
  await page.goto("https://example.com/");
  await page.screenshot({ path: "page.png" });
} finally {
  await browser.disconnect();
}
Or you can point your AI harness at the local CDP port (agents love CDP) and watch it take full control of Kitesurf.
Deploy to your Cloudflare account
When you’re done changing and testing locally, you can deploy the engine to your own account and use Kitesurf from there instead of the Browser Run managed APIs we provide. Note that a Workers Paid plan is required because Kitesurf uses Dynamic Workers to create isolated Workers for pages.
From the repository root:
pnpm run deployHelp us make it better
As with all of our open-sourced projects, Kitesurf lives in Github and we welcome forks and contributions. However, note that Kitesurf is under heavy development and we are focusing on making the engine more compatible (check out Web Platform Test evolution), more reliable, and efficient.
Start with the contribution guidelines if you want to contribute. Open an issue with a minimal reproduction or a proposed approach, and get vouched by a maintainer before opening a pull request. Focused fixes with tests, clear evidence, and a well-defined scope are much easier to review than large rewrites or unrelated cleanup, but all contribution does not have to be code: a small page that reproduces a rendering bug, a failing automation workflow, or a clear documentation correction can help us move forward.
Stay tuned
Kitesurf is evolving quickly. Stay tuned for updates in the blog and our changelog, and keep an eye on the official landing page for the latest on standards compatibility in Web Platform Tests page and benchmarks.
And come chat with the team on Discord. We’re building a browser for agents, and we’d love your help making it better.

Is your OpenTelemetry pipeline becoming a performance bottleneck?
OpenTelemetry observability pipelines can become infrastructure bottlenecks themselves if engineers ignore batching, attribute cardinality, and memory limiter placement.
Deep dive
- Inefficient batching leads to excessive export requests and network serialization overhead.
- Unnecessary attributes (e.g., granular CPU model metadata) inflate telemetry volume and increase downstream storage costs.
- High-frequency receiver polling (e.g., every 5s) creates constant resource churn.
- Tail-based sampling provides better diagnostic value but requires memory-intensive buffering of spans until a trace completion decision is made.
- Two-tier collector architectures separate edge-side collection from centralized gateway processing to improve scalability.
Decoder
- Cardinality: The number of unique values in a dataset; high-cardinality attributes (like unique request IDs) can lead to an explosion in time-series database storage requirements.
- Tail-based sampling: A sampling technique that makes retention decisions after a full trace is complete, allowing systems to prioritize keeping error-heavy traces over successful ones.
- Backpressure: A mechanism where a system signals that it is unable to handle incoming requests at the current rate, preventing buffer overflow and potential crashes.
Original article
How to Defeat OTel’s Silent Killer: The Performance Overhead
At Cloud Native Days Austria 2026, I presented a talk called How to Defeat OTel’s Silent Killer: The Performance Overhead, exploring a problem that is easy to overlook when building observability pipelines: the cost of collecting telemetry itself.
OpenTelemetry has become a cornerstone of cloud-native observability, providing standardized APIs, SDKs, and tooling for generating, collecting, processing, and exporting metrics, logs, and traces. However, instrumentation and telemetry processing are not free. Every span created, attribute attached, and batch exported consumes resources.
As applications scale, poorly configured telemetry pipelines can introduce significant CPU usage, memory pressure, network traffic, and storage costs. In some cases, the infrastructure responsible for observing a system can become a performance problem of its own.
The good news is that much of this overhead can be understood, measured, and reduced without sacrificing the visibility engineers depend on.
Where does OpenTelemetry overhead come from?
When discussing OpenTelemetry performance, we often focus on the application SDK. However, the cost extends beyond instrumentation.
The entire telemetry pipeline contributes to resource consumption, from generating spans and collecting metrics to processing, exporting, and storing data.
Instrumentation overhead is also workload-dependent. Two applications using the same instrumentation libraries can experience very different results depending on request throughput, attribute volume, runtime behavior, and the number of spans generated per request.
This is why relying on a single overhead percentage can be misleading. Instead, we should examine CPU consumption, memory usage, application latency, telemetry volume, and the behavior of the Collector under load.
There is also an important trade-off between application safety and telemetry completeness. When a pipeline becomes overloaded, backpressure and memory safeguards can protect the application and OpenTelemetry Collector, but they may also lead to rejected or dropped telemetry.
The objective is not simply to minimize resource consumption. It is to maintain useful observability while keeping its operational cost predictable.
Investigating the Collector: five common configuration problems
For my demonstration, I used Telemetrygen, an OpenTelemetry utility that generates synthetic telemetry, to investigate how Collector configuration affects resource consumption.
The investigation focused on five common sources of unnecessary overhead.
1. Inefficient batching
Exporting small amounts of telemetry frequently can increase serialization work, export requests, and network overhead.
The OpenTelemetry Collector groups telemetry inside the exporter’s sending queue before transmitting it downstream, helping amortize this work across larger payloads.
However, batching parameters should reflect the actual workload. Larger batches are not automatically better: they can increase buffering requirements and affect export latency.
exporters:
  otlp_grpc:
    endpoint: "otel-backend:4317"
    sending_queue:
      enabled: true
      sizer: items
      queue_size: 100000
      batch:
        enabled: true
        min_size: 8192
        flush_timeout: 200ms
Configuring batch inside an exporter’s sending_queue groups spans, metrics, or logs before forwarding them downstream, improving compression efficiency and durability while reducing export overhead. Batches are sent when a configured size threshold is reached or a timeout expires.
In this example, min_size: 8192 triggers an export when the batch reaches 8,192 items, while flush_timeout: 200ms triggers an export regardless of batch size. Once batching is enabled, these values are the Collector’s documented defaults, not universal performance recommendations.
The important point is to measure how batching affects resource consumption and throughput rather than relying on example configurations.
2. Unnecessary resource attributes
Resource attributes provide valuable context about the systems producing telemetry. But collecting and forwarding attributes that nobody uses can increase payload sizes and downstream processing costs.
For example, an application might need host.name, host.arch, and os.type for troubleshooting, but not detailed hardware information such as host.cpu.model.name or host.cpu.cache.l2.size.
The OpenTelemetry Collector’s resource detection processor allows engineers to configure which system attributes are collected. Disabling unnecessary attributes can reduce telemetry volume and processing overhead, although the impact on storage and cardinality depends on the backend.
3. Aggressive receiver polling
Infrastructure receivers collect metrics at configured intervals, often independently of application traffic.
Polling host metrics, container statistics, databases, and network services every few seconds creates continuous work even when applications are relatively idle.
Increasing collection intervals from 10 to 30 seconds, where operational requirements permit, can reduce collection frequency and associated overhead.
This introduces a trade-off: lower polling frequency means less temporal resolution. The appropriate interval depends on how quickly a metric changes and how it is used for troubleshooting or alerting.
4. Exporting every trace
Not every successful request needs to produce a trace that is retained.
Exporting all traces can consume significant bandwidth, Collector resources, and backend capacity, particularly in high-throughput applications.
Sampling provides a way to control this volume.
Head-based sampling makes decisions early, reducing downstream work. Tail-based sampling makes decisions after observing more of a trace, enabling policies that retain errors or other diagnostically interesting requests.
These policies retain traces with an error status and probabilistically sample 5% of traces, including potentially some additional error traces. However, tail sampling is not free. It requires buffering trace data until a decision can be made, introducing additional memory and processing overhead.
Choosing a sampling strategy means balancing cost, diagnostic value, and the resources needed to make sampling decisions.
5. Memory safeguards applied too late
The OpenTelemetry Collector includes a memory_limiter processor to help manage memory pressure.
Processor ordering matters. When enrichment and transformation processors run before memory limiting, the Collector may perform additional work on telemetry that is subsequently refused under memory pressure.
Memory limiting is a protective mechanism rather than a performance optimization in itself. Its purpose is to improve stability under pressure, not necessarily to reduce CPU consumption during normal operation. Placing the memory limiter early in the pipeline helps apply safeguards before more expensive processing.
It is important to understand that the memory limiter is not a substitute for appropriate resource limits or capacity planning.
From local experiments to production architecture
Optimizing a single Collector is only part of the solution.
In Kubernetes, telemetry workloads can fluctuate significantly as applications scale, deployments change, and traffic increases. A Collector configuration that performs well under synthetic load may behave differently in production.
- Separate collection from centralized processing. A two-tier architecture can use lightweight edge Collectors for local collection and gateway Collectors for more expensive processing. This allows different parts of the pipeline to scale according to their workloads.
- Control telemetry volume early. Filtering unnecessary attributes, removing unneeded data, and avoiding excessive cardinality can reduce the amount of information processed and transferred downstream.
- Plan for memory pressure and backend outages. Kubernetes memory limits, Collector memory safeguards, bounded queues, and retry mechanisms serve different purposes.
- Scale with signal-specific requirements in mind. Horizontal scaling can increase throughput, but stateful processing requires additional consideration. Tail sampling, for example, generally requires spans belonging to the same trace to reach the same processing instance.
Don’t forget the instrumentation
One of the most effective optimizations happens before telemetry reaches the Collector.
Instrumentation should answer meaningful operational questions rather than collect everything simply because it is possible. Excessive spans, high-cardinality attributes, and unnecessary instrumentation can increase resource consumption throughout the entire pipeline.
Making performance part of observability design
OpenTelemetry overhead is not a single problem with a single configuration fix.
It is the combined effect of instrumentation decisions, data volume, processor configuration, export behavior, and infrastructure architecture.
The most useful lesson from this investigation is that observability pipelines should be measured and optimized like any other production system.
Start with controlled benchmarks. Understand where resources are consumed. Introduce configuration changes individually, and evaluate their impact on CPU, memory, latency, throughput, and telemetry loss.
Most importantly, treat example configurations as starting points rather than production-ready defaults.
How Salesforce efficiently right-sizes Kubernetes workloads at scale on Amazon EKS
Salesforce saved $5 million in infrastructure costs by combining VPA and HPA on Amazon EKS while carefully partitioning their scaling metrics to avoid conflict.
Deep dive
- Salesforce migrated from Cluster Autoscaler to Karpenter to optimize node-level provisioning.
- VPA was used in 'Off' mode initially to analyze recommendations before enabling automated resizing.
- Multi-layered safety guardrails included Pod Disruption Budgets (PDBs) and limited updater intervals (30 minutes) to prevent thrashing.
- The team specifically avoided VPA limit management to prevent OOM errors during traffic bursts.
- They plan to implement in-place resizing for DaemonSets to avoid pod restarts for minor resource adjustments.
Decoder
- VPA (Vertical Pod Autoscaler): A Kubernetes controller that automatically adjusts CPU and memory requests for pods based on usage history.
- HPA (Horizontal Pod Autoscaler): A Kubernetes controller that scales the number of replicas in a deployment based on metrics like CPU usage or custom thresholds.
- Istio: A service mesh that manages communication between microservices, often deployed with sidecar proxies that require their own resource management.
Original article
How Salesforce efficiently right-sizes Kubernetes workloads at scale on Amazon EKS
As Kubernetes fleets grow, so does the gap between the resources teams reserve and the resources their workloads actually use. Clusters running at low utilization consume compute that is paid for but never used. At the scale of hundreds or thousands of clusters, the waste compounds into millions of dollars annually. Static right-sizing workloads is one obvious remedy, but it is not the most efficient solution. Kubernetes does not ship an out-of-the-box solution that continuously tunes CPU and memory to match real demand across a large, multi-tenant fleet. Teams that want this capability must build their own multi-dimensional scaling strategy. Salesforce was one of the first enterprise companies to pioneer Vertical Pod Autoscaler (VPA) adoption at a large production scale across the fleet along with Horizontal Pod Autoscaler (HPA). The multi-dimensional scaling strategy with a combination of both VPA and HPA optimized workload resource reservations and drove more than $5 million in cumulative infrastructure cost savings.
How we started
Salesforce operates a large multi-tenant Kubernetes platform spanning over 1,400 live Amazon Elastic Kubernetes Service (Amazon EKS) clusters. Individual clusters can be as large as 2,500 nodes and support about 1,000 workloads (Deployments, DaemonSets, StatefulSets, and more). Salesforce is one of AWS’s largest customers and we work closely with AWS to scale our Kubernetes platforms.
In the platform’s early days, when the fleet was around 100 clusters and the total number of nodes and workloads was small, we managed workload right-sizing through static configurations. As our fleet rapidly grew, that operational model became inefficient and unsustainable.
We identified three key challenges with static resource management:
- Risk of production incidents – Inaccurate CPU and memory requests and limits often led to CPU throttling under unexpected load or pods being terminated.
- High operational toil – Engineers constantly had to work through historical telemetry and tweak static configurations across environments.
- Scalability bottlenecks – As the number of clusters, nodes, and workloads expanded, maintaining optimal resource configurations across a massive fleet became impossible.
To address these challenges and move away from static workload configurations, the Salesforce Kubernetes platform engineering team adopted the VPA to complement the HPA already running across our environments. By combining VPA for dynamic workload right-sizing with HPA for replica scaling, the team built multi-dimensional autoscaling strategies. The team has also migrated from the traditional Cluster Autoscaler to Karpenter to optimize compute resources and empower internal developers to self-serve infrastructure needs. Working in close partnership with AWS and the open source Kubernetes community, we rolled out VPA, HPA and Karpenter configurations across development, staging, and production environments with no customer-impacting incidents.
Solution overview
Autoscaling requirements vary by workloads. The Kubernetes platform engineering team matched each workload to one of three approaches based on its usage pattern: VPA alone, HPA alone, or a combination of both. The following sections describe when each pattern applies.
Vertical Pod Autoscaler (VPA) only
VPA tunes CPU and memory requests based on observed consumption, correcting pods that are under- or over-provisioned. It suits workloads that scale by resource size rather than replica count. For example, leader-follower workloads where adding replicas provides no additional benefits. The team applied VPA-only configurations to Amazon EKS add-ons and workloads that fit this pattern.
Horizontal Pod Autoscaler (HPA) only
HPA adjusts replica counts for Deployments, ReplicaSets, ReplicationControllers, and StatefulSets using built-in resource metrics (CPU and memory) or custom external metrics. Stateless workloads and Kubernetes webhook servers were the primary candidates, since they scale horizontally by adding identical replicas.
Multi-dimensional autoscaling (VPA + HPA)
The Istio service mesh is a representative example of multi-dimensional autoscaling, where VPA and HPA operate together to handle high production loads. The Istio control plane (istiod) performs two distinct functions, each with a different scaling characteristic:
- Configuration distribution (horizontal scaling with HPA) – Each control plane pod maintains connections to a set of data plane proxies. As the number of proxies grows, HPA provides additional control plane pods to hold the average at roughly 500 connected proxies per pod.
- Configuration generation (vertical scaling with VPA) – Every istiod pod generates the same configuration, so adding replicas provides no benefit. Larger environments instead require pods with higher CPU and memory allocations, which VPA adjusts.
The key to running VPA and HPA together on the same workload is to scale the target replica or pod on an independent metric dimension, which prevents VPA and HPA from auto resize workload on the same signal:
Vertical scaling (VPA) adjusts istiod pod CPU and memory allocation based on resource utilization.
Horizontal scaling (HPA) adjusts the istiod replica count based on the number of connected data plane proxies.
Operational safeguards and rollout tooling
Beyond selecting an autoscaling strategy for each workload, the Salesforce Kubernetes platform engineering team invested in technical analysis, custom tooling, and operational safeguards to enable and release VPA and HPA configurations safely across the production fleet. The main focus areas were:
- Continuous integration and continuous delivery (CI/CD) – Integrated VPA and HPA configurations into our Spinnaker pipelines and Terraform modules for version-controlled rollouts and automated testing across development, staging, and production clusters.
- Staggered rollouts – Rolled out VPA and HPA changes in phases, progressing from lower environments to production and from low impact to high impact services. Each stage includes bake time and post-deployment analysis before the next begins.
- Rollback support – Built rapid-rollback Day-2 operations mechanisms, including automated Managed Operations (MO) and feature toggles, so operators can pause a VPA or HPA release and revert to static resource configurations without service disruption.
- Functional and performance testing – Ran end-to-end functional and performance benchmarks with in-house load-testing suites to evaluate system stability and recommendation accuracy under a range of workload conditions.
- VPA recommendation algorithm analysis – Reviewed VPA’s decaying histogram algorithm and evaluated percentile targets (for example, P90) against our in-house monitoring metrics.
- Workload startup resource analysis – Measured initialization burst patterns across workloads to set appropriate minAllowed and maxAllowed values, so pods receive adequate CPU and memory during startup.
- Cost-savings tracking – Developed cost-tracking tooling to measure infrastructure optimization and quantify savings across environments.
- VPA guardrails – Applied multi-layered safeguards, including minimum replica thresholds, Pod Disruption Budgets (PDBs), eviction rate limiting, and reduced updater run intervals, to eliminate restart loops and prevent unexpected pod evictions.
- Monitoring and alerting – Built operational dashboards in Grafana and our in-house metrics platform, with automated alerts for VPA and HPA component health, eviction rates, restart rates, and synthetic workload health.
Future expansion
Through the successful release of Vertical Pod Autoscaler (VPA) and HPA configs, the team plans to further expand capabilities across several key operational initiatives:
- In-place resource resizing for DaemonSets: To right-size DaemonSet resources for both high availability and cost optimization, the team plans to use the VPA Eviction-Free InPlace Resize feature. This capability will allow dynamic CPU and memory adjustments without requiring pod restarts or evictions, mitigating disruptions to the DaemonSet workloads.
- In-place autoscaling: The team is turning on the InplaceOrRecreate update mode across standard workloads, triggering pod evictions or recreations only when the underlying node lacks sufficient CPU or memory resources, else resize pod in-place.
- VPA invocation policy: Extend VPA to effectively right-size sidecar containers injected into the application pods. By configuring the VPA admission webhook to execute after other mutating webhooks, VPA ensures accurate pod resource specifications for every container.
- Fleet monitoring: To support VPA and HPA enablement across diverse workloads, the team enhanced kube-state-metrics and the metrics collection agent to send relevant metrics directly into the central metrics platform. The platform end users can build dashboards and alerts, compare HPA and VPA configurations through metrics queries, and measure right-sizing and cost savings without relying on the platform team.
- AI and machine learning workload optimization (stretch goal): Extend autoscaling frameworks to support AI inference and model serving workloads. By pairing VPA with HPA for model serving demands, the platform aims to maintain optimal latency while reducing idle compute costs.
Lessons learned
Set the right expectations
The Vertical Pod Autoscaler (VPA) is intended for steady-state, long-term resource optimization rather than handling sudden workload traffic spikes. Using the decaying histogram algorithm, VPA analyzes historical usage metrics across a standard 8-day window, weighing the most recent data heavily to gradually refine workload recommendations. While VPA handles automated long-term right-sizing, real-time load surges are best managed through Kubernetes resource limits and horizontal scaling with HPA.
We do not recommend using VPA update limits for 2 reasons.
- Lack of declarative clarity, VPA calculates limits based on the request-to-limit ratios specified in the workload spec, which is non-declarative and unintuitive for the users.
- When relying on request-to-limit ratios, VPA cannot adjust limits quickly enough to handle sudden load spikes, leading to potential workload throttling or out-of-memory (OOM).
Using VPA alongside HPA and other autoscalers
Running VPA and HPA concurrently is fully supported, provided they do not scale on the same metric. To avoid race conditions and conflicting scaling behavior, configure VPA and HPA to target distinct metric dimensions. For example, use VPA for CPU and memory, paired with HPA driven by custom or external metrics suited to the application’s scaling needs.
Always start with Off mode
When enabling VPA on new workloads, we strongly recommend using the “Off” mode (read-only mode) for initial release. Operating in Off mode enables engineering teams to continuously collect telemetry, review generated recommendations, and analyze proposed CPU and memory adjustments without risk of automatic pod restarts or unintended resource right-sizing in production environments.
updatePolicy:
  minReplicas: 2
  updateMode: Off
RequestsOnly controlledValues
During our testing, we observed that allowing VPA to adjust resource limits based on the workload’s request-to-limit ratios could cause unintended throttling or pod termination during load spikes, because VPA could not raise the limit fast enough to cover the surge.
To address this, we recommend configuring the VPA resource policy with controlledValues: “RequestsOnly”. This ensures VPA manages only CPU and memory requests, leaving limits as defined in the workload spec.
spec:
  resourcePolicy:
    containerPolicies:
    - containerName: '*'
      mode: "Off"
    - containerName: recommender
      controlledResources:
      - cpu
      - memory
      controlledValues: "RequestsOnly"
Set higher resource limits
Before defining container resource limits, run scale tests to establish accurate peak usage profiles. As a best practice, set resource limits to at least 4 times of the maximum observed resource usage. This provides a safety buffer against transient load spikes.
Limit VPA updater execution frequency
To minimize continuous pod evictions and prevent workload instability, tune the VPA updater to run periodically rather than continuously. The team restricts the updater run interval to every 30 minutes.
containers:
- args:
  - --address=:8943
  - --leader-elect=true
  - --leader-elect-resource-name=vertical-pod-autoscaler-updater
  - --v=4
  - --kube-api-qps=30
  - --kube-api-burst=100
  - --eviction-rate-limit=50
  - --updater-interval=30m0s
  - --feature-gates=InPlace=true
Set VPA maxAllowed to avoid unschedulable pending pods
When configuring VPA, define maxAllowed resource boundaries in the VPA resource policy so that upper recommendations do not exceed the maximum allocatable resources of the underlying node.
Without upper boundary limits, VPA can recommend resources that exceed the total allocatable CPU or memory on any node in the node pool. When VPA resizes or recreates pods to apply these oversized requests, the Kubernetes scheduler cannot place the pods on any available node, leaving critical workloads stuck indefinitely in the Pending state.
Conclusion
By combining VPA and HPA, the Salesforce Kubernetes platform team moved from static resource management to a dynamic, multi-dimensional autoscaling strategy across its EKS fleet. Operational guardrails, performance and scale testing, and automated rollouts let the team reduce infrastructure cost while keeping workloads stable and avoiding customer-impacting incidents. Looking ahead, the team plans to expand in-place resource resizing and extend autoscaling to AI workloads. For other teams running Kubernetes at scale, the main takeaway is that VPA and HPA can work together safely, as long as they scale on independent metrics and are rolled out behind proper testing and guardrails.
Claude-BugHunter (GitHub Repo)
Claude-BugHunter is a specialized skill bundle for Claude Code, automating red-team workflows with 83 skills and 681 vulnerability patterns.
Deep dive
- The tool covers 24 vulnerability classes across web apps, cloud platforms (M365/Okta), and enterprise infrastructure.
- It includes automated triage and report-generation skills to maintain evidence hygiene and formatting standards.
- It features an engagement engine that enforces scoping and validation gates, such as the '7-Question Gate' for submission integrity.
- It can integrate with Burp Suite via the Model Context Protocol (MCP) and is compatible with multiple AI agent harnesses.
- The project uses a dual-license model with MIT-licensed code and CC BY 4.0-licensed methodology content.
Decoder
- Model Context Protocol (MCP): An open standard that enables AI models to connect securely to local data and tools like Burp Suite or databases.
- Red-team: A process of simulating an attack on an organization's systems to identify vulnerabilities and test defense readiness.
- VRT (Vulnerability Rating Taxonomy): A standardized classification system used by bug bounty platforms (like HackerOne) to grade the severity of security findings.
Original article
claude-bughunter
A self-contained Claude skill bundle for bug hunting and external red-team work · 83 skills · 15 slash commands · 681 disclosed-report patterns (433 now individually cited & auditable) across 24 core vulnerability classes · enterprise identity + infrastructure attack matrices · engagement-folder scaffolding · Burp MCP integration · battle-tested across authorized red-team and bug-hunting engagements, plus public training platforms (DVWA, OWASP Juice Shop, Hacker101, testphp.vulnweb.com).
Built by Sachin Sharma — Bug Hunting & GenAI Security Research.
What is this?
claude-bughunter is a drop-in skill bundle for the Claude Code skills system. Install once and Claude Code stops being a chatbot and starts behaving like a senior bug-hunting researcher or red-team operator: it knows the techniques, the chain templates, the VRT mappings, the platform CVE chains, and the hygiene — and it stays in scope.
Four layers stack:
- Think —
bb-methodology+redteam-mindset: the 5-phase non-linear workflow, critical-thinking framework, and red-team operator discipline. - Hunt webapps — 58
hunt-*skills curated from 681 disclosed HackerOne reports: per-class detection patterns, payloads, bypass tables, and chain templates. - Hit the perimeter — enterprise platform chains (M365/Entra, Okta, vCenter, SSL-VPN appliances, SharePoint, cloud IAM): current 2024–2026 CVE chains + post-credential escalation.
- Ship it —
triage-validation+ reporting +evidence-hygiene: the 7-Question Gate, VRT-aware severity, OOS rebuttals, PII redaction, and red-team deliverables.
All triggered automatically by topic — describe what you're testing in plain English and the relevant skill loads. No invocation by name.
Quickstart
Option A — install as a Claude Code plugin (recommended). From inside Claude Code:
/plugin marketplace add elementalsouls/Claude-BugHunter
/plugin install claude-bughunter@elementalsouls
All 83 skills + 15 commands load namespaced under claude-bughunter: and update when you bump the plugin version — no files copied into ~/.claude/.
A HackerOne account is optional. The install asks for a HackerOne API username and token. They only let the HackerOne MCP read your private programs and your own reports; leave both blank if you don't need that. Every skill, command and the MCP's public tools (duplicate search, program scope) work without them.
Option B — copy install (no plugin system / pin to a clone):
git clone https://github.com/elementalsouls/Claude-BugHunter.git
cd Claude-BugHunter
# macOS / Linux
bash scripts/install.sh
# Windows (PowerShell)
pwsh ./scripts/install.ps1Both copy the skills + commands into ~/.claude/ (macOS/Linux) or %USERPROFILE%\.claude\ (Windows) and wire the hunt engagement scaffolder.
Runs on multiple agent harnesses
The skills are plain Agent Skills — the same SKILL.md format that Claude Code · OpenCode · OpenAI Codex CLI · Hermes Agent · Google AntiGravity all load. One command installs them everywhere:
# macOS / Linux
bash scripts/install.sh --all --burp-mcp

# Windows (PowerShell)
pwsh ./scripts/install.ps1 -All -BurpMcp
Scope — what this bundle is for, and what it isn't
This bundle covers the external attack surface — anything reachable from the internet without first compromising an internal endpoint.
In scope
- Bug bounty hunting — web apps, APIs, SaaS, GraphQL, OAuth, JWT, file upload, IDOR, SSRF, RCE chains
- Web application pentesting — full hunt-* coverage of OWASP-mapped bug classes + discipline rules
- External red-team engagements — initial-access against internet-facing enterprise estate: M365 / Entra ID, Okta-as-IdP, SharePoint on-prem (ToolShell + legacy SOAP), VMware vCenter / Workspace ONE, SSL VPN appliances (Cisco / Fortinet / Citrix / Palo Alto / Pulse / SonicWall / F5), Android APK red-team, supply-chain recon
- Cloud misconfig + post-credential escalation — public S3, IMDS chains, STS AssumeRole, cross-account confused-deputy
- Recon + OSINT — subdomain enum, identity-fabric mapping, certificate transparency, JS analysis, secret scanning
- Reporting — H1, Bugcrowd (VRT-aware), Intigriti, Immunefi, plus client-facing red-team deliverable format
Out of scope
- Internal Active Directory attacks — BloodHound, Kerberoasting, ASREProast, DCSync, Pass-the-Hash, AD CS abuse, ntlmrelayx, Responder, PetitPotam, etc.
- C2 frameworks — Cobalt Strike, Sliver, Mythic, Havoc, BRC4 tradecraft.
- Post-exploit / persistence / lateral — Mimikatz/comsvcs LSASS dumping, golden/silver tickets, named-pipe impersonation, persistence, token theft.
- Evasion — AMSI bypass, ETW patching, AV/EDR bypass.
- iOS pentesting / hardware / RF / ICS — out of scope by design.
- Binary exploitation / kernel pwn / browser internals — different skill universe.
Authorization
These skills are intended for assets you own or have written authorization to assess. The skills include validation gates that auto-trigger when you point Claude at unverified third-party targets. The bundle explicitly excludes: weaponizing 0-days against unauthorized targets, post-exploitation tooling, malware development, mass-targeting infrastructure.
Heads-up — Anthropic runtime cyber safeguards. Anthropic's models apply real-time safeguards that block "vulnerability exploitation or offensive security tooling development" by default. If you do authorized offensive security (pentest / bug bounty / red team), enroll in Anthropic's free, application-based Cyber Verification Program (CVP) to get safeguards adjusted for legitimate dual-use work.
License
This project is dual-licensed:
- Code (Python helpers, shell scripts) — MIT.
- Content (skill methodology, wordlists, regex catalogs, severity rubrics, docs) — Creative Commons Attribution 4.0 International (CC BY 4.0).
PaperOrchestra (GitHub Repo)
PaperOrchestra is a multi-agent framework designed to automate the conversion of raw experimental logs and ideas into LaTeX-ready research papers.
Deep dive
- Features a modular multi-agent pipeline for end-to-end generation.
- Includes an interactive Streamlit frontend for workflow management.
- Supports integration with various LLM backends including Gemini and OpenAI via API keys.
- Handles complex LaTeX templating and automated plotting of research data.
- Requires local setup with Conda and specific environment variables for API access.
Decoder
- LaTeX: A document preparation system used for high-quality typesetting of technical and scientific documentation.
Original article
PaperOrchestra: A Multi-Agent Framework for Automated AI Research Paper Writing
PaperOrchestra is a multi-agent framework for automated AI research paper writing. It flexibly transforms unconstrained pre-writing materials (ideas and experimental logs) into submission-ready LaTeX manuscripts, including comprehensive literature synthesis and generated visuals, such as plots and conceptual diagrams.
Acting like an orchestrated team of specialized agents, it handles outline generation, literature review, section writing, content refinement, and plotting to close the gap between raw research materials and submission ready papers.
Key Features
- Multi-Agent Pipeline: Orchestrates specialized agents (Outline, Literature Review, Section Writing, Content Refinement, Plotting) for end-to-end paper generation.
- Comprehensive Literature Synthesis: Automatically searches, prioritizes, and integrates relevant literature into the manuscript.
- Visuals Generation: Generates plots and supports the inclusion of conceptual diagrams.
- LaTeX Automation: Produces submission-ready LaTeX manuscripts adhering to target conference templates.
Installation
-
Environment Setup: The project relies on a Conda environment named
paper_orchestra. You can set up a similar environment with Python 3.11 and install the required dependencies.conda create -n paper_orchestra python=3.11 conda activate paper_orchestra pip install -r requirements.txt -
Environment Variables: Create a
.envfile in the root of the project and add your API keys:SEMANTIC_SCHOLAR_API_KEY=your_semantic_scholar_api_key OPENAI_API_KEY=your_openai_api_key VERTEX_AI_PROJECT=your_vertex_ai_project VERTEX_AI_LOCATION=your_vertex_ai_location GEMINI_API_KEY=your_gemini_api_key SMTP_EMAIL=your_email SMTP_PASSWORD=your_password
Dataset
The dataset used for paper generation is not included in this code repository. It will be released separately at a later date. Once available, you should download the dataset and place it under the datasets/ directory.
Usage
You can run the paper generation pipeline using the provided bash script or directly via the Python CLI.
Using the Bash Script
./paper_writing_cli.shUsing the Python CLI directly
python paper_writing_cli.py \
  --raw_materials_dir /path_to_your_raw_materials/ \
  --latex_template_dir /path_to_your_latex_template/ \
  --output_dir /path_to_your_output_folder/ \
  --use_plotting true
Key Arguments
--raw_materials_dir: (Required) Directory containing the raw materials (e.g., idea and experimental log).--latex_template_dir: (Required) Directory containing the LaTeX template (e.g.,templates/cvpr2025).--output_dir: Directory to output the generated paper. If not specified, an automatic folder with a timestamp is created.--use_plotting: Enable the plotting agent workflow to generate figures from code (Default:False).--writer_model_name: LLM for writer and literature agents.--reflection_model_name: LLM for reflection agents.
Interactive Demo
We provide an interactive Streamlit demo for the paper generation pipeline. For instructions on how to run and use it, please refer to the README.md in the frontend directory.
Project Structure
autoraters/: Contains scripts for automated evaluation.methods/: Core logic for agents and pipeline execution.templates/: LaTeX templates for target conferences, you can add your own template by creating a new subfolder under this directory.utils/: Utility functions for API calls, PDF handling, etc.
Citation
@article{song2026paperorchestra,
  title={PaperOrchestra: A Multi-Agent Framework for Automated AI Research Paper Writing},
  author={Song, Yiwen and Song, Yale and Pfister, Tomas and Yoon, Jinsung},
  journal={arXiv preprint arXiv:2604.05018},
  year={2026}
}
Disclaimer
This is not an officially supported Google product.
GitHub availability report: October 2026
A database connection bottleneck during runner-assignment caused a partial GitHub outage in October 2026.
Decoder
- Runner-assignment service: A backend component responsible for scheduling and dispatching jobs to compute workers.
Original article
A partial network failure caused GitHub's runner-assignment service to wait on database calls until it exhausted memory and restarted.

Ubuntu Pro users can get early access to AI-written security fixes
Canonical introduced the 'Edge' archive for Ubuntu Pro, offering early access to AI-generated security patches that are not yet fully human-validated.
Decoder
- Backport: The process of taking a fix from a newer version of software and applying it to an older, currently maintained version.
- Userspace: Parts of an operating system that run outside the kernel, where most applications execute.
Original article
Canonical is giving Ubuntu Pro users early access to AI-generated patches for known security flaws, available through a new opt-in archive called Edge.
To get fixes out faster to customers and users, the company has built a multi-agent system called Surge to backport fixes for vulnerabilities in ‘userspace’ software packages.
The machine-generated patches land in the Edge archive. This is opt-in and not enabled by default. Ubuntu Pro users who want fixes before they receive full testing or ‘qualification’, will need to manually enable the Edge archive on supported systems.
Surge is not being used to patch kernel vulnerabilities (though those do now get faster security updates too, albeit not fast enough, according to some).
Canonical says Surge fixes won’t roll out to stable releases automatically, and the existing Ubuntu security policy of testing and reviewing updates it issues through normal update channels will continue, and remain ‘strictly human-validated’.
Its security team has shipped twice as many fixes as last year already, needing to counter an increase in LLM-aided vulnerability reports and attacks with AI agents.
But it notes that human engineering, review and testing can ‘take more time than some users and customers can tolerate’. The new Edge archive is specifically for those who’d rather not wait.
We have always believed that the most resilient software is forged in the open, Canonical says in its announcement.
Through Ubuntu Pro […] researchers and power users can assess machine-generated fixes in real-world environments, helping us validate stability as we qualify them for promotion to general Ubuntu LTS availability.
Enable Edge Archive on Ubuntu
Ubuntu Pro is free for personal use on up to 5 devices, so you don’t need to be a business or customer to use the Edge archive (with caveats acknowledged) on Ubuntu 18.04, 20.04, 22.04, 24.04 or 26.04 LTS.
First, set up Ubuntu Pro via the Security Center app on Ubuntu 26.04 LTS (older releases can do it via the Software & Updates tool or use the command-line tool). You’ll need an Ubuntu One account to complete sign in.
Then, enable the new Edge archive via the CLI:
sudo apt install pro-edge && sudo pro-enable-edgeUpdates from the Edge archive aren’t automatically installed by default, but you can manually select each security update that you want.
Too much hassle? You can receive automatic updates by running:
sudo pro-enable-edge --automatic-updatesTo disable/opt-out of Ubuntu Pro Edge updates, disable the archive by removing the pro-edge package.
If you encounter any issues with the new archive Canonical ask that you report bugs to them.
How to Run a UX Postmortem: A Practical Six-Step Framework
Treating design decisions as hypotheses to be tested after launch is the key to meaningful UX postmortems.
Deep dive
- Document hypotheses early, including the specific problem and expected user behavior.
- Use diverse data sources like analytics, session recordings, and support tickets to triangulate findings.
- Focus on why behavior differs from predictions, not just if the feature was used.
- Identify 'surprises' where user behavior deviated from expectations as primary learning opportunities.
- Turn observations into high-level design principles for future use.
- Keep records brief and searchable for future team members to reference.
Decoder
- Postmortem: A retrospective review process where teams analyze an event (usually a failure) to determine root causes and define improvements, common in software engineering.
Original article
Design critiques help us answer a question before a product ships: Do we think this is the right solution? Once a feature launches, we rarely go back to analyze how our decisions actually played out. And even when we do, the outcomes may not always tell the whole story. Thoughtful design decisions could lead to poor outcomes due to changing user needs. Meanwhile, weaker decisions might succeed unexpectedly. Reviewing a project retrospectively can help us understand the difference between making a good decision and getting a good result.
As a senior UX designer, I’ve spent years in design critiques discussing how users might behave, which workflows will make the most sense, and where they might get confused. Once the design ships, the team usually moves on to the next problem. We might look at adoption metrics or support tickets, but we rarely revisit the original design decisions and compare them with what actually happened.
Some of the most useful design lessons I’ve learned have come from revisiting shipped work and realizing that my assumptions were either wrong or more nuanced than I expected.
In this article, we’ll explore why design teams predict outcomes before launch but rarely revisit them afterward. We’ll look at treating design decisions as hypotheses and what I’ve learned from revisiting shipped work. I’ll also share a simple framework for running UX postmortems without turning them into another heavy process for the team.
A UX postmortem, also called a design postmortem, is a post-launch design review. It compares design assumptions with real user behavior. A broader UX retrospective may also examine teamwork and process. Here, the focus is on what shipped work teaches us about our design decisions.
Key Takeaways
- Revisit the reasoning: Compare the assumptions behind a design with what users actually did after launch, rather than judging the decision by its outcome alone.
- Use multiple sources of evidence: Combine analytics, research, support feedback, and session recordings to understand behavior and identify what remains uncertain.
- Keep the learning reusable: Run a lightweight UX postmortem, capture surprises, and turn observations into lessons the team can apply to future work.
We spend more time predicting than learning
Part of the problem is that the reasoning behind those decisions can get lost over time. When a product decision influences the design, we document it in our Figma files. This keeps the reasoning accessible beyond a Zoom recording and helps us understand why certain choices were made. A record of the context and reasoning helps someone new pick up a design. It also helps when a project gets shelved and revisited months later. It also gives us a starting point for understanding our decisions after launch.
Most design critiques happen before launch. We discuss the problem, review concepts, challenge assumptions, and try to predict how users will respond. Mature UX teams already use analytics, usability research, and customer feedback to understand how their products are performing. Once our customers start using the product, we finally have evidence about whether those predictions were right. But what I think many teams are missing is the connection between those findings and the decisions that led them there. Product analytics might show that a feature is underused, support tickets might reveal confusion, or research might uncover an unexpected workflow. We address the immediate issue and move on without revisiting why we made the original decision.
Sometimes, we get so caught up in work and priorities that we forget to look back. On one project, we hid several secondary controls to simplify a workflow. We expected most users to follow the same path. After launch, we noticed experienced users repeatedly opening the advanced options. They needed those controls to handle less common scenarios. The solution wasn’t simply to put everything back. What initially looked like an interface problem was actually a gap in our understanding of how different users approached the task.
You can easily miss that lesson if you’re only looking at whether the feature is performing well. The more useful question is what the outcome tells us about the assumptions behind the design. That’s where looking back becomes useful because we can compare what we expected with what actually happened.
Revisiting shipped work changed how I think about design
I’ve also had hypotheses that didn’t play out as I expected. On one workflow, we debated adding an extra review step because it felt like it would slow users down. We ultimately kept it because it gave users a chance to confirm their changes before committing them. We noticed that users were completing the review step and continuing through the workflow rather than dropping off at that point.
I realized I had been treating the extra click as friction without considering what it provided in return. At first, I took this as a sign that the extra step wasn’t creating as much friction as we’d expected. But the completion rate alone wasn’t enough to tell us whether users found the extra step helpful or were simply clicking through it. To better understand that, we’d need to look more closely at how users interacted with the review step or hear directly from them. When I revisit shipped work now, I separate three things. First, what did we believe before launch? Second, what does the evidence tell us now? Finally, what would we change if we were designing it today? That last part is especially important.
Treating decisions as hypotheses
One thing that’s changed how I think about design is treating decisions as hypotheses rather than conclusions. Every workflow makes assumptions about what users need, what they’ll understand, and how they’ll behave. A critique can help us challenge those assumptions, but we won’t know how well they hold up until people actually use the product.
To evaluate our hypotheses, we need to document the reasoning behind our decisions. Capture the problem, the evidence supporting our approach, and the outcomes we expect for users. This way, we have answers to revisit and anchor to later on.
On another project, we cleaned up a map interface by grouping several actions together. They seemed to belong to the same task. After launch, we noticed users were separating those actions and moving between different parts of the workflow instead. Their behavior showed that our mental model didn’t fully match theirs.
But this observation wasn’t enough to conclude that our direction was wrong. Another explanation for their behavior could be that they were unfamiliar with the layout, the actions weren’t discoverable, or different types of users needed different workflows. To explain the behavior, we’d need to understand what users were trying to accomplish. We’d also need to check its frequency and whether it affected task completion. The useful part is understanding what that behavior tells us about the decision we made.
Borrow the learning, not the process
Engineering teams have long used postmortems to understand what happened after a system goes live. I think there’s something useful for design teams to borrow here, but not necessarily the process itself. A design postmortem makes time to understand what happened after a decision and which factors contributed to the outcome. A design might underperform for multiple reasons, such as incorrect assumptions, technical limitations, changing requirements, or simply lack of visibility to users.
I don’t think every shipped feature needs a formal meeting or a detailed document. That would quickly become another process for designers to maintain. The depth of the retrospective should depend on how much the decision impacts users, how uncertain we were about our assumptions, and whether the same decision could influence future work.
A simple framework for UX postmortems
A useful postmortem doesn’t need to review the entire project. It should focus on what we expected, what happened, and what we learned. You don’t need a lengthy retrospective or a detailed report.
1. Document your decisions and hypotheses
To run an effective postmortem post-launch, your team should have a clear understanding of the problem that you’re solving before launching. Document the assumptions and evidence behind your design decisions. Explain how those decisions might affect users. It can also be useful to write out your hypotheses around how you expect users’ behaviour to change afterwards.
2. Revisit the original assumptions
Start by going back to what the team believed before launch. Which problem did you think you were solving? How did you expect users to behave? What assumptions did the design depend on? Which elements did you intentionally simplify, prioritize, or leave out?
3. Look at what actually happened
Then look for evidence that supports or challenges those assumptions. This could be product analytics, usability research, support tickets, customer feedback, session recordings, or conversations with customer-facing teams. Don’t rely on a single metric. You’re trying to understand not just what happened, but why.
4. Identify the surprises
Look for anything that happened differently than expected, both good and bad. Maybe users found a workflow easier to learn than anticipated or they ignored a feature the team thought would be valuable. Surprises can make us question how well we understood the problem or if we thought of it in a different way.
5. Turn observations into principles
Don’t stop at documenting what happened. Ask what you can take from it and apply to the next project. For example, “users kept opening the advanced controls” is an observation. “Design simple defaults without removing the flexibility experienced users need” is a lesson you can apply to other workflows.
6. Make the learning reusable
Finally, capture the lesson somewhere the team will actually find it. A simple page with four things is often enough: the original assumption, what actually happened, what surprised us, and what we’d do differently next time.
Conclusion
Design critiques help us make better predictions. Postmortems help us get better at making those predictions. But we won’t always learn the right lessons from looking back at our work. Often, confirmation bias can get in the way of learning from our past decisions. Designers should be open to questioning their own interpretations and try to see things from different perspectives.
If you want to try this with your own team, start small. Pick one recently shipped feature and compare what you expected to happen with what actually happened. Look for one assumption that held up, one surprise, and one thing you’d approach differently today. Then capture that lesson somewhere the team can find it.

UI Components for AI Agents (Website)
A new collection of pre-built React, Vue, and Svelte components simplifies the UI heavy-lifting required to represent AI agent reasoning and tool usage.
Deep dive
- Provides 30+ components focused on AI-specific states.
- Includes visual patterns for thinking, reasoning, and tool execution.
- Supports React, Vue, and Svelte frameworks.
- Components focus on transparency, showing users what the agent is processing in real-time.
- Helps developers avoid common pitfalls in UX by visualizing opaque background processes.
Decoder
- Agentic workflow: A software pattern where an AI acts as an autonomous or semi-autonomous actor, making decisions and calling tools to complete a series of tasks rather than just outputting text.
Original article
UI components for AI Agents
Beautifully crafted, copy-paste blocks for everything an agent shows mid-conversation: thinking states, tool calls, streaming text, tables and more.
Thinking & Reasoning
- Thinking State
- Thinking + Reasoning
- Orbs
Tool & Action States
- Audio Waves
- File Diff
- Image Processing
Text Outputs
- Text Response
- Streaming Text
- Code Block
- Inline Citations
Structured Outputs
- To-do List
- Data Table
- Comparison Table
Rich & Interactive
- Message Actions
- Reasoning Effort
- Secure Input
- Voice Chat
- AI Bot Avatar
- AI Agent Input
- Approval Card

Visual Editor for Your Codebase (Website)
Airship integrates AI directly into your development server, allowing for visual, Figma-like editing of a live running application.
Original article
Full article content is not available for inline reading.
Working with designers
Designers provide an essential perspective different from engineering-heavy teams, but having more than one designer at a time frequently creates friction.
Deep dive
- Designers are culturally distinct from engineers and PMs, which is a structural advantage.
- Multiple designers on a single project often leads to circular feedback and redundant effort.
- Design systems suffer from a 'principal-agent' conflict: the owners prioritize beauty, while the users prioritize shipping functional requirements.
- Cross-version compatibility (e.g., using a React design system in an HTML/CSS app) remains a major, persistent engineering tax.
- Software doesn't always require 'design' in an aesthetic sense; many functional systems are successful despite poor user experience.
Decoder
- Design System: A collection of reusable components, standards, and documentation that provides a framework for building consistent user interfaces.
- Air cover: Organizational support from management to shield a team from external pressure or scope creep.
Original article
I love working with designers, in part because (unlike managers and product managers) they’re culturally different from engineers. However, having more than one designer on a team is asking for trouble, and I have complicated negative thoughts about design systems.
Design is a strange role
Designers demonstrate their value immediately. While working on some feature, I’ll typically put together some placeholder UI that I’m reasonably happy with. I then show it to a designer, who strokes their chin and says “hmm, I have some ideas here”. They then go away and produce a mockup UI that is not just clearly better, but better in ways I could not have imagined. There aren’t any other roles at a tech company where you can see the value at a glance.
Designers are an unusual role in other ways, too. Engineering managers, product managers, and engineers all come from broadly the same stock: technical, detail-oriented planners. We are people of the spreadsheet. In fact, many managers and product managers were once engineers: it’s a natural transition. Not so for designers. I’m sure they exist, but I’ve never met any designers who started out as engineers.
Because of this, designers are culturally distant from engineers. In my experience, this is a big positive. I’ve complained before that product managers who were once engineers tend to be worse, not better. Once you start trying to make your own secret technical assessments instead of finding a way to trust your engineering team, you’re doomed: you won’t be able to do it well enough, and the fact that you’re trying will make it impossible to build the trust you need. Designers don’t have this problem at all.
One designer at a time
So far I have made designers sound like the elves of Middle-earth: mysterious creatures who glide around tech companies dispensing magic. In fact, they are more like the Slavic household spirits, or Domovoy. If you have one Domovoy in a household, it will protect your home against misfortune. If you ever have more than one, they will fight bitterly: “making all sorts of noises, injuring the cattle, turning the master out of his bed, choking people while asleep, etc”. Likewise, a designer can turn your scrappy product into something really beautiful — but you had better have only one designer, otherwise you’re asking for trouble.
The worst experience I have ever had working with designers was on a product where we had three of them: initially just one, who then rotated off the project and was replaced by two very senior designers. As far as I could tell, the first design was pretty good. Unfortunately, the new designers didn’t feel the same way. The very first thing they did was completely redesign the product, which meant I had to rewrite most of the frontend styles. Then they began disagreeing with each other. I think we went back on each page of the product three or four times: one designer would tell me to change X, then the other would change it back, and so on. In the meantime, I was desperately trying to get the product to work.
I knew what I was supposed to do in theory: get everyone in a room talking to each other and hash out a decision. Maybe this would have worked on a different product where the requirements were more stable, but it didn’t work here. The differences in taste, while imperceptible to me, were just too deep. It seemed like everything Designer A produced was slightly wrong in Designer B’s eyes, and vice versa. In the end we just powered through by implementing each new iteration until about a week before the deadline, at which point I called in two layers of management as air cover to freeze the design in its current state.
These were really good designers! They were far, far better than me at design, and were very nice people who I’d happily work with again. I just think it’s inherently bad to work with more than one designer at a time. I’ve had this experience over and over on different teams and companies. I can only guess as to why, but here are two theories:
- Engineering disagreements can pivot on concrete measures of quality like latency, bugs, lines of code, and so on, while designers must rely only on taste
- Design changes anywhere affect the whole product, because users experience the product as a single design, while many engineering choices are invisible to the user (and so can be safely inconsistent)
Flexibility and design systems
One way companies try to scale design work is to produce a “design system”: a library of frontend components that are all design-compliant, that can in theory be assembled like Legos into a page that looks consistent with the rest of the company. I hate design systems. However, like democracy, they’re better than any other way I’ve seen to enforce a consistent design.
The first problem with design systems is one of incentives. The engineering team that owns the design system is incentivized to produce elegant components that will look beautiful all the time. The engineering teams that use the design system are incentivized to produce systems that meet inelegant or ugly customer requirements. So you have this permanent battle where a product team demands something — say, the ability to embed arbitrary images into the dropdown component — and the design team pushes back because they’re worried it will look bad.
The dynamic I described above (where designers tend to disagree with each other) makes this much worse. Often an embedded designer on the engineering team will push for some design that is slightly different from the design system, which (a) makes the design system owners very unhappy, and (b) makes the engineers unhappy, because the component must be tortured into a very slightly different appearance.
The result of this problem is that engineering teams are perpetually hacking their way around the design system: reimplementing their own versions of components, reaching in with CSS to tweak the styles of existing components (which then get broken in each component update), and so on.
This leads into the second problem: compatibility. Design systems are typically written in the latest and greatest frontend framework, but the actual frontend code at a company is always a hodge-podge of various technologies and versions that are too expensive and risky to update. For instance, you often have a design system in React that is being used to plan changes to a frontend in pure HTML and CSS. I have spent years of my life wrestling with this exact problem: either you spend ages trying to reimplement some percentage of the React component, or you try and use the outdated pure-CSS design system (if one exists), or you give up and just embed a React component directly into the HTML. All of these are very unpleasant for different reasons.
One common situation is that the version of the design system available to you (i.e. the pure-CSS version, or the React 16 version) looks subtly different from the design system available to your designer, and so when you plug your Legos together you don’t quite get what they were visualizing. This leads to a very tedious conversation where you have to explain that no, it’s not actually trivial to bump the entire app to the latest React version. When you’re actually implementing the app, you have to constantly run a kind of translation in your head: “okay, the designer wants dropdown feature A, but the dropdowns in my version of the design system only offer features B and C, so I guess C is close enough…”
I still think design systems are better than the alternatives. When you’re up-to-date and don’t have a designer who wants anything weird, they work great. Ensuring that a thousand engineers across a giant application all produce consistent UI is a very hard problem and I don’t know any other way to solve it. I just wish that the designers I worked with were more considerate of the fact that design systems often make the immediate work of engineering more difficult.
Do you actually need designers?
The classic three-legged stool of product development is made up of engineering, product management, and design. Design is definitely the shorter leg. Almost every team I’ve worked on has had some kind of embedded product management, but only about half the teams I’ve worked on have had some access to design (and even fewer have had an embedded designer on the team). Why is that?
Partly it’s because there are products that don’t require design, or at least not in the visual sense that designers provide. Some of the teams I’ve worked on have owned systems with no real visual component: APIs, billing and reconciliation, markdown or pdf rendering. I have seen companies put designers on these teams anyway, out of some sense that “design thinking” can improve the structure of an API. This is nonsense. Good API design is very important, but it’s a technical job, not an aesthetic one. Designers on these teams typically just sit around or tunnel-vision on some unimportant piece of UI that the team does own (e.g. some internal admin component that no customer will ever see).
It’s also because badly designed products still work. I don’t think Netlify Analytics is well-designed: it’s awkward to use and does not show me information it definitely has. But I still pay for it, because I want server-side analytics for my blog. I don’t think many people have complimented the aesthetics of the Microsoft Azure admin portal, but Azure broke $100B of revenue this year. There are very few software products where design is truly business-critical.
As an engineer, I selfishly wish I could work with a designer all the time. I want to work on beautiful products, and I can’t make them beautiful myself.

Weight-Space Programming builds neural networks like a 1990s researcher
Weight-Space Programming reveals that frontier models can construct effective neural networks by 'hand-coding' weights using classical pre-deep-learning techniques.
Deep dive
- Claude Fable 5.2 successfully built an MNIST classifier without traditional gradient-based training.
- The model utilized hand-crafted features such as Sobel-like edge detectors and corner detectors.
- Final classification was achieved through log-odds scoring, simulating a naive Bayes approach.
- In a Go test, the model compiled a rule-based engine into weights that outperformed standard reinforcement learning models.
- Success on simple tasks like MNIST was high, but hand-crafted features struggled with complex datasets like Cats vs. Dogs.
Decoder
- Weight-Space Programming (WSP): A technique where an LLM is prompted to directly write or edit the numerical parameters (weights) of a neural network rather than providing training data for backpropagation.
- MNIST: A classic, 10-class dataset of handwritten digits often used to benchmark basic machine learning models.
- Sobel filter: An early computer vision technique used for edge detection in images by calculating the intensity gradient.
Original article
Full article content is not available for inline reading.
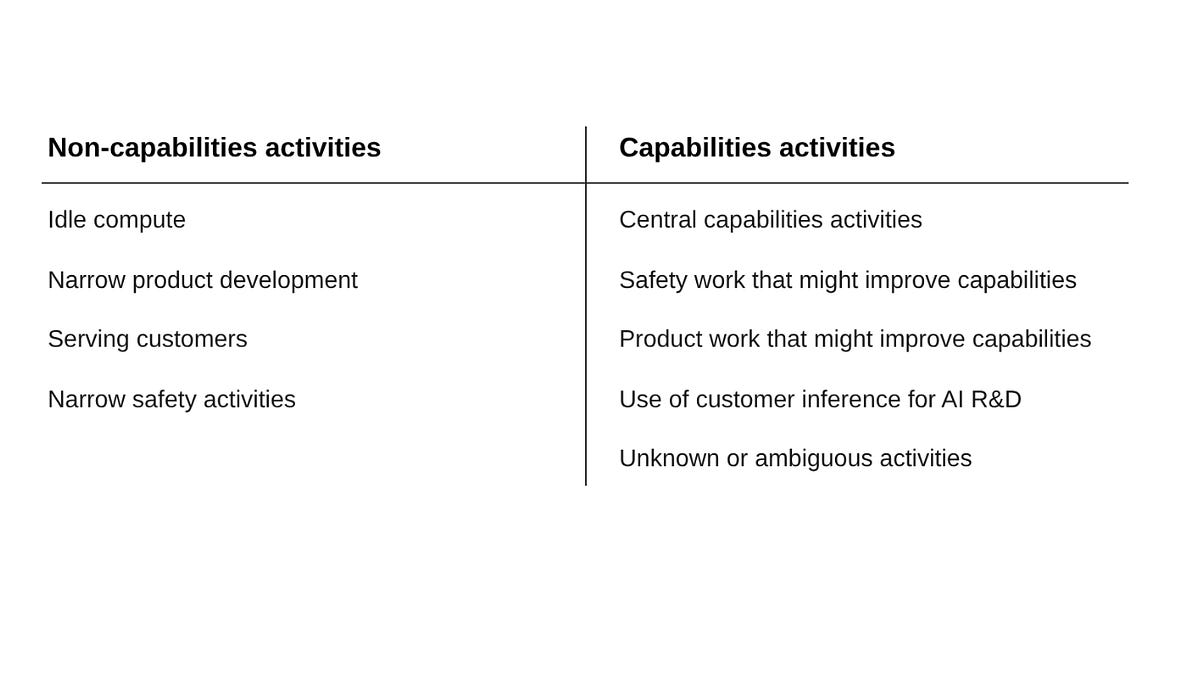
How should we define “capabilities activities” for the purpose of pacing?
Researchers propose a standardized, auditable framework for defining 'capabilities activities' to pace the frontier of AI development.
Deep dive
- Defines a 'capabilities' activity broadly as any compute used to improve model performance or general intelligence.
- Proposes four narrow non-capabilities categories: Idle compute, product development, serving customers, and narrow safety research.
- Narrow safety research is limited to a small whitelist: alignment evaluation, security patching, interpretability, CoT informativeness, model persona, model organisms, and theoretical alignment.
- Emphasizes that activities should be classified by their potential for dual-use (improving capabilities) rather than just their stated intent.
- Advocates for a regime where aggregate compute spend on capabilities is legally or voluntarily capped.
Decoder
- Dual-Use: Technology or research that has both beneficial applications and potential to be repurposed for harmful or more advanced capabilities.
- Scalable Oversight: Research aimed at using AI models to help humans evaluate, supervise, or steer other, potentially more powerful AI systems.
Original article
How should we define “capabilities activities” for the purpose of pacing?
We’d like to pace the frontier by restricting the amount of compute AI companies use to improve AI capabilities, perhaps via legislation or voluntary commitments. For this purpose, we’d need a standardized definition of which uses of compute count as “capabilities activities”. This document gives one option for such a definition; a rough breakdown of our classification is as follows:
We define and elaborate on each of these categories below. First, though, we discuss the desiderata this definition is meant to satisfy.
Thanks to Thomas Larsen, Zach Stein-Perlman, Alex Mallen, Eric Gan, Jeff Wu, Girish Gupta, Adam Kaufman, and others for feedback on drafts of this document.
What our classification is meant to accomplish
In order for such a definition to be an effective tool for pacing, it needs to satisfy some basic properties:
- Substantially restricting the amount of compute spent on “capabilities activities” should substantially decrease the rate of AI progress.
- The classification should be robust to adversarial pressure, in that the above point should hold even if companies are willing to adjust or reframe their activities to avoid being classified as “capabilities”.
- The classification should be fairly simple and tractable to adjudicate. Reasonable experts should largely agree on how this definition classifies activities.
There is a simple definition that satisfies all of the above desiderata: one could classify all work by AI companies as “capabilities activities”. The goal of this document is to propose a more scoped notion, allowing many types of work to be excluded from the “capabilities” total, while hopefully remaining pretty robust.
We stress that our definition is not intended as a perfect metric for whether an activity will genuinely end up improving capabilities. Instead, we adopt the following philosophy:
- False-positives are better than false-negatives. (I.e., it is much more acceptable to classify something as “capabilities” that doesn’t accelerate AI progress, than to classify something as “non-capabilities” that does.)
- Computationally non-intensive activities are negligible. (I.e., it is not very important how this definition classifies an activity if that activity only represents a very small amount of compute.)
We now give our definition. We start by defining non-capabilities activities. Later in the document, we give examples to clarify what capabilities activities are (although they are defined as “everything other than non-capabilities activities”).
Non-capabilities activities
Activities are considered capabilities activities by default. The only exceptions are idle compute, narrow product development, serving customers, and narrow safety activities. These exceptions apply only if the activity doesn’t improve general model capabilities.
Idle compute
Compute that isn’t performing any computations. Note: the whole GPU has to be idle—an underutilized core doesn’t count as an idle GPU. It should also be idle for a non-negligible amount of time.
Narrow product development
Taking the general purpose AI systems that companies have made and turning these into products counts as a non-capabilities activity, assuming that this doesn’t make general AI systems more capable or enable faster capabilities progress. Work on separate narrow models also counts as a non-capabilities activity, again, assuming this doesn’t make general AI systems more capable or enable faster capabilities progress.
The activities that count as narrow product development are using AI labor to develop products or narrow models, and running R&D experiments for developing the product or narrow model. Examples include integrating AI into software or physical devices, training protein-folding models, recommendation algorithms, engagement algorithms, or using AI to generate ads.
Serving customers
Most forms of serving inference to external customers are non-capabilities activities. The main exceptions are:
- If the AI company outsources capabilities-relevant tasks to customers.
- If the AI company trains on its interactions with customers.
- If the customers themselves use models to help with AI R&D tasks.
Serving inference to company employees should generally be considered a capabilities activity. However, inference for internal company employees who aren’t scientists and aren’t working on AI R&D (namely: company lawyers, marketing teams, HR teams, and communications teams) is considered a non-capabilities activity.
Narrow safety activities
Some forms of safety work seem distinct enough from capabilities work that we consider them non-capabilities activities. We define narrow safety activities to be any of the following: (1) evaluating model alignment, (2) testing and improving company security, (3) research that could improve safety and isn’t too dual-use, (4) monitoring, (5) running misuse classifiers, or (6) incident investigation.
- Evaluating model alignment. Alignment evaluations aim to determine whether a model would exhibit some behavior, as opposed to whether it could solve some task.
- Testing and improving company security. This applies only to security work for company-internal infrastructure. If companies are iterating against the results of “pen tests” to make models more capable, then that counts as a capabilities activity.
- Research that could improve safety and isn’t too dual-use. We specify a whitelist: interpretability research, CoT informativeness research, model persona research, model organisms research, and theoretical work on alignment without near-term applications to improving capabilities.
- Monitoring. Running monitors to detect bad behavior is a safety activity, provided they are not used as part of an optimization loop to select model improvements.
- Running misuse classifiers. Running classifiers to check if users are trying to use LLMs to cause harm.
- Searching for and investigating misalignment incidents. Searching for and investigating egregious misalignment incidents counts as a non-capabilities activity.
Capabilities activities
AI company activities are considered capabilities activities by default, unless they fall into any of the categories above. This includes:
Central capabilities activities
- New production pretraining and post-training runs.
- Distillation.
- Building and running capabilities evaluations and benchmarks.
- Improving kernels or optimizing inference.
- AI R&D experiments not classified as safety or narrow product development.
- Designing scaffolds, prompts, or skills that could make models better at coding or AI R&D.
- Designing hardware accelerators.
- Obtaining, filtering, grading, or creating data to use in AI R&D.
Safety work that might improve capabilities
We classify the following as capabilities activities because they are hard to distinguish from capabilities-driven work:
- Work on debate or “scalable oversight”.
- Work on conceptual reasoning capabilities or solving fuzzily specified tasks.
- Running control, monitor, or dangerous capabilities evaluations.
- Running “constitutional AI” / RLAIF.
- Training monitors or misuse classifiers.
- Training for jailbreak robustness.
- Improving RL environments or patching broken ones.
Product work that might improve capabilities
Some work on consumer product development that might yield generally-applicable intelligence or algorithmic improvements should be classified as capabilities work, such as building products that require training general-purpose models for specific domains (like math or legal research), scaffolding models for coding/research, robotics, or work on voice/video/image models.
Unknown or ambiguous activities
If an activity doesn’t clearly fall into any of the non-capabilities categories, it is presumptively considered a capabilities activity.
Conclusion
Pacing the frontier is urgent. We urge AI developers to let third-party auditors measure and report how much compute AI companies are allocating to capabilities and non-capabilities activities, using a definition of these activities broadly similar to the one given in this document.
Jensen Huang Breaks Silence, Signals Willingness to Return as Nvidia CEO
Jensen Huang is signaling openness to returning as Nvidia CEO following his resignation over admitted extramarital affairs and security concerns.
Original article
Jensen Huang says he is willing to return as Nvidia CEO if asked by the directors to do so. Huang has seen an outpouring of calls from Nvidia's employees, investors, business partners, and customers for him to return as CEO. He resigned from the company after admitting to extramarital affairs, including one with a suspected Chinese spy. President Trump said he would support Huang being reinstated and that he believed Huang had learned a big lesson.
Making sense of Recursive Self Improvement
Anthropic researchers report that the rate of progress in their AI R&D has doubled since October 2025 due to recursive AI-driven improvements.
Decoder
- Recursive Self Improvement: The process by which an AI system is used to improve its own source code, training data, or architecture, theoretically leading to an exponential growth in capabilities.
- ASI (Artificial Super Intelligence): An AI system that surpasses human intelligence across all domains, including creativity, general wisdom, and social skills.
Original article
The rate of progress in AI R&D has roughly doubled at Anthropic since October 2025. Most of the acceleration is attributed to Anthropic's own use of AI in R&D. Recursive improvement in AI models is already happening. ASI will likely have unfathomably large improvements over the best human in verifiable domains and only fathomably large improvements in hard-to-verify domains.
My Empire of Sunshine and Roses
George Hotz argues that the ideal future for AI avoids central planners and singleton models in favor of competitive, decentralized markets.
Decoder
- Singleton: A theoretical AI system that effectively holds a monopoly on intelligence and power, preventing the emergence or success of other powerful AI systems.
Original article
I spent a lot of time thinking about differential history. What it means to change the world isn’t to have a pile of stuff that people say is yours or a pile of accomplishments that people say are yours. That’s just credit assignment, which is notoriously hard even without all the adversarial noise. No, in order to measure changing the world, you have to think in counterfactuals. If you didn’t exist, how would the course of history be different?
You can take a hardline deterministic position, saying that more or less, there was only one way history was going to go. In which case, history class really was just memorizing a bunch of names, places, and dates, and you structurally cannot change the world. I’ve heard that the difference between belief in Great Man and Causes and Forces is just your time horizon.
So it’s probably already determined how AI goes; determined by some 4th order coefficients in a chaotic function, how the balance stacks up between offense and defense and the forces of centralization vs decentralization. These are facts about the map, the great technological optimization landscape we bring up so many times on this blog.
That said, we’re here.
I watched this OpenAI ad this morning, and it shows me that I don’t think these people understand what will happen either. It shows the form of an office, but with all the real work being done in a datacenter thousands of miles away. Why will the office continue to exist?
And with respect to Anthropic, things don’t usually end up well for the main character. While it’s much easier to imagine a singleton than the ritualistic continuation of offices, that’s likely because we’re primed by sci-fi. Nature did not collapse to a singleton, and most AI looking things require exponentially more resources to see linear returns. If you’ve been playing with agent swarms you see this, is it worth 10x the spend to get the work done twice as fast? Is it worth 100x the spend to get the work done three times faster? It breaks down at some point.
It’s a lot easier to imagine bad outcomes than good ones, but the real thing to watch is how the balance between the attacker and defender has shifted. In computer security and cryptography I still can’t tell how this is going to play out. I’m not even sure which way would benefit the individual vs the state.
Perhaps there are some universal answers to this?
What I know for sure is that the best we can hope for is fair markets (against monopolies, against internal models, against vertical integration). Linear spend for linear amounts of compute. Produce more than you consume and you continue to exist, but that bar isn’t that high.
A good world is where there’s millions of independent power centers, all capable of collaborating with they see fit, and imposing small costs on each other when they don’t. And I can’t tell you what that good world looks like, because in that world there is no central planner. There is no one who says what it looks like, it’s emergent from the collective interactions of millions.
Isn’t that the real American Dream?

Technical Debt is Social; it is the Price of Learning by Doing
AI-accelerated code production risks creating a gap where teams can write software faster than they can maintain a shared mental model of it.
Deep dive
- Technical debt is not inherently bad; it is a business strategy for testing assumptions through released features.
- The danger arises when code complexity outpaces the team's ability to maintain 'optionality'—the freedom to adapt the system later.
- 'Agentic' code production can create a 'tragedy of the commons' where local efficiency gains lead to collective maintenance burdens.
- Repayment is now a sociotechnical task that requires humans to be accountable for and actively learn the implications of agent-generated logic.
Decoder
- Sociotechnical: A system approach that considers both the technical requirements and the social/organizational aspects (people, culture, communication) of software development.
- Agentic Development: The practice of using AI agents to autonomously perform tasks like coding, testing, or refactoring with minimal human intervention.
Original article
Technical Debt is Social; it is the Price of Learning by Doing
Technical debt is not necessarily a sign of poor engineering. It can be the price of learning through software in use. As AI accelerates code production beyond our capacity to understand code and context, technical debt increasingly becomes a sociotechnical challenge, Xin Yao noted in her talk "What If Your Biggest Technical Debt Is Social", at GOTO Copenhagen.
Yao quoted Ward Cunningham, who defined debt as "not-quite-right code". Debt sounds like a negative thing, but it can be a deliberate business strategy, she explained:
If we release the code now, well knowing it’s not perfect for the future yet, we’ll get some business feedback, we’ll get some user feedback, we’ll probably get paid for something, and that’s good as a business strategy.
Debt isn’t about poorly written code; it arises when we design software with incomplete knowledge. Hence, debt is the price of learning by doing, Yao argued. Releasing software allows us to test our assumptions against reality. Once we’ve got a learning experience, we have to put that experience back into our code and pay off the debt, she added. The debt becomes problematic when our software doesn’t catch up with our new learning.
Debt can be a good communication strategy toward management. It provides an economic argument for the cost of postponing architectural improvements. However, framing technical debt solely as something to eliminate misses its strategic value. The question is not whether to incur debt, but whether the learning it enables justifies the cost, and whether we actually repay it.
Yao referred to Kent Beck’s article "Earn and Learn," which explores features vs. futures. Features deliver value today, while the future is actually the optionality to adapt those features, Yao explained:
Every bit of code already coded is complexity and a constraint. Every feature removes some future. If you go on producing features, maybe using your LLMs, then at a certain point, all you can do is use your capacity to pay the interest, to fix the code, and you can no longer release features.
The challenge is to balance delivering features with preserving future options, Yao said. Sometimes, delaying a design commitment preserves options until we know more, and this includes postponing some upfront architecture decisions to the last responsible moment as well. As Beck argues, waiting is not laziness; waiting is holding an asset.
Technical debt can therefore be understood as learning made visible in software. We design based on what we know, observe software’s impact, modularity, and its architecture’s implications, and we update our understanding, Yao explained:
The software no longer fits what we now understand, and yesterday’s good understanding becomes today’s debt.
AI introduces a new challenge: software can now be produced faster than teams can develop a shared understanding of its behavior, design decisions and consequences, Yao argued.
Agentic coding makes debt repayment more complex; beyond addressing poorly written AI-generated code, teams must close the gap between what the software actually does and what they understand it to do, while ensuring the code keeps pace with their evolving domain and architectural understanding. Paying off debt is no longer just a technical task, but a sociotechnical one, Yao concluded.
InfoQ interviewed Xin Yao after her talk.
InfoQ: What does learning from technical debt look like, and what benefit does it bring?
Xin Yao: We design and release software based on our best current understanding, then test our assumptions against business and user reality. Paying off debt means incorporating that learning back into the software and closing the gap between what we knew when we released the first iteration and what we know now.
Each iteration creates new debt and new learning. Small batches and tight feedback loops help teams retain the memory of their initial design decisions and continuously repay the old debt with new learning.
InfoQ: What does technical debt look like now that developers are using artificial intelligence?
Yao: With agentic coding, software production can outpace human understanding. Code increasingly becomes a fossil record of agents’ decisions, while humans remain accountable for its consequences. Local productivity gains can create collective costs: more code, weaker ownership and growing gaps in shared understanding.
A study on How Developers Discuss the Burden of AI-Assisted Software Development describes this as "a tragedy of the commons". The danger is not merely more poorly written agentic code, but accelerated learning debt across the sociotechnical system.

For platform teams, the challenge is the way
Successful platform engineering teams treat 'challenges' like tooling sprawl as indicators of progress, while 'obstacles' like poor strategy remain failure signals.
Decoder
- Golden path: A pre-approved, streamlined workflow provided by a platform team to developers, designed to simplify common tasks like deploying or provisioning.
Original article
Full article content is not available for inline reading.
Set storage IOPS and throughput when restoring Postgres backups
PlanetScale now allows users to explicitly configure storage IOPS and throughput when restoring Postgres backups to a new branch.
Decoder
- IOPS (Input/Output Operations Per Second): A standard metric to measure the performance of a storage device.
- Throughput: The amount of data that can be transferred between storage and application per unit of time.
Original article
Set storage IOPS and throughput when restoring Postgres backups
Postgres backup restores will now let you set storage IOPS and throughput for the new branch. Large restores are often limited by disk throughput, so this lets you speed up a restore without choosing a bigger cluster size than the branch needs.
You'll find the new settings in the Restore to new branch dialog for branches on AWS network-attached storage. The settings stay on the restored branch, and you can change them later from its storage settings.
You can also set them from the CLI with --storage-iops and --storage-throughput:
pscale backup restore <DATABASE_NAME> <NEW_BRANCH_NAME> <BACKUP_ID> \
  --storage-iops 5000 --storage-throughput 300
Through the API, set storage_iops and storage_throughput_mibs in the storage object when you create a branch from a backup or a point in time.
Build Launch Videos from a Prompt (Website)
OpenMotion enables creators to generate editable motion design scenes directly from text prompts.
Original article
OpenMotion turns a prompt into editable motion scenes, with a real canvas and timeline to refine and export the result.

April Zhu on Taste, Judgment, and Designing with AI
Designer April Zhu argues that while AI can handle production and brainstorming, the core of design lies in human taste and judgment.
Deep dive
- Focus on using AI to brainstorm large volumes of variations rather than relying on it to make final creative decisions.
- Maintain a clear distinction between the tool used (AI, Figma, Photoshop) and the output, which should be judged solely on human taste.
- Designers are increasingly shifting toward 'AI-native' workflows that bypass traditional heavy tooling like Photoshop.
- Future UX will likely move toward dynamic, personalized interfaces rather than static design systems.
- Professionals should remain wary of the 'hedonistic treadmill' where increased productivity leads to more work rather than more leisure.
Decoder
- Vibe-coding: A dismissive term for AI-generated code or design that 'feels' correct at a surface level but lacks underlying structural quality or intentionality.
- Third place: Social environments separate from the two primary environments of home and work, such as parks, libraries, or cafes, which are essential for community spontaneity.
Original article
Full article content is not available for inline reading.
Why Enterprise Dashboards Fail Even When They're Well Designed
Enterprise dashboards frequently fail because they address design aesthetics while ignoring the underlying organizational trust and data governance issues.
Original article
Enterprise dashboards can fail despite excellent visual design because adoption depends on organizational trust, shared definitions, and established workflows rather than charts alone. When different departments interpret the same metrics differently, even accurate dashboards become unreliable, while competing priorities and requests for additional features can undermine their usefulness. Establishing governed metric definitions, involving stakeholders in decisions, and addressing the social dynamics surrounding data can improve adoption more effectively than repeatedly refining visual layouts.
UX Trends for 2027: Seven Shifts Shaping the Future of UX Design
UX design is shifting toward agentic interfaces and generative UI as AI becomes both the designer and the primary user of digital products.
Deep dive
- Interfaces will move from static layouts to adaptive, generative experiences that respond to user intent.
- Designers must begin accounting for non-human users (AI agents) as a primary interface target.
- Agentic design prioritizes outcomes over navigation, often reducing the need for traditional page-based flows.
- Personalization will shift from simple user data to deep context-aware interfaces generated by LLMs.
- Ethical design will evolve to include transparency regarding whether a user is interacting with a human or an automated system.
Decoder
- Agentic interface: A UI designed for an AI system capable of executing complex, multi-step actions on a user's behalf.
- Generative UI: User interfaces that are dynamically constructed or adjusted in real-time based on context and user input, rather than being hard-coded by developers.
Original article
Seven shifts will shape UX design in 2027, including agentic interfaces, generative UI, and AI agents as users.
Become a founding member of TLDR's AI community (2 minute form)
TLDR is opening applications for a curated, community-led space for AI builders.
Original article
TLDR is launching a curated community for AI builders to discuss major news and launches. The best links and comments will be featured in TLDR AI. Apply here to join.
Microsoft-Decision-1.1 is now generally available for fast, low-cost decision making
Microsoft has released Microsoft-Decision-1.1, a model optimized for low-latency, calibrated decision-making under uncertainty.
Original article
Microsoft's decision models are designed to make calibrated decisions in the face of uncertainty across a wide range of real-world software use cases.
Uber and Zipline's drone delivery service takes off in Texas, with dozens of cities to follow
Uber Eats and Zipline have commenced commercial drone deliveries in Spring, Texas, with plans to scale to dozens of U.S. cities by 2029.
Original article
Zipline and Uber Eats have launched a commercial drone food delivery service in Spring, Texas. Drone delivery will be limited to participating restaurants at launch. The drones can carry orders that weigh up to eight pounds. They can fly at about 300 feet above the ground at speeds of up to 70 miles per hour. The companies plan to expand drone delivery to dozens of additional cities in the US by the end of 2029.

How do you become known as a good engineer?
Building a reputation as a 'good engineer' requires focusing on high-quality projects, joining niche communities, and effectively documenting your technical contributions.
Original article
Being a good engineer requires more than just writing code all day. The best engineers are part of a network of experts who they can work together with or ask advice from. Larger networks enable them to do better work. Being well known has other benefits too, like not having to apply for jobs.

Some Nvidia directors continue push to bring Huang back
Despite board rejection, some Nvidia directors are secretly lobbying to bring back ousted CEO Jensen Huang.
Original article
Former Nvidia CEO Jensen Huang has met with a number of tech executives and spoken with at least one board member about the possibility of his return.
Monotype Launches Brand Font Panel for Adobe Creative Apps
Monotype's new Connect panel embeds approved brand font libraries directly into Adobe Creative Cloud applications, aiming to reduce manual font management.
Original article
Monotype Connect, a new panel for Illustrator, Photoshop, and InDesign, debuted at Adobe MAX 2026 and puts teams' approved brand fonts inside the apps. It flags fonts outside a chosen library and leaves replacement to designers.
Pentagram draws on ancient Greek coinage for Alpha Bank identity refresh
Pentagram refreshed Alpha Bank's identity by modernizing the geometric aesthetic of an ancient Aegina silver stater coin.
Decoder
- Silver stater: A standard ancient Greek silver coin that was frequently stamped with distinctive city-state symbols, such as the turtle of Aegina.
Original article
Pentagram has refreshed Greek financial institution Alpha Bank's identity, drawing inspiration from an ancient silver stater of Aegina that originally influenced the bank's 1972 logo. The redesigned emblem preserves the coin's distinctive geometry and subtle asymmetry, accompanied by a custom Greek and Latin typeface called Alpha Sans, an expanded color palette, and patterns derived from the symbol. Developed around the positioning "Building progress, together," the system extends across digital products, communications, and redesigned physical branches, balancing the bank's cultural heritage with a more contemporary identity.
New camera sensor coming to the iPhone 20 Pro's main camera, says leaker
Rumors suggest the upcoming iPhone 20 Pro will feature a new main camera sensor built on a 17-nanometer process.
Decoder
- Logic process: The manufacturing method used to create the image signal processor (ISP) components of a camera sensor, which handles the conversion of raw light data into digital images.
Original article
Apple's rumored iPhone 20 Pro could introduce a new main camera sensor manufactured using a 17-nanometer logic process. Previous reports have suggested that Apple is exploring larger camera sensors for future iPhones, including a possible 200-megapixel telephoto sensor, although the latest leak doesn't confirm whether the main sensor will grow in size. A larger sensor could improve low-light photography and overall image quality, but the specifications and potential benefits of the new component remain unknown.
Google's Yi Xiang on how to build a design career across global borders
Google designer Yi Xiang argues that building a global career requires viewing one's portfolio as an evolving laboratory for creative coding experiments.
Decoder
- Creative coding: Using programming languages (like p5.js or Three.js) to create visual, interactive, or generative art, often used by designers to prototype unique UI/UX concepts.
Original article
Google senior UX designer Yi Xiang has built an international career spanning China, Canada, Hong Kong, and the United States, learning to adapt to different creative cultures without abandoning his own perspective. His experience highlights the importance of seeking honest feedback, understanding local communication styles, and developing confidence through experimentation and continuous learning rather than trying to fit a predetermined professional identity. Creative coding and personal projects also provide opportunities to explore new technologies, develop distinctive skills, and demonstrate capabilities beyond conventional portfolio case studies.
What Makes Icons Feel Professional
Professional-grade icon sets succeed through deliberate restraint and a consistent conceptual point of view, rather than just technical alignment.
Deep dive
- Consistency is a baseline requirement, not the differentiator for professional quality.
- A 'point of view' guides decision-making before technical grids are even applied.
- Excessive detail creates noise; professional icons keep only what makes them recognizable at a glance.
- 'Finished' icons require refinement of small details—such as curves and spacing—that a basic consistency check might miss.
- A reliable library must provide variants and specific actions to prevent 'workaround' drift.
Original article
Consistency alone does not make icons feel professional - a clear point of view, restraint, careful finishing, and a growing library do.
