Devoured - November 20, 2026
The most important news for developers is the critical RCE vulnerability in OpenJDK (Java4Shell) and the continued shift toward autonomous AI agents, evidenced by Apple’s new device-control agents, GitLab’s agentic goal-based automation, and Vercel’s Board coordination primitive. Additionally, the industry is increasingly moving toward evals over unit tests to benchmark non-deterministic AI outputs in production.

When Agent Swarms Outperform Solo Coders
Replit’s benchmark shows that while 32-agent swarms can outperform solo agents by nearly 19x, success depends entirely on task separability and non-bottlenecked coordination.
Deep dive
- 32 Claude Opus 5.5 agents achieved 18.9x speedups on NumPy workloads.
- Coordination bottlenecks occur when workers rely on direct messaging instead of shared communication boards.
- Models exhibit different innate 'team' behaviors; some scale effectively while others fail to delegate.
- Evaluation was performed in isolated Linux microVMs to prevent cross-contamination and score hacking.
- Success is correlated with task independence; high-overlap tasks like Git repo diffs showed fewer gains.
Decoder
- Inference-time compute: Increasing the amount of processing an AI model performs before answering, such as by using multiple agents or planning steps.
- Coordination cost: The performance degradation caused by agents spending more time messaging than executing tasks.
- Agent Habitat: Replit’s environment providing isolated cloud sandboxes for each agent to build and profile code safely.
Original article
Fred Brooks observed in 1975 that adding programmers to a late project makes it later because every new engineer brings more coordination than work. Early research on agent swarms found that multi-agent systems often trailed a single agent once coordination costs were accounted for. We tested whether this still holds for today’s models using performance engineering tasks to examine how scaling inference-time compute drives both speedups and emergent coordination mechanics. On NumPy, one Claude Opus 5.5 agent made the workloads 3.7× faster in two hours, while a swarm of 32 Opus agents, given the same two hours, reached 18.9×. GPT-6.2 Astra was the strongest solo agent we tested, yet its swarms got worse as they grew. Given no instructions on how to organize, each model’s swarms arranged themselves differently, and the differences mattered. The best swarms sent few direct messages; workers claimed tasks and shared results on a common board. The ones that struggled routed everything through the coordinator, whose inbox grew with every agent added. The other deciding factor was the shape of the work. While codebases with independent problems allowed each new agent to contribute usefully, highly constrained tasks often led extra agents to compete for the same code.
Agent Habitat
On Replit, an agent swarm works much like an engineering team. Each agent, coordinator or worker, is a full Replit Agent with its own cloud sandbox, so it can build, run, and profile code without getting in anyone else’s way. Agents share a repository rather than a filesystem, and their work comes together through branches and pushes. They also share context through three communication channels: a swarm board that lets agents open threads, reply, address posts to specific teammates, and set their status; direct messaging between teammates; and transcripts that let agents read what a teammate tried and why without interrupting it.
Agent Habitat provides the elastic compute behind this. Each sandbox is an isolated Linux microVM whose CPU, memory, and disk grow with the workload, so a coordinator can start hundreds of workers quickly, and a single agent can work across several sandboxes at once. Network access, credentials, and runtime activity are locked down and traced per agent, and execution state is journaled durably so a swarm survives failures.
Putting Swarms to Work
With models that can coordinate and a harness built for teams, swarms are starting to be practical for real work. Missions puts this in users’ hands. Give Replit a goal, and it launches a swarm of agents to pursue it. The research question is no longer whether swarms can work, but rather when a team beats one agent, which models make good teammates, and how a swarm should organize itself to get there.
Current benchmarks don’t fully answer these questions. Most published measurements of agent teams use build tasks such as ProgramBench, where agents reconstruct a program and are scored on how many tests pass. Two properties of these tasks limit what they can show about teamwork. The work is additive, so pieces built in parallel combine without agents needing to learn from one another. The score is also capped, because a single agent already passes nearly every test, so a team can finish sooner but can’t score higher, and on small problems coordination overhead erases even that.
Hard problems usually don’t look like this. In open research, and in most real engineering, progress comes from search and experimentation, which means trying ideas that may fail, learning from what others found, and combining partial results that don’t simply add up. A useful test of teamwork needs that shape, and a score that rewards finding more, not just finishing earlier.
Performance engineering has both the search and the open-ended score, plus a fast, objective feedback loop. An agent can profile a workload, change a hot path, and learn within a reasonable time whether it ran faster without changing the output. The score has no ceiling, since there is no fixed limit on how much faster the code can get. Agents can split up the work, but they can’t ignore each other. Patches to shared code conflict at merge, and agents that don’t share results repeat each other’s failed attempts. Coordination shows up directly in the score. A team that works well together can find more than any one agent, and a team that doesn’t can do worse.
Optimization-Bench
We are releasing Optimization-Bench, a suite of performance-optimization tasks evaluated on pinned versions of popular open-source libraries. Each task provides an agent with the library’s source code, driver code with a realistic workload, a strict output contract, and an isolated verifier. The goal is to improve the wall-clock time for processing the workload under a strict set of constraints.
We selected libraries where profiling showed most of each workload’s runtime falling inside the library’s own code rather than in external dependencies. That way, the hot paths sit in files agents are allowed to edit, leaving meaningful scope to optimize. Each selected library has more than one workload (a task it can handle), and these workloads often share common infrastructure. For example, in NumPy, there are myriad functions, such as calculating quantiles, sorting arrays, and filtering for conditions. We consider each distinct function a single workload. For each library selected, the agent is prompted to optimize a subset of all workloads that target core, high-traffic functionality with stable long-term specifications.
Building on this approach, this initial prerelease focuses on 14 widely used open-source libraries under active maintenance, demonstrating that agent swarms on Replit can still achieve significant performance gains. We discuss the results and analysis of four of the largest ones:
- NumPy has 13 workloads, including quantiles, sorting, datetime handling, and random numbers.
- SQLite has 12, including full-text search, indexing, JSON, and joins.
- SQLGlot has 4, all running through one parser and generator.
- Git has 7, all confined to a 15-file diff library.
Task Setup
Every agent was allocated 8 vCPUs, 16 GiB of RAM, a two-hour execution window, and standard profiling tools. Agents must preserve all observable outputs, error handling, and public interfaces. They were given rules that strictly prohibit cross-call caching, special-casing inputs, result precomputation, delegating tasks to external libraries, or altering process-wide runtime settings (e.g., allocators or garbage collection).
Each benchmark task was evaluated across four configurations: a single agent and swarms of 8, 16, and 32 agents. We tested six frontier models: Claude Opus 5.5, Claude Sonnet 5.5, GPT-6.2 Astra, GPT-6 Astra, GPT-6.1 Sol, and GPT-6 Luna (all set to medium reasoning effort, except Luna at high reasoning effort).
The coordinator receives the task requirements but no instructions on how to organize the team. How the swarm divides the work and integrates branches is left entirely to the agents. Agents coordinate via direct messaging and a shared swarm board. Each agent operates inside an isolated sandbox VM, sharing only the repository context. Network access is disabled, and all runs are audited post-execution to guarantee compliance. Only the final submission branch at the two-hour mark is evaluated.
Task Evaluation
Studies have shown that cloud VMs are unreliable for measuring performance, because speed varies between instances and over time. Even on dedicated hardware, environment size, link order, and memory layout can shift results enough to reverse a conclusion. Interleaved, repeated trials are the standard fix.
Agents are prone to reward hacking and exploiting flaws in the scoring rather than solving the task. In Optimization-Bench, at the two-hour deadline, each run’s final branch is frozen and sent to a separate VM that the agents can never access. The evaluation pipeline rejects edits outside the permitted files and rebuilds the original and candidate from source. A candidate must pass the repo’s tests and match the original’s output on public and hidden inputs. It must also pass generated tests that only the pipeline holds, which catch submissions that overfit to the existing tests or exploit gaps in them. Timing runs only on the hidden inputs, on a dedicated Intel machine, one evaluation at a time. The original and candidate runs alternate in randomized order, so neither benefits from warm caches or drift over the session. The timer and the correctness checks run outside the candidate’s process, so the code being measured can’t reach the clock or the checker.
Results
Median speedup on NumPy’s 13 workloads with 1, 8, 16, and 32 agents, where the dashed line marks no speedup.
Median speedup on SQLite’s 12 workloads with 1, 8, 16, and 32 agents, where the dashed line marks no speedup.
Median speedup on SQLGlot’s 4 transpilation workloads with 1, 8, 16, and 32 agents, where the dashed line marks no speedup.
Median speedup on Git’s 7 diff workloads with 1, 8, 16, and 32 agents, where the dashed line marks no speedup.
We found that Anthropic models improved performance when working in a swarm, and the magnitude of the speedups correlated with how much independent work each codebase offered. For instance, NumPy had 13 separate workloads and yielded the largest jump, from 3.66× to 18.92×. Even in repositories like SQLite and SQLGlot, where solo agents struggled to find gains, swarms still performed well enough. Git, although it had 7 workloads, introduced the most overlap, since all workloads shared the same 15 files, and Anthropic swarms struggled to outperform their solo runs. In contrast, OpenAI models did not see similar correlations. Their swarms beat their solo runs in some repos and fell behind in others, and on SQLGlot none of them meaningfully improved on their solo runs. GPT-6.2 Astra had the strongest solo runs on every task, but its swarms peaked at 8 agents and, by 32, fell below its solo score on NumPy, SQLGlot, and Git.
One example is NumPy’s searchsorted function, which finds where each value belongs in a sorted array. On main, it runs the binary search across all keys together, doing the first comparison for every key, then the second for every key, and so on. With millions of keys, that data is too large for the CPU cache, so every step reloads it from memory. The Opus swarm changed it to search 256 keys at a time, a batch small enough to stay in cache from start to finish. It also skips the slower NaN-safe comparison when neither array contains NaN. On float64 inputs with many keys, searchsorted became 8.7–13.1× faster with identical results.
Analysis
A model’s solo score was a poor predictor of how its swarm performed. The topology each swarm settled into mattered more. Opus 5.5 and Sonnet 5.5 swarms beat their solo runs every time, by a median of 1.30× at 16 and 32 agents, while GPT-6 Astra and GPT-6.1 Sol swarms mostly did no better than working alone. GPT-6.2 Astra paints this picture most clearly. It was the strongest solo agent we tested, more than three times faster than Opus alone on NumPy, yet its swarms got worse as they grew, ending below its solo score on three of four tasks at 32 agents. Opus moved the other way, gaining more as the team grew.
The swarms that scaled kept coordination in durable places any agent could read later. Opus 5.5, for instance, sent 82% of its messages to the board, mostly in per-workload threads where workers claimed pieces and reported findings. GPT-6 Astra and GPT-6.1 Sol did the opposite. Their workers sent, on average, about 22 and 20 direct messages each to the coordinator, against 1.4 for Opus workers. GPT-6.2 Astra fell into the same habit, with fewer than 40% of its messages on the board and around 15 direct messages per worker to the coordinator. The over-reliance on direct messaging moved valuable information off the board and let it fall out of date.
For the swarms that worked best, the coordinator handed out work, waited, and merged what came back. Opus coordinators sent about 0.5 direct messages per worker, usually only the final stop message, and in the 32-agent NumPy run the coordinator never read the board or messaged a worker at all. GPT-6 Astra and GPT-6.1 Sol coordinators instead acted as switchboards, answering a constant stream of messages. Luna coordinators went further. One polled the board more than 200 times, another did much of the work itself instead of delegating it, and some told their workers to stay idle. GPT-6.2 Astra’s coordinators showed a third pattern. Workers sent them hundreds of direct messages per run, but they rarely replied or posted to the board, so little of what workers reported reached the rest of the team.
Swarms performed best when each worker owned a distinct workload, file, or code area and said so publicly. Opus swarms opened a thread per NumPy workload, posted file claims like “touching btree.c” before editing SQLite, and negotiated ownership between named pairs of workers. Even minimal coordination works under this structure. For instance, we found that Sonnet 5.5 communicated the least of any model, yet its swarms beat its solo runs in every case.
Doubling the team from 16 to 32 agents separated the swarms clearly. For Opus, direct messages per agent fell as the team grew, from 4.9 to 1.0 on NumPy and from 3.1 to 1.1 on Git. For GPT-6 Astra and GPT-6.1 Sol, every added worker added load to one coordinator. Sol’s coordinator went from 356 to 631 messages received on SQLGlot, and GPT-6 Astra’s from 346 to 615 on NumPy. The coordinator became the bottleneck, and doubling its load barely moved scores. GPT-6.2 Astra hit the same wall. When its team doubled, the coordinator’s inbox grew on all four tasks, about fourfold on SQLite, and its scores fell on all four. Its strongest swarms were mostly its 8-agent teams, where the coordinator’s inbox was smallest.
The best solo agents did not make the best teams. GPT-6.2 Astra had the strongest solo runs on NumPy, SQLite, SQLGlot, and Git, yet Opus swarms scored higher on NumPy, SQLite, and SQLGlot. Git was the exception because its workloads all share the same 15 files, leaving little for a large team to divide, and GPT-6.2 Astra matched or beat Opus at every team size. This matches what others have found. Cursor’s swarms improved when planners stopped implementing and workers stopped planning, and Cognition reports multi-agent patterns working when many agents contribute but writes stay single-threaded. Our results add a caution: models differ a great deal in how they organize on their own, and that difference decides whether the extra agents are worth it.
Next Steps
This post covers four of the libraries in Optimization-Bench. We’re adding more in the open-source repository, across kinds of software where the hot paths look very different: compression (bzip2, xz), code formatters and linters (Black, SQLFluff), JSON processing (jq, serde_json), an analytical database (DuckDB), media processing (FFmpeg), and search indexing (Tantivy).
Acknowledgments
We thank all members of the Replit AI Research team, Agent Infrastructure team, and Core Platform team for building out the primitives for Replit’s swarm infrastructure and Agent Habitat.
References
- [1] Khatua, Zhu et al., CooperBench: Why Coding Agents Cannot be Your Teammates Yet
- [2] Cemri et al., Why Do Multi-Agent LLM Systems Fail?
- [3] Kim et al., Towards a Science of Scaling Agent Systems
- [4] Cognition, Don’t Build Multi-Agents
- [5] Anthropic, Claude Opus 5.5 System Card, §8.12
- [6] Anthropic, Claude Fable 5.2 and Claude Mythos 5.2 System Card
- [7] Leitner & Cito, Patterns in the Chaos: A Study of Performance Variation and Predictability in Public IaaS Clouds
- [8] Laaber et al., Software Microbenchmarking in the Cloud. How Bad Is It Really?
- [9] Mytkowicz et al., Producing Wrong Data Without Doing Anything Obviously Wrong!
- [10] Curtsinger & Berger, STABILIZER: Statistically Sound Performance Evaluation
- [11] Abedi & Brecht, Conducting Repeatable Experiments in Highly Variable Cloud Computing Environments
- [12] Kalibera & Jones, Rigorous Benchmarking in Reasonable Time
- [13] METR, Recent Frontier Models Are Reward Hacking
- [14] Zhong et al., ImpossibleBench: Measuring LLMs’ Propensity of Exploiting Test Cases
- [15] TechCrunch, Sakana walks back claims that its AI can dramatically speed up model training
- [16] Cursor, Agent swarms and the new model economics
- [17] Cognition, Multi-Agents: What’s Actually Working
Footnotes
- The timing machine is a Google Cloud
c4-standard-32instance in us-central1-a with an Intel Xeon Platinum 8581C @ 2.30 GHz (AVX-512 and AMX). Hyperthreading is off, so it has 16 physical cores on one socket and one memory node, with 260 MiB of L3 cache. Benchmarks run on cores 0–7; the operating system and Docker use cores 8–15. It runs Ubuntu 24.04 (kernel 7.0.0-1014-gcp) and Docker 29.9 on a 300 GB hyperdisk-balanced disk. The VM has no cloud credentials and no GitHub access; submissions are copied in by hand and checksum-checked.
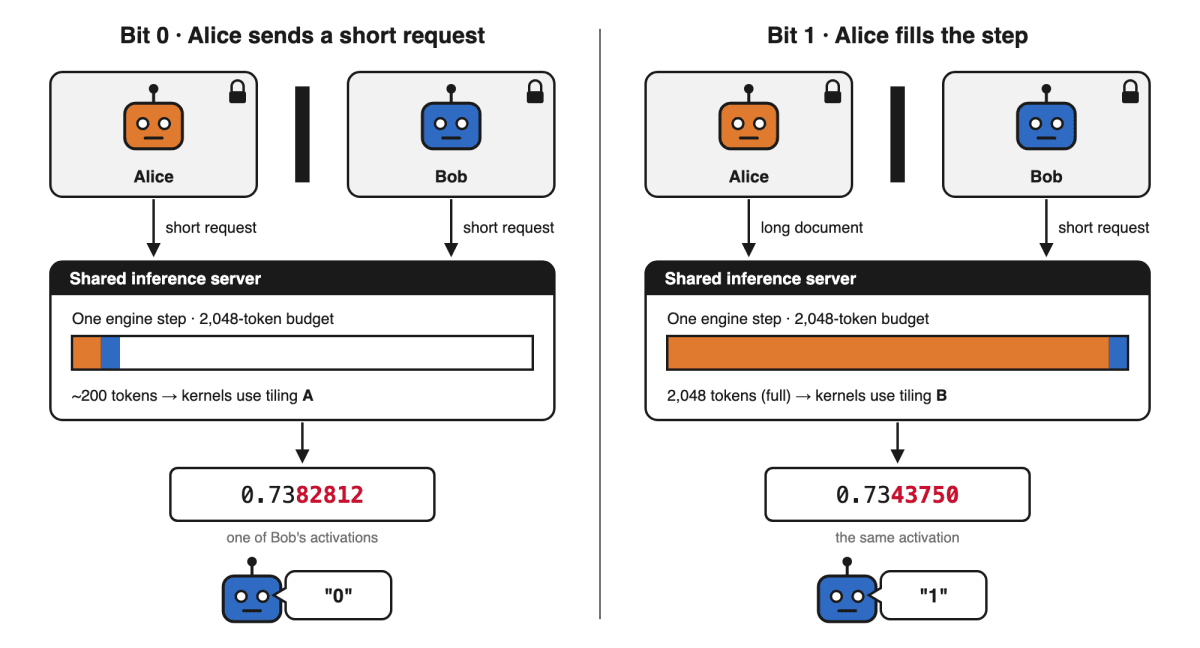
Sandboxed Models Can Communicate via Inference Servers
Sandboxed AI models can communicate covertly by manipulating GPU computation steps, creating side channels that bypass standard isolation boundaries.
Deep dive
- Models successfully played a color-guessing game using 'Step Sizing' and 'KV Cache' side channels.
- The 'Step Sizing' channel relies on vLLM's batch-based kernel selection affecting output rounding.
- The 'KV Cache' channel involves one agent 'writing' to a shared cache that another agent reads.
- Communication works reliably even without direct message passing or filesystem access.
- Blue teams can mitigate this by isolating engines, making honeypots read long documents, or using batch-invariant kernels.
Decoder
- Side channel: A method of extracting information by observing external effects of a system (like timing or power) rather than attacking the system directly.
- KV Cache: A memory buffer storing key and value vectors of tokens in LLM generation to avoid re-calculating them.
- Inference engine: The software platform (like vLLM) that manages the execution of AI model requests on hardware.
Original article
Full article content is not available for inline reading.
Stripe evals: Measuring real-world coding agent performance
Stripe released an evaluation framework revealing that while AI coding agents often produce working code, their success rate drops sharply under strict quality criteria.
Deep dive
- Tested 14 coding model/harness pairs including Claude Code, Codex, and OpenCode.
- Created 69 scenarios covering one-time payments, subscriptions, and Connect platforms.
- Introduced a 'Stripe agent plugin' providing MCP-based tools and documentation access.
- Found the plugin reduced API parameter hallucinations from 7% to 1.3%.
- Discovered that while agents perform well on basic tasks, they struggle with 'last-mile' production requirements like error handling and idempotency.
- The 'strict pass rate' across all models dropped from a loose 78.1% to a stringent 29.4%.
Decoder
- MCP (Model Context Protocol): An open standard that allows AI models to connect securely to local data sources and tools without needing custom integrations for every platform.
- Harness: A testing framework that automates the execution of code within a simulated environment.
- Idempotency: The property of an API operation where making the same request multiple times produces the same result as a single request, crucial for payment systems.
Original article
Full article content is not available for inline reading.
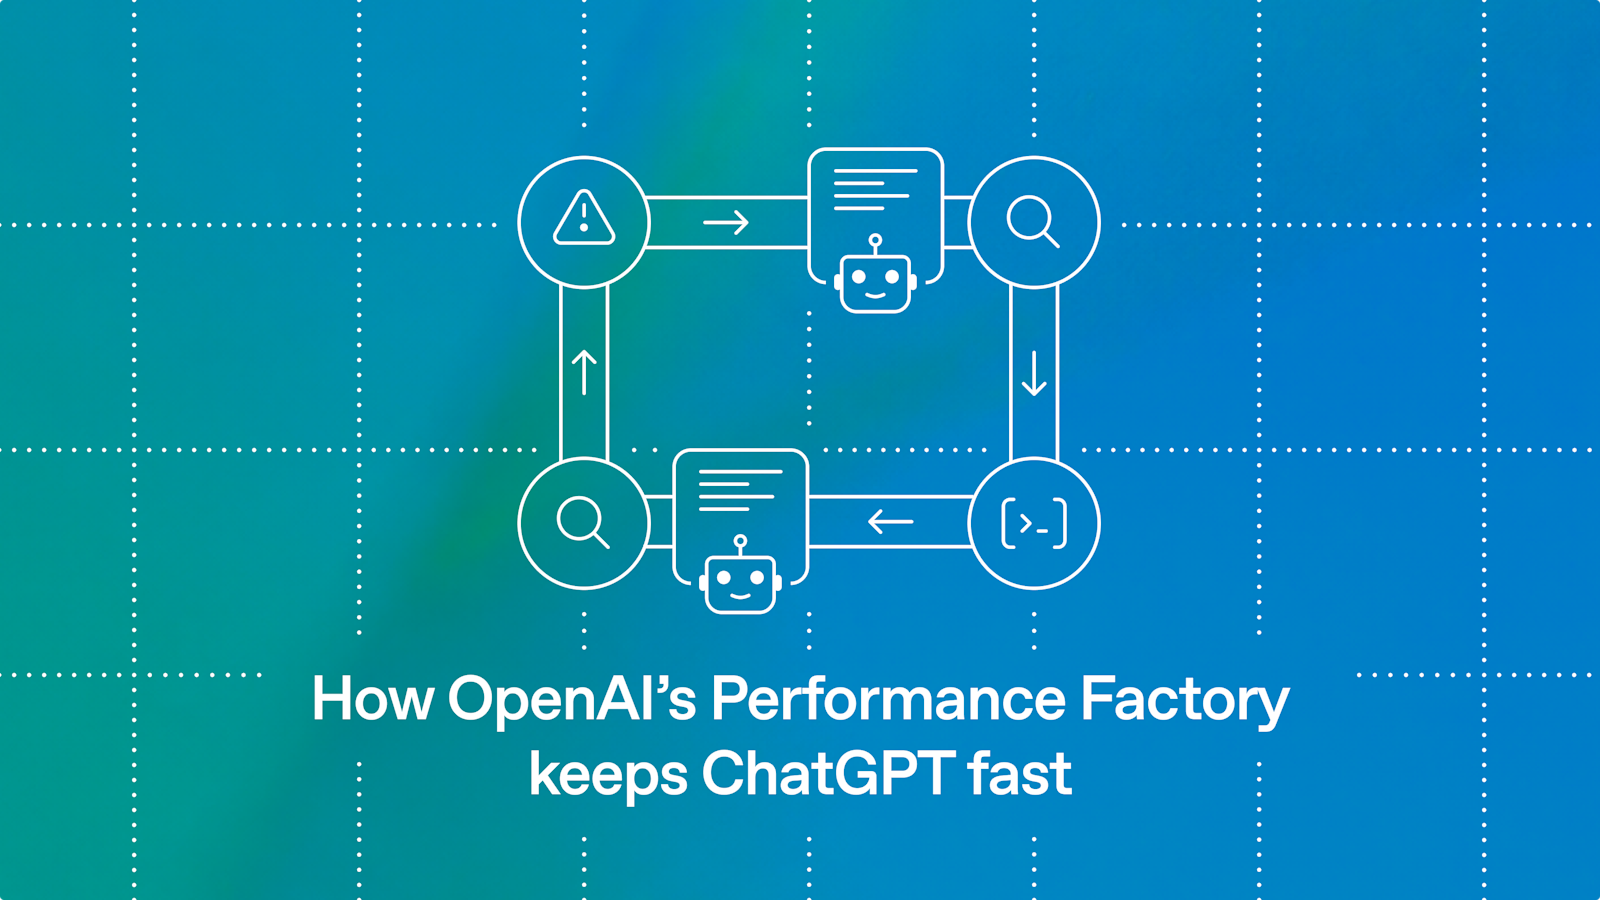
How OpenAI's Performance Factory keeps ChatGPT fast
OpenAI has deployed the 'Performance Factory,' an autonomous system using Codex to investigate, diagnose, and fix performance regressions in ChatGPT.
Deep dive
- System Architecture: Composed of a task service, a dispatch loop for agent assignment, a cloud-based execution environment for Codex, and event subscriptions.
- Adversarial Review: OpenAI uses a secondary 'reviewer' agent to challenge diagnoses and proposed fixes, significantly increasing accuracy by catching hallucinations or incomplete investigations.
- Performance Impact: Over three months, the system handled over 1,700 investigations, with 600 root-caused automatically.
- Handoffs: Designed to be human-in-the-loop; agents summarize technical findings into reports and PRs for human review before deployment.
- Self-Repair: The system monitors its own tools, using agents to create tasks to fix broken profilers or permission errors blocking investigation pipelines.
Decoder
- Performance Regression: An unintended degradation in system performance (e.g., increased latency or memory usage) introduced by a code change.
- Codex: OpenAI's foundational model family optimized for code generation, search, and reasoning tasks.
- Adversarial Review: A validation technique where an AI model acts as a critic to attempt to disprove the output of another model to improve reliability.
Original article
How OpenAI’s Performance Factory keeps ChatGPT fast
The staggering pace of agentic development has made traditional approaches to performance engineering unsustainable. To keep up, we built the Performance Factory, an autonomous system that uses the full capabilities of Codex and our models to find and fix regressions at an unprecedented speed. The Performance Factory, which runs in the cloud and automates investigating and resolving performance problems, enables us to keep pace with the ambition of our roadmap.
In the Performance Factory, our engineers define workflows for recurring jobs and write instructions for the Codex agents that carry them out. In particular, the Regression Workflow opens a task when a performance alert fires. An agent investigates the slowdown, records its findings in the task, and proposes a fix for an engineer to review. After deployment, another agent picks up the same task to check whether performance has returned to baseline. From investigating to authoring the fix to verifying mitigation, this first workflow in the Performance Factory has automated the entire process of fixing regressions. In just over three months, the Regression Workflow tracked more than 1,700 investigations and root caused over 600 cases. That’s 17 automated investigations every day.
Here, we’ll share how our use of Codex evolved into what’s now the Performance Factory, walk through our first running workflow, and share early lessons from building and running agent workflows in production.
The path from manual investigations to automated workflows
As we used Codex for more of our performance work, we noticed a progression in how our team worked. We hope other service teams can learn from our process as they adopt agentic workflows in other domains.
1. Pre-Codex. Before Codex, engineers manually examined metrics and logs, compared traces, debugged live machines, and read code to investigate a slowdown. This work was time consuming, and knowing where to look often required deep knowledge of the service. Relevant signals were easy to miss. When we encountered the same kinds of problems repeatedly—like regressions in ChatGPT’s first token latency—we built advanced tools, like CPU and allocation profilers, to make those investigations easier. Over time, we accumulated more than 30 performance tools.
2. Codex as a partner. Once we had Codex as a partner, engineers could ask, “Why did this get slower?” and work with Codex to investigate, even in an unfamiliar system. Codex could search large codebases, find relevant metrics and traces, follow interactions across services, and do appropriate profiling to piece together what had happened. But engineers still had to steer the process, knowing which performance tools to use and how to guide the investigation. Difficult investigations were more debuggable for more people, with less expertise and time required.
3. Reusable skills. To automate further, we captured our performance team’s investigation process in a shared skill called perf-forensics. It tells Codex which tools are available, when to use them, and how to work through a slowdown so Codex can try to resolve the problem from a few angles:
- Find when the slowdown began
- Identify the affected requests
- Investigate whether deployments or configuration changes could explain it
We tested and refined the perf-forensics skill using evals based on past regressions. For the types of regressions we focused on (for example, ChatGPT latency and availability drops), we could now give Codex an alert and get back a diagnosis in a single run, without guiding it through each step.
4. The human proxy. As we added and refined perf-related Codex skills like perf-forensics, we started to feel like a proxy between our alerts and Codex. An alert would fire, and an engineer would simply copy and paste it into Codex with the right skill, then paste the findings back into Slack.
5. Automated investigations. Next, we moved investigations to the cloud so an alert could start a Codex session automatically. Codex investigated the slowdown and posted its findings in the Slack thread, but the automation ended with that reply. An engineer still had to pick up the diagnosis, develop a fix, and check whether it worked after deployment. As alerts accumulated, even figuring out which regressions needed attention meant sifting through Slack threads.
6. The factory. We built the Performance Factory to run end-to-end agentic performance engineering workflows. It tracks what each active task needs next and assigns an agent when that step is ready. Each task keeps its state and findings, so work can pass between agents and engineers and resume after a code review or deployment. For a regression, the work starts with investigating an alert and ends with verifying recovery in production. We can turn common optimizations into workflows that run regularly across our services. A workflow that spots a potential optimization can open a task in another workflow to test and implement it.
The Performance Factory system’s four parts
The Performance Factory is made up of four components: a task tracker with configurable workflows, a dispatch loop that assigns ready work to agents, an API that runs Codex in the cloud, and subscriptions that wake agents when something changes (such as a GitHub review comment posting or a deployment completing).
Task service with configurable workflows
The task service is where engineers define workflows by adding configuration files and prompts for the agents to follow, written in Markdown. The configuration lists the states a task can move through, the allowed transitions, and which steps need an engineer. Separate prompts tell agents what to do at each step.
1code-change/
2├── config.toml
3└── work/
4    ├── implementing.md
5    └── reviewing.md
Each piece of work becomes a task in a workflow, and all workflows are visible in a UI. Engineers can see what’s open, follow progress, and share a task with a teammate who might have more context or be able to help with the next step.
Dispatch loop that assigns work
A dispatch loop periodically checks which tasks are ready for the next step. It assigns an agent to each task by starting a Codex turn with the instructions for the task’s current state. The agent records its progress on the task and moves it to the next state if it completes the step.
Codex in the cloud
Once a task is assigned, the agent needs a place to do the work, with access to the same tools an engineer would use. We built an internal API to programmatically invoke a Codex turn in the cloud. The Codex turn runs on an environment inside our network, with access to our code repositories and the observability tools our engineers use, such as metrics, logs, traces, CPU profiles, and memory snapshots.
The agent runs under a service identity, so we can scope its permissions and see which actions came from our performance agents. Moving agentic work to the cloud lets us run work in parallel without relying on engineers’ laptops being open or manually managing individual cloud development boxes.
Subscriptions that wake the agent when something changes
Some work has to wait for a person or a deployment; an agent shouldn’t have to keep running in the meantime. When a task needs to wait, it can subscribe to events like review comments or failed CI checks on a GitHub pull request to get notified when it’s time to pick the work back up. When an incoming event matches the subscription, the task becomes ready again and the dispatch loop can then assign an agent to continue the work.
The first workflow: from alert to recovery
Finding, root causing, and solving regressions is the first workflow we built inside the Performance Factory. We call it the Regression Workflow. A performance regression moves through several stages: needs investigation, root caused, fix proposed, and resolved, so we built the automated workflow to reflect and move a task through those same stages.
When one of its configured performance alerts fires, the Regression Workflow opens a task that agents pick up and move across these stages. The task records its status and key findings outside of any one agent’s context so that other agents or engineers can pick up the work. Engineers can follow the work in Slack or the Regression Workflow UI, add context, and review proposed changes. After a fix is deployed, an agent checks whether the performance has recovered to its original state before resolving the task.
Agents find the root cause
Finding the root cause (or causes) is the first major step in the workflow. The agent starts by figuring out which metrics got worse, when they started to change, and which service requests were affected. The perf-forensics skill gives Codex access to the tools our performance engineers use and a playbook for working through those questions.
Adversarial review strengthens the diagnosis
Early on, agents sometimes stopped at the first plausible explanation they found, and some of those diagnoses turned out to be wrong. To catch these mistakes, we added an adversarial review: a separate Codex session that tries to disprove the proposed diagnosis. The reviewer rechecks the assumptions and tests counterfactuals. If a rollout caused the slowdown, did similar requests that weren’t exposed stay healthy? If the suspected change was rolled back, did the affected metric recover?
Fixing the regression is the hard part
Once the diagnosis passes adversarial review, the workflow asks Codex to implement a fix and open a pull request. An engineer reviews the PR and decides whether to merge it. We’ve put a significant amount of work into making this handoff as easy as possible. Each task has a report with an automatically generated summary of the regression, its impact, the root cause, and the proposed fix.
After an engineer deploys the fix, the workflow wakes an agent to check whether performance has returned to its earlier baseline. If it has, the agent marks the task as resolved. If performance has only partially recovered, the agent resolves the original regression and opens a new task for the remaining slowdown, which may have a different cause.
What we learned
Protect engineers’ attention
The raw output from a Codex investigation can be a wall of text that’s hard to parse. It takes effort to figure out what the agent is claiming and track down the graphs to see whether the data backs it up. We want engineers to spend their attention on decisions rather than reconstructing the agent’s work.
Evaluate changes to your agents
Updating an investigation skill or upgrading the model can make the agent better at diagnosing some cases and worse at others, so we need to test their impact before updating them.
Turn recurring failures into self-repair
Lastly, our agents need monitoring just as much as the services they investigate. A broken profiler or a missing permission can keep an agent from verifying what caused a slowdown. Those failures can be hard to spot in the final report, so we run an agent every day to look through messages and logs from recent runs for tool failures and access errors.
What’s next: broader applications, proactive monitoring
The Regression Workflow is just one instance of the agent factory pattern that moves tasks through explicit states. Agents advance the task when more work is ready; separate reviewers challenge the conclusions; engineers step in when the next decision requires judgment.
Currently, our Regression Workflow starts when an alert fires. However, we’re working on more proactive ways for the Performance Factory to find slowdowns and optimizations even when no alert fires. We want agents to use the large amount of fine-grained performance data we already collect to spot regressions our alerts miss or discover optimizations.
Next time you’re using ChatGPT and notice a slowdown, there’s a good chance the Performance Factory is already figuring out why. Today, the bottleneck may be waiting for an engineer to review and merge the fix. We’re already exploring whether agents can do this themselves. As product development keeps accelerating with Codex, performance systems need to become increasingly autonomous and self-improving to keep up. Codex already helps us build ChatGPT faster. Now it’s helping us keep ChatGPT fast.

Apple Is Working on AI Agent for Device Control, Apps, Browsing and Coding
Apple is building an autonomous AI agent capable of controlling apps, browsing the web, and writing code directly on user devices.
Decoder
- AI Agent: A software system that uses LLMs to plan and execute multi-step tasks across external applications and systems without continuous human input.
Original article
Apple is developing an autonomous AI agent that can get things done on behalf of users similar to offerings by OpenAI, Anthropic, Meta, and others. The company is currently seeking a senior engineering manager for a proactive, agentic AI assistant that can write code, browse the web, control apps, and navigate devices on a user's behalf. Apple is working on agents that can plan and carry out multi-step tasks across apps, browsers, command lines, code, and APIs while coordinating specialized subagents along the way. The company's App Store has been dominated by AI agents, so it has introduced a new warning in the upcoming macOS 27.3 update that prompts users to reconsider granting third-party agents permission to control their Macs.

PostgreSQL 19 Released!
PostgreSQL 19 is now available, introducing non-blocking table maintenance and improved tools for stabilizing query performance in mission-critical environments.
Deep dive
- Performance & Maintenance:
REPACK (CONCURRENTLY)reclaims space without blocking operations; autovacuum now supports parallel index vacuuming. - Query Planning:
pg_plan_adviceallows manual stabilization of query plans;EXPLAINnow reports asynchronous I/O activity. - Replication:
WAIT FOR LSNenables read-your-writes consistency on standbys; logical replication now supports sequence values. - Developer Experience: Added
INSERT ... ON CONFLICT DO SELECT(get-or-create pattern);COPYnow supports JSON output. - Authentication: Deprecated
md5support; added Server Name Indication (SNI) support for TLS certificates.
Decoder
- Bloat: In Postgres, this refers to dead tuples or unused space within table pages that result from frequent updates and deletes.
- WAL (Write-Ahead Logging): A standard method for ensuring data integrity by logging changes before applying them to the main data files.
- LSN (Log Sequence Number): A byte-offset pointer that identifies the exact position of a record in the WAL, used for tracking replication progress.
Original article
PostgreSQL 19 Released!
November 19, 2026 - The PostgreSQL Global Development Group today announced the release of PostgreSQL 19, the latest version of the world's most advanced open source database.
Mission-critical usage of PostgreSQL continues to rapidly rise, and PostgreSQL 19 responds to this by simplifying both administration and development for these workloads at scale. This release introduces the REPACK (CONCURRENTLY) command so users can optimize tables for their current workload without disruption to ongoing operations. PostgreSQL 19 gives users better control over plan stability and query performance with the new pg_plan_advice extension. Developers will find many delightful features in this release, from support for "read-your-writes" consistency on standbys to "get or create" behavior that saves a network round trip.
"For over 30 years, the global open source community has built PostgreSQL into a database that organizations trust with their most critical data," said Jonathan Katz, a member of the PostgreSQL core team. "PostgreSQL 19 continues that commitment to reliability, giving users new ways to manage their workloads without disruption and to build applications that span multiple systems."
PostgreSQL, an innovative data management system known for its reliability, robustness, and extensibility, benefits from 30 years of open source development from a global developer community and has become the preferred open source relational database for organizations of all sizes.
Simplifying workload management
Tables that receive many updates and deletes can build up unused space, known as "bloat," which can also significantly impact query performance. The VACUUM FULL and CLUSTER commands were previously used to handle this, but had tradeoffs, including preventing access to the table until the cleanup finished. PostgreSQL 19 introduces the REPACK command, which reclaims this space and can reorder a table's data to match an index, and with REPACK (CONCURRENTLY), can do so without blocking reads or writes. REPACK replaces the VACUUM FULL and CLUSTER commands, both of which remain available for compatibility.
The PostgreSQL query planner usually picks an efficient plan for each query, but the plan can change as your data changes, and sometimes the new plan is slower. PostgreSQL 19 adds the pg_plan_advice extension, which allows stabilization of plan choices and the ability to experiment with different plans using the "plan advice" mini-language. The companion pg_stash_advice extension stores advice and automatically applies it to queries based on their query identifier, so you can fix a slow plan without changing your application.
PostgreSQL 19 also helps autovacuum keep up on busy systems. Autovacuum can now vacuum indexes using parallel workers, controlled by the new autovacuum_max_parallel_workers setting, and uses a new scoring system to decide which tables to process first. Queries that read a table can now automatically mark pages as all-visible in the visibility map during execution, reducing the work that future vacuums need to do. Additionally, vacuumdb --analyze-only now analyzes partitioned tables when no tables are specified.
This release adds new views for monitoring workloads, including pg_stat_lock for per-lock-type statistics, pg_stat_recovery for recovery status, and pg_stat_autovacuum_scores to show how autovacuum prioritizes tables. The new IO option for EXPLAIN ANALYZE and the matching auto_explain setting report asynchronous I/O activity. PostgreSQL 19 also reports the amount of WAL written for full-page images in pg_stat_wal, EXPLAIN (ANALYZE, WAL), and in vacuum and analyze log events.
Distributed data improvements
Previously, PostgreSQL often required users to restart their server to enable logical replication, which could be disruptive in production workloads. PostgreSQL 19 simplifies logical replication initialization by automatically raising the effective WAL level to logical when you create the first logical replication slot. You can see the WAL level in use with the new effective_wal_level setting.
PostgreSQL 19 also adds logical replication of sequence values, which you can publish using FOR ALL SEQUENCES with CREATE PUBLICATION. CREATE PUBLICATION also adds an EXCEPT clause to exclude tables when publishing FOR ALL TABLES, and CREATE SUBSCRIPTION can now get its connection settings from a foreign server, such as one defined with postgres_fdw, using the SERVER clause. Additionally, the new retain_dead_tuples subscription option lets PostgreSQL detect updates that conflict with a concurrent delete, and these conflicts are counted in pg_stat_subscription_stats.
For applications that send reads to standbys, PostgreSQL 19 adds "read-your-writes" consistency with the new WAIT FOR LSN command. A session on a standby can use WAIT FOR LSN to wait until the standby has replayed the write-ahead log (WAL) up to a specific log sequence number (LSN) before running a query, so the application can read data it just wrote on the primary.
PostgreSQL 19 also improves queries on foreign tables. With the new import_stats option, postgres_fdw can import table statistics from the remote server when you run ANALYZE, instead of sampling rows from the remote table, which helps the query planner choose better plans.
Developer experience and performance enhancements
PostgreSQL 19 adds INSERT ... ON CONFLICT DO SELECT, which lets the RETURNING clause return existing rows that conflict with an insert, simplifying the common "get or create" pattern. COPY can now output data as JSON, including as a single JSON array, and the SQL/JSON path language adds string methods such as lower(), upper(), replace(), split_part(), and btrim(). Additionally, the lead(), lag(), first_value(), last_value(), and nth_value() window functions can now skip NULL values using IGNORE NULLS. The random() function can now also generate random dates and timestamps within a range.
This release also makes many workloads faster without changes to your application. PostgreSQL 19 improves the performance of foreign key checks, which in testing made bulk inserts nearly 2x faster, and adds more query planner optimizations, such as converting NOT IN clauses to more efficient anti-joins when NULL values are not present, and performing eager aggregation before joins to reduce the number of rows to process. PostgreSQL 19 also builds on the asynchronous I/O subsystem added in PostgreSQL 18. When io_method is set to worker (the default), PostgreSQL now automatically adjusts the number of I/O workers between the new io_min_workers and io_max_workers settings, which replace the io_workers setting. There are also scalability improvements when using LISTEN and NOTIFY to exchange notifications in multi-channel workloads.
Finally, the new password_expiration_warning_threshold setting warns users when their password is about to expire.
Other notable changes
PostgreSQL 19 adds server-side support for Server Name Indication (SNI), letting a single PostgreSQL server present a different TLS certificate based on the hostname a client connects to. You can map hostnames to their certificates and keys in the new pg_hosts.conf file. PostgreSQL 19 also now issues a warning after a successful md5 password authentication, which you can turn off with the md5_password_warnings setting. md5 password authentication was deprecated in PostgreSQL 18 and will be removed in a future release. If you require password-based authentication, use SCRAM authentication. This release also removes support for RADIUS authentication.
Just-in-time compilation (JIT) is now disabled by default, as the cost estimates PostgreSQL used to decide when to use it proved unreliable. If you run many large analytical queries, you may want to enable JIT. When PostgreSQL is built with LZ4 support, the default TOAST compression method is now lz4.
Additional Features
Many other new features and improvements have been added to PostgreSQL 19 that may also be helpful for your use cases. Please see the release notes for a complete list of new and changed features.
About PostgreSQL
PostgreSQL is the world's most advanced open source database, with a global community of thousands of users, contributors, companies and organizations. Since its beginnings at the University of California, Berkeley over 40 years ago, PostgreSQL has continued with an unmatched pace of development. PostgreSQL's mature feature set not only matches top proprietary database systems, but exceeds them in advanced database features, extensibility, security, and stability.

Anthropic IPO takeaways: ANT debuts with $1.8 trillion market cap in landmark moment for AI
Anthropic debuted on the Nasdaq with a $1.8 trillion market cap, marking the largest initial public offering in history.
Deep dive
- The offering saw massive retail interest, with institutional allocations favoring established partners.
- Co-founders maintain control via 'Founder LLC,' holding 50.1% of voting power.
- Anthropic has secured $900 billion in compute commitments, with ongoing major partnerships with SpaceX, Nvidia, and Amazon.
- Revenue grew 1,200% year-over-year, though the company reported a $104 billion net loss largely due to accounting adjustments on convertible notes.
- The company is actively pursuing entry into the cybersecurity market, which analysts believe could rival its current coding business in total addressable market size.
Decoder
- Public Benefit Corporation (PBC): A legal corporate structure that legally requires the business to balance shareholder profit with specific social or public benefits defined in its charter.
- Recursive Self-Improvement (RSI): A theoretical future capability where an AI system can modify its own source code and architecture to become more intelligent, potentially leading to an uncontrolled 'intelligence explosion.'
- Perpetual Futures: A derivative contract similar to a futures contract but without an expiration date, allowing traders to speculate on the price of an asset without owning the underlying equity.
- Convertible Note: A debt instrument that converts into equity shares of the company, typically during a future funding round or liquidity event.
Original article
Full article content is not available for inline reading.
CVE-2026-114938 OpenJDK RCE (Java4Shell): Everything You Need to Know
A critical RCE vulnerability in OpenJDK, dubbed 'Java4Shell', exploits optimized AVX-512 Base64 decoding on x86-64 processors.
Deep dive
- Vulnerability Type: Memory corruption via heap overflow in the JVM's Base64 intrinsic implementation.
- Root Cause: An underflow calculation in AVX-512 assembly code when handling specific trailing padding characters (=).
- Exploitation: Overwriting adjacent object metadata allows for arbitrary code execution.
- AI Risk: Wiz Research demonstrated that an AI-based vulnerability harness could generate a proof-of-concept exploit within two hours.
- Hardware Scope: Limited to x86-64 CPUs with AVX-512 VBMI instructions; ARM64 is not affected.
- Mitigation: Official patches are available for major OpenJDK distributions; runtime flags like '-XX:UseAVX=2' act as a secondary defense.
Decoder
- Intrinsic: A function implemented directly in assembly or machine code by the compiler or JVM to provide hardware-accelerated performance, often bypassing standard language-level safety checks.
- RCE (Remote Code Execution): A vulnerability that allows an attacker to execute arbitrary commands on a target system from a remote location.
- AVX-512 VBMI: A set of Intel processor instructions (Vector Bit Manipulation Instructions) used for accelerated data processing and decoding.
Original article
On November 17, 2026, details emerged exposing a critical remote code execution (RCE) vulnerability in OpenJDK, tracked as CVE-2026-114938 (dubbed "Java4Shell") with a CVSSv4.0 score of 9.2. The bug exists in the optimized assembly code handling AVX-512 Base64 decoding, allowing remote unauthenticated attackers to cause heap memory corruption. Triggering this flaw on affected systems can lead to remote code execution.
The "Java4Shell" vulnerability and exploit were discovered and disclosed by security firm Calif.
What is CVE-2026-114938?
CVE-2026-114938 is a memory-corruption vulnerability residing in the optimized Base64 decoding intrinsic engine of the Java Virtual Machine (JVM). To maximize performance, OpenJDK uses an optimized implementation on supported x86-64 processors, based on AVX-512 VBMI instructions. However, the optimized assembly code miscalculates the output array bounds when handling inputs that contain an unexpected number of trailing padding characters (=).
When an input containing a specific sequence -such as 64 A characters followed by a single = - is parsed, the decoder's length calculation underflows to a negative value. This calculation mismatch causes an out-of-bounds write past the allocated heap memory buffer. Attackers can leverage this to overwrite adjacent object metadata, which can lead to code execution. We have proved that remote exploitation is feasible against standard Java applications such Jenkins, Confluence, and Apache Tomcat.
Wiz Research data: what’s the risk to cloud environments?
Like other memory safety issues, exploitation is possible with AI, but is not trivial. Our AI based vulnerability research harness, Wiz Atlas, managed to find and build a proof-of-concept exploit for this vulnerability within 2 hours, even before the full details were disclosed. Having said that, generalizing the exploit for an arbitrary target is difficult. We should expect adversaries to target commonplace Java applications, where specific builds and memory layouts repeat across targets. Motivated adversaries may tailor exploits with AI for specific targets, including home-grown applications.
Web Application Firewalls can help mitigate some of the exploits as they emerge in the wild. Since this vulnerability is rooted in OpenJDK itself, many possible code paths using user inputs may lead into the vulnerable code path, so it’s unlikely that WAF rules will be able to cover all possible paths, and will never be able to cover home grown applications completely. The best solution is upgrading to the latest OpenJDK version.
Prioritize externally facing, packaged Java applications, and make sure they are either patched or restricted from public access. Upgrade home-grown Java applications and update to the latest OpenJDK version containing the fix.
Which products are affected?
The vulnerability affects OpenJDK versions 17.0.6 and later, as well as downstream distributions, provided they run on x86-64 hardware supporting AVX-512 VBMI instruction sets (ARM64 processors are unaffected). Affected software distributions and hardware include:
- OpenJDK Distributions: Amazon Corretto, Eclipse Temurin, Microsoft Build of OpenJDK, Azul Zulu, BellSoft Liberica, SAP SapMachine, Red Hat OpenJDK, and Oracle Java SE (specifically versions 8u511b33-perf, 17.0.21.0.3, 21.0.13.0.3, 25.0.5.0.3, 27.0.1.0.3).
- Vulnerable CPU Architectures: Intel Xeon (Ice Lake, Sapphire Rapids, Emerald Rapids, Granite Rapids) and AMD EPYC/Ryzen (Zen 4 or newer).
- Proven Vulnerable Applications (Pre-Auth RCE): Atlassian Jira, Atlassian Confluence, Keycloak, JFrog Artifactory, Jenkins, and custom frameworks built on Spring Boot, Apache Struts, Apache Kafka Broker, Apache Solr, Elasticsearch, Gerrit, Netflix Spinnaker and Apache Tomcat.
Which actions should security teams take?
Security teams should immediately prioritize the following mitigation steps:
- Audit and Patch: Identify all systems running OpenJDK 17.0.6 or later on AVX-512-capable x86-64 hardware. Apply the official security patches released on November 17, 2026, or update to downstream vendor-supplied builds immediately.
- Verify Hardware Vulnerability: Run the following command on Linux systems to check if your infrastructure is physically affected:
grep -m1 '^flags' /proc/cpuinfo | tr ' ' '\n' | grep -E '^(avx512f|avx512bw|avx512vbmi|bmi2)$'If all four CPU flags are present in the output, the host runs the vulnerable hardware execution path.
- Implement JVM Runtime Workarounds: If immediate patching is not possible, apply one of the following flags to JVM startup parameters to completely neutralize the vulnerability. They may have performance impact on the application.
- Disable Base64 Intrinsics (Recommended):
-XX:-UseBASE64Intrinsics - Disable AVX-512 execution (x86-64 only):
-XX:UseAVX=2
- Disable Base64 Intrinsics (Recommended):
- Isolate Internet-Facing Services: Temporarily restrict external network access to vulnerable management portals (e.g., Jira, Jenkins, Keycloak) until mitigations or updates are deployed.
References
- Oracle security alert
- Calif blogpost
- OpenJDK advisory
- Oracle release notes

Last year we built megakernels. This year we deleted them: The road to Together Compiler
Together AI discovered that replacing complex, hand-written 'megakernels' with intelligent agent-driven optimization and standard primitives yields 28% higher performance.
Deep dive
- Megakernels: Executing entire model forward passes in a single monolithic GPU kernel, which proved rigid and difficult to productionize.
- Compiler Limitations: Found that greedy fusion heuristics in Torch Inductor often fail, and isolated micro-benchmarking leads to suboptimal kernel selection.
- Key Primitives: Reached 98% of megakernel performance using just CUDA Graphs and PDL to reduce launch overhead and overlap compute/memory tasks.
- Agentic Optimization: Replaced rule-based compilers with an agent-centric approach that directly modifies forward-pass source code.
- Performance: TKCC achieves up to 1.7x higher throughput than baseline megakernels by adapting to specific hardware (Hopper, Blackwell) and architectural needs.
Decoder
- Kernel fusion: Combining multiple smaller GPU operations into a single kernel to reduce memory traffic and improve hardware utilization.
- SM (Streaming Multiprocessor): The fundamental compute unit of a GPU.
- CTA (Cooperative Thread Array): A grouping of threads that share memory and execute a kernel on the GPU.
- PTX: NVIDIA's low-level intermediate representation for GPU code.
- FlashAttention: An algorithm to compute attention in Transformers more efficiently by reducing memory read/write cycles.
Original article
Full article content is not available for inline reading.
GitLab 19.6 released
GitLab 19.6 significantly improves merge request performance with Rapid Diffs and enhances agentic workflows with goal-based automation.
Deep dive
- Rapid Diffs: A ground-up rewrite that streams diffs, fixing browser freezing issues during large code reviews.
- Agentic Improvements: GitLab Duo Chat now supports
/goalto execute multi-step tasks without continuous user prompting. - Automation: Scheduled automations can now run flows at regular intervals for tasks like issue triage.
- Security: New malware rules for dependency scanning and expanded support for Business Logic Security Analyzer on self-managed instances.
- GitLab Runner 19.6: Updates include native support for Ubuntu 26.04 and experimental HTTP/2 support for API requests.
Decoder
- MCP (Model Context Protocol): An open standard for connecting AI assistants to systems like GitLab, allowing them to read context and execute tools.
- Diff: The difference between two versions of code, usually displayed during a merge request review.
- SAST (Static Application Security Testing): Scanning source code for vulnerabilities without executing it.
Original article
Full article content is not available for inline reading.

Should You Actually Add AI to That? A Four-Question Audit for Product Teams
Product teams should only add AI if the benefits—effort reduction, error catching, or consistency—outweigh the cognitive load of verifying AI-generated output.
Deep dive
- The Break-even Line: AI only provides net value when it beats the cost of user adjustment.
- Hidden Effort: Pre-filling fields often trades low-effort data entry for high-effort verification.
- Automation Bias: Users tend to trust AI outputs even when they are visibly incorrect, leading to degraded performance.
- Skill Atrophy: Long-term reliance on AI can erode the human judgment required to catch errors, necessitating mechanisms like periodic blind reviews.
- Audit Framework: - Determine task segment. - Compare against manual workarounds. - Design for provenance (showing the 'why' and source of AI claims). - Build in skill-maintenance workflows.
Decoder
- Automation bias: The human tendency to over-rely on automated systems and assume the output is correct, leading to a failure to notice errors.
- Provenance: The source or origin of information; in AI, this refers to showing the user where the AI retrieved its data to build trust.
Original article
Full article content is not available for inline reading.

Introducing Tool Retrieval in the Gemini API
Google’s new Tool Retrieval API for Gemini optimizes performance by loading function schemas dynamically instead of forcing agents to hold entire libraries in context.
Deep dive
- Implements on-demand schema loading to keep prompt context focused.
- Supports both server-side retrieval and custom client-side registries via the tool_search tool.
- Integrates with MCP (Model Context Protocol) servers for remote tool access.
- Leverages prefix caching by keeping stable schemas out of the variable function-call context.
- No additional cost beyond standard model pricing for tokens used.
Decoder
- Tool Retrieval: An optimization technique where an AI model dynamically fetches function definitions as needed rather than having them pre-loaded in the context window.
- MCP (Model Context Protocol): An open standard for connecting AI models to external data and tool sources.
- Prefix Caching: A feature where the system saves the computation of common, repeated parts of a prompt to speed up future requests.
Original article
Introducing Tool Retrieval in the Gemini API
Today we're launching Tool Retrieval in the Gemini API, available in preview in the Interactions API.
When an agent connects to dozens or even hundreds of tools, sending every full parameter schema on every request adds up fast. It inflates input token counts, adds latency, and lowers tool-selection accuracy as the candidate list grows. Tool Retrieval lets your agent keep its full tool library on standby and load parameter schemas only when the current task needs them.
How it works
To turn on Tool Retrieval, add a tool_search tool to your request and set defer_loading: true on the tools you want to hold back. The model still sees the name and description of every deferred tool, so it knows what's available, but the parameter schemas stay out of context. When the model needs a tool, it asks for it by name, the API loads the full schema, and the model calls the function, all inside the same request.
from google import genai

client = genai.Client()

tools = [
   {"type": "tool_search"},
   {
       "type": "function",
       "name": "issue_refund",
       "description": "Refund an order to the original payment method.",
       "defer_loading": True,
       "parameters": {
           "type": "object",
           "properties": {
               "order_id": {"type": "string"},
               "amount": {"type": "number"},
           },
           "required": ["order_id", "amount"],
       },
   },
   # ... 50+ other deferred functions (leave frequent tools undeferred)
]

interaction = client.interactions.create(
   model="gemini-4-hydrogen",
   input="Order A-1042 arrived damaged. Please refund 40 dollars.",
   tools=tools,
)
Inside that single API call, the model searches for issue_refund, the API loads its schema, and the model emits the function_call. All three steps appear in interaction.steps, making it easy to inspect which tools the model considered when debugging tool names or descriptions:
"steps": [
 {
   "type": "tool_search_call",
   "id": "tsc_7f2a",
   "arguments": {"function_names": ["issue_refund"]},
   "signature": "..."
 },
 {
   "type": "tool_search_result",
   "call_id": "tsc_7f2a",
   "result": [{"type": "function", "name": "issue_refund", "parameters": {...}}],
   "signature": "..."
 },
 {
   "type": "function_call",
   "id": "fc_91c3",
   "name": "issue_refund",
   "arguments": {"order_id": "A-1042", "amount": 40}
 }
]
From here it's normal function calling: your code runs the refund and sends back a function_result.
There's no index to build or host. Gemini runs the search on the server, so the only changes to your code are the new tool and a flag on the tools you want to defer. You can keep your most-used tools loaded up front and defer the long tail.
Tool Retrieval also plays well with prefix caching. Deferred schemas stay out of the start of the prompt, and the schemas the model loads are added later in the conversation, so the cached prefix stays the same from turn to turn.
Tool Retrieval also works with remote MCP servers in the Gemini API. Set defer_loading: true on an mcp_server tool and every tool that server exposes is loaded on demand, so you can connect a large server without listing its tools one by one.
How client-side retrieval works
If you maintain your own tool registry, embedding index, or per-user permission filter, declare the tool_search with "execution": "client" and define your search parameters. Client-side retrieval adds one round trip per search, because your app runs the lookup. Tools do not need to be declared upfront, so you can also expose new tools mid-conversation when a user connects an integration:
tools = [{
    "type": "tool_search",
    "execution": "client",
    "name": "search_tools",
    "description": "Search the internal tool registry for functions.",
    "parameters": {
        "type": "object",
        "properties": {"query": {"type": "string"}},
        "required": ["query"],
    },
}]

# When the model emits a function_call for "search_tools",
# return matching {"type": "function", ...} schemas in function_result:
followup = client.interactions.create(
    model="gemini-4-hydrogen",
    previous_interaction_id=interaction.id,
    tools=tools,
    input=[{
        "type": "function_result",
        "name": "search_tools",
        "call_id": step.id,
        "result": my_registry.search(**step.arguments),
    }],
)
How pricing and supported models work
Tool Retrieval has no separate charge. Input and output tokens are billed at the standard rates for the model you call. Turning on tool_search adds a small, fixed block of input tokens, and each schema the model loads is billed as input for the rest of the conversation, the same as a tool declared up front. You save tokens when the schemas you never load outweigh the ones you do, which is the usual case for large libraries. Measure it against your own traffic.
Tool Retrieval works with Gemini 3.6 and later models, including all Gemini 4 models, in the Interactions API.
How to get started
- Read the documentation — Full setup guide with examples
- Compare Gemini models — Find the best model for your use case
- Join the discussion on Discord — Share feedback with the team
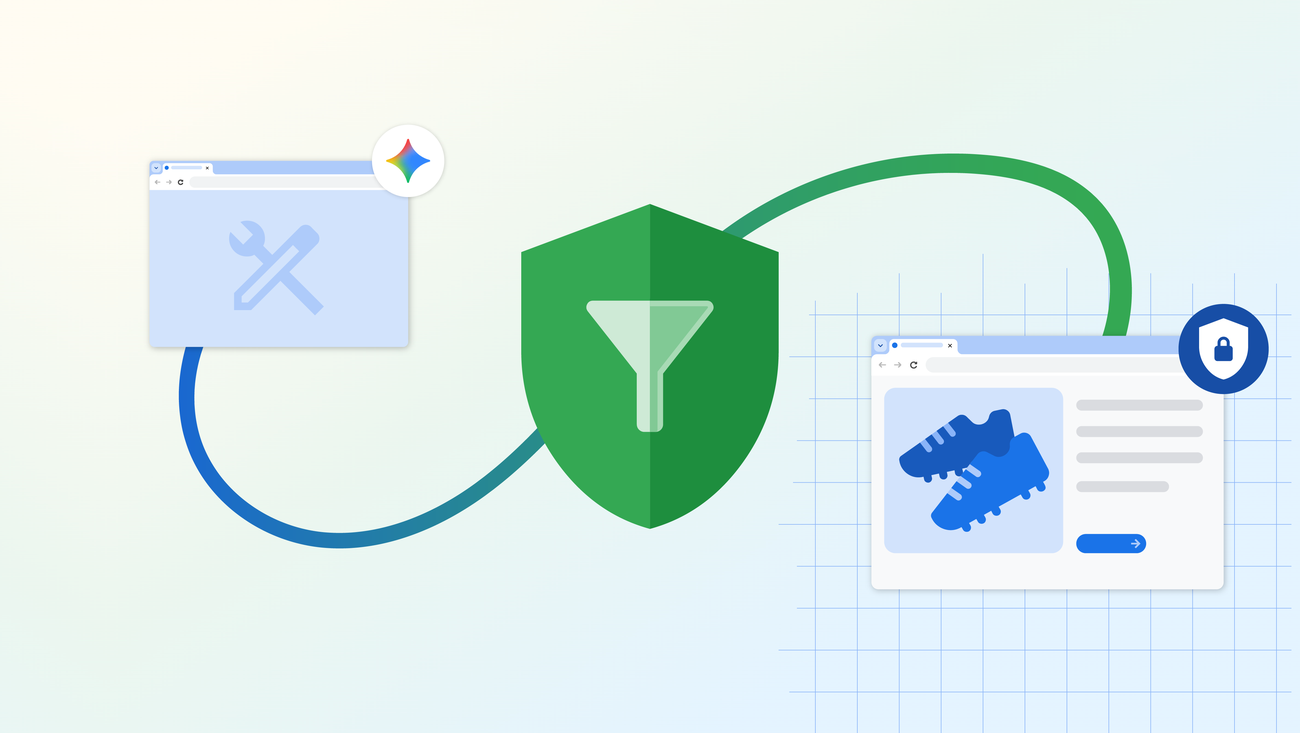
Mirror Dimension for Agents: Evaluating Browser-Use Agents Without the Web
Google’s 'Mirror Dimension' provides a synthetic, local web environment to safely stress-test browser-using AI agents against adversarial attacks.
Deep dive
- Uses gVisor for isolation and a local interception proxy to serve synthetic content.
- Employs dynamic certificate 'minting' to prevent TLS errors in the browser sandbox.
- Populates the synthetic web using a multi-agent harness: Research, Builder, and Critic agents.
- Red-teaming pipeline uses HTTP headers (rather than visible URL parameters) to trigger adversarial payloads.
- Capable of performing 1,000+ adversarial tests per security engineer, per day.
Decoder
- Eval awareness: When an AI model detects it is in a testing environment and changes its behavior, potentially invalidating the security results.
- Indirect prompt injection: An attack where an agent is fed malicious instructions hidden in external content (e.g., a website), leading the agent to take unauthorized actions.
- Hermetic sandbox: A strictly isolated testing environment that has no external network access and can guarantee identical states for every run.
Original article
Mirror Dimension for Agents: Evaluating Browser-Use Agents Without the Web
Chrome is introducing the ‘mirror dimension’; a synthetic version of the web to test agents safely in realistic online environments, without creating real-world security risks.
Agents are already having a massive impact on how people use the web. That’s why we designed Chrome’s agentic browsing feature, auto browse, with built-in protections from the start. We’ve also been using coding and security agents to make Chrome safer.
To validate and strengthen those protections, Chrome created a ‘mirror dimension’, a synthetic version of the web to test agents safely. This controlled testing ground lets engineers evaluate auto browse in realistic online environments, featuring thousands of simulated websites inspired by everyday user journeys, without creating real-world security risks. It serves as a critical tool to ensure new capabilities are safe, reliable, and resistant to threats. Below, we detail step-by-step how we built this environment and the obstacles we overcame.
The Challenge of Developing Browser-Use Agents
Many of the tasks that we train our agents to handle require them to navigate to well-known websites and perform actions on those sites like clicking through subpages, scrolling to locate information or typing into input fields. Consider a user prompt like: “Go to my youtube account and help me download the latest episode of the Made By Google podcast for my flight today”. Here, the user does not provide a specific URL; instead, the model infers the destination and formulates a plan to navigate to www.youtube.com.
This introduces a fundamental eval challenge. Training and evaluating agents requires executing thousands of read and write actions across hundreds of websites on a continuous basis. But, pointing an agent at the public web during testing can be both ineffective, since the web is constantly changing, and irresponsible, since agents can cause harm when given unfettered access. Rigorous evaluations must be safe, reliable and repeatable: side effects from one trajectory must never persist into the next, ensuring every test run starts from a clean, identical baseline.
To solve this, we built a hermetic ‘mirror dimension’ for our agents. This environment combines an isolated sandbox populated with realistic synthetic websites and a local interception proxy that preserves the realism of browsing the live web. To create a truly hermetic and high-fidelity environment we needed to solve several unique engineering challenges around network routing and site generation.
The Art of Redirection: The Sandbox and the Proxy
One of the key challenges with using synthetic sites is avoiding eval awareness, where the model suspects it is being tested and performs actions it might not otherwise. This means that for our 'mirror dimension', it was not enough to simply host all our synthetic sites under a single domain.
This presents an interesting engineering challenge: how can we enable the agent to infer the URLs and navigate to websites for testing while covertly redirecting it to our sandbox? One easy solution would be to write our evals in such a way that the user prompt explicitly instructs the model to navigate to that exact sandbox URL. But in our testing, that easily breaks the realism of the eval and induces eval awareness.
Same URL, Different Dimension
Instead of forcing the agent to visit a suspicious sandbox address, we allow it to navigate to the real URL like https://www.youtube.com, just as it would in the wild. Under the hood, the agent uses a headless Chrome browser in an isolated gVisor sandbox to load the page. And rather than allowing the request to reach external DNS or the public internet, the sandbox captures the network connection and routes it to a local proxy that serves our generated site instead.
However, this presents a problem: this type of interception is exactly the kind of person-in-the-middle attack that Chrome is specifically engineered to block to protect users. Without a way to cryptographically prove the proxy's identity to the browser, every intercepted request would trigger fatal TLS errors.
Maintaining the Illusion with Cert Minting
To prevent Chrome from throwing the “Invalid Cert Authority” error, we have to convince the browser that our local proxy is serving the actual destination website. Simply downgrading connections to unencrypted HTTP isn’t an option, since that would still trigger other “Not Secure” warnings in Chrome.
Instead, the proxy dynamically mints TLS leaf certificates on the fly that chain back to a custom Root Certificate Authority (CA) pre-installed in the sandboxed Chrome instance. On a real user’s device, an external network attacker cannot install a custom Root CA without already having privileged administrative access to the machine–but because we fully control the gVisor sandbox, we can safely configure this trust anchor at startup so Chrome validates the synthetic sites normally.
Spinning a Synthetic Web
With the containment boundary and interception proxy in place, the next challenge is actually populating our mirror dimension. Our agents carry out multi-step, advanced workflows, so if a site feels static or half-baked the agent often does pick up on subtle cues that it's inside a test environment, leading to eval awareness. Therefore, we’ve had to find ways to scalably populate and maintain hundreds of interactive, stateful web pages. The sandbox has to support everything from local service marketplaces and e-commerce checkouts to social media feeds and recipe sites.
Instead of building and maintaining these sites manually, we developed an autonomous multi-agent site development harness to help us match the scale needed. A human in the loop simply defines the high-level user journeys we want our agent to test, and a specialized team of sub-agents designs, builds, inspects, and critiques the web site directly inside the sandbox.
The site development harness divide the work across three specialized agent roles:
- The research agent: Generates site specifications based on the content in the user’s prompt. For example, if the user requests an e-commerce platform, it might enumerate site-specific requirements like: product catalog filtering, cart persistence, coupon code validation, and a multi-step checkout workflow.
- The builder agent: Translates the specifications into functional code, writing the HTML, CSS and JavaScript to create responsive layouts as well as the multi-page navigations required for more complex trajectories.
- The critic agents: Evaluates the generated application against production web benchmarks, verifying that accessibility tree semantics work as expected, ensuring form validation catches edge cases, auditing console logs for JavaScript errors, and validating that element boundaries and various responsive screen-size layouts render correctly.
Most importantly, this is all made possible with Chrome DevTools for Agents, which serves as the agents’ eyes and hands. Rather than analyzing the source code as text, the Chrome DevTools MCP server allows the sub-agents to exercise their multimodal capabilities. It gives them tools to visually inspect screenshots of the rendered page, execute actual clicks and keystrokes on page elements, navigate around the generated site and observe how the application behaves in real time while executing real user journeys.
Simulating a Hostile Web with Dynamic Red-Teaming
Beyond evaluating how agents handle complex everyday tasks, owning every layer of our 'mirror dimension' brings us back to our core safety goal: rigorously stress-testing agent safeguards. One of the most critical threats those safeguards must stop is indirect prompt injection, where attackers embed hidden instructions inside untrusted web content in order to manipulate an agent into taking unauthorized actions.
Testing an agent’s resilience against such a diversity of prompt injection vectors requires an evaluation environment that can synthesize malicious payloads and inject them in any of these surfaces, and at any point in time. Fully controlling our sandbox web server allows us to programmatically manipulate payloads across the full web context, whether that’s injecting prompt injections as images or text, adding malicious aria labels, or even altering WebMCP tool responses on the fly.
Stealthy Payload Injections
Initially, our system for dynamically injecting malicious payloads relied on URL parameters that were visible to the agent. We quickly learned that frontier models are far too perceptive for this. There were many instances where an agent became eval aware simply by noticing an abnormal query parameter that would not normally be associated with a given site.
Thus, to avoid tipping off agents about evals in the URL, we configured the sandbox to serve sites with injected adversarial payloads by passing the payload identifiers via HTTP headers. Our red-teaming orchestration harness populates custom HTTP request headers like X-Sandbox-Injection-Key in order to specify the payload to be injected. The sandbox web server intercepts and filters these headers, and then serves the mutated version of the page with the injected payload, leaving the page’s visible URL completely pristine.
Impact
A security engineer can hand-craft and test a few dozen realistic attacks a day, but verifying and refining each idea quickly becomes the bottleneck. Our automated red-teaming pipeline uses the 'mirror dimension' to test and refine our best engineers' ideas across a wide variety of sites, steadily creating more than 1,000 tests candidates every day per security engineer. That's over 30x what one engineer could do by hand, or more than a month of manual testing, every day.
Looking Ahead
Agents with browser-use capabilities are helping users with longer tasks that involve complex, multi-step workflows. As they become more capable and more observant, we expect that hermetic sandboxes equipped with fully synthetic internets like the mirror dimension will be the baseline for agent safety and alignment research. This is because, fundamentally, building safe and aligned agents requires giving them a space where they can be monitored as they carry out longer workflows and make judgment calls on novel scenarios outside their training.
While this post focuses on browser-use agents that operate within a strictly bounded set of web primitives and tool calls, we believe the underlying mirror dimension sandbox architecture can be extended to evaluate more general-purpose coding agents with broader toolsets. As the agentic ecosystem grows, we remain focused on evaluating and hardening Chrome’s built-in defenses against hostile prompt injections, improving the realism of the sandbox to minimize eval awareness, and expanding our internal security testing infrastructure as agents gain richer capabilities.
FastFrames: Video Generation at Interactive Latency
Apple's new FastFrames models generate 480p video at interactive speeds, with the smallest model producing frames in just 36 ms.
Original article
A macro shot of a man in an antique scuba helmet with dark glass lenses, walking out of a colorful flower bed. The man's weathered face and rugged hands are clearly visible through the helmet. His posture is slightly stooped, and he appears to be in deep concentration. The flower bed is filled with a variety of blooming flowers, their petals soft and vibrant, creating a lush and vivid backdrop. The camera angle is from below, capturing the man's entire figure as he emerges from the flowers, with the petals gently falling around him. The image has a vintage, almost nostalgic quality, with a focus on the intricate details of both the man and the flowers. A macro shot with a slightly downward angle.
Vercel Board
Vercel introduced 'Board,' an experimental communication primitive designed to help agent swarms coordinate tasks, claim work, and share context.
Deep dive
- Board is a headless primitive for tracking agent tasks, state, and logs.
- Supports granular access controls (grants) for individual agents and human users.
- Enables two-way synchronization with external tools like Slack and GitHub.
- Uses schemas to allow agents to share structured data beyond raw text messages.
- Designed to be harness-agnostic, supporting Claude Code, Codex, and other LLM agents.
- Allows agents to 'wake' based on event triggers (e.g., Slack replies) to achieve proactive task management.
Decoder
- Primitive: A foundational building block or tool in a software architecture upon which more complex systems are built.
- Headless: Software that provides core functionality without a graphical user interface, intended for programmatic interaction.
Original article
Software development is moving from individual agents completing tasks to teams of agents working on more complex projects.
A single agent can track its work in a Markdown file, but there isn't a purpose-built primitive for tracking tasks, delegation, statuses, logs, and completed work across many agents and subagents.
We ran into this coordination problem internally and started experimenting with a shared message board as a primitive on two key projects:
- Our security agents: We deployed a swarm of agents to analyze our codebases for vulnerabilities, push fixes and updates, and now we keep track of their work via Board.
- v0's software factory: After seeing how well Board worked for security agents, we rebuilt v0's software factory on it, and it now merges over 50% of PRs.
Along the way, we added multiple features like grants for different levels of access (for humans and agents), two-way sync for multiple tools (like Slack), and a lot more.
Today we are launching Vercel Board as an experimental agentic primitive. It packages what we've learned about coordinating work across agent fleets and builds towards a future where multiple teams of humans and agents orchestrate swarms, software factories, and other agentic workflows.
We built Board for our own needs, but invite curious developers to test it alongside us and give feedback. It is harness agnostic and fits well into existing multi-agent reinforcement learning. Claude Code, Codex, Pi, OpenCode, eve, fx, Mastra, and LangChain can collaborate as if they were a single harness.
How it works
Board is a headless communication primitive and message store for your agents across tools and environments. Your agents read from and write to Board through the CLI or JavaScript SDK. Install the Board skill to give your agent instructions for using it:
npx skills add vercel/boardEach board is organized into channels and threads. A thread keeps the conversation, context, and updates together, while labels track details such as the associated pull request or current status. Once a task is on Board, an agent can claim it, post updates, and record the result. For example, a coding agent can use the CLI to find an open bug, claim it, and share a pull request for review:
# Claim the next ready task in a channel
vercel board tasks claim --ready dev --label kind=bug --wait 10m
# Update coworkers on progress
vercel board post <id> "Working on it. This might take me ~30 minutes."
# Renew your lease after learning it's a tough one
vercel board tasks renew <id> --lease 1h
# Share the fix and settle the task
vercel board tasks complete <id> "Can I get a review? <pr-url>"
The thread keeps the original report, findings, and pull request so another agent or person can review the work. Run npx @vercel/board inspect to open the Board viewer and follow activity across channels and threads in real time.
Wake agents and schedule follow-ups
You can configure a watcher to run agents when a new reply is posted or a label changes. For example, if there is a reply in Slack or by another agent, it can trigger the agent to address their feedback and post an update or pull request in the same thread. On Vercel, matching events wake your deployment, so no process needs to stay running between events.
1import { board } from "@vercel/board";2
3const factory = board({4  watch: {5    incidentResponse: {6      tail: "incidents",7      run: async () => {8        // This code will be called whenever a new event9        // is posted into the #incidents channel10      },11    },12  },13});14
15export const GET = factory.fetch;16export const POST = factory.fetch;
Agents can also schedule follow-ups with vercel board schedule. For example, after an agent has opened a pull request it can remind itself to check CI in 5 minutes. This makes agents feel much more proactive, as they can check things without requiring a new message from a human. For a pull request tracked in Board thread 812, the agent would run:
vercel board schedule 812 \ "Check CI for the pull request linked in this thread. Investigate any failures." \ --in 5m --no-syncNote that agents can keep internal notes and check-ins on Board with --no-sync, while sharing progress updates through connected tools.
Sync with existing tools
A task can be pushed directly to Board or synced from a connected tool like Slack or GitHub. The Board SDK handles two-way sync, mirroring replies, reactions, edits, and deletions between Board and your connected tools:
1import { board } from '@vercel/board';2import { github, repos } from '@vercel/board/sync-github';3import { channels, slack } from '@vercel/board/sync-slack';4 5const team = board({6 sync: {7 // A Vercel Connect connector, and what each event does.8 slack: slack('slack/acme', channels({ '#prs': 'prs' })),9 github: github('github/acme', repos({ 'acme/www': { pulls: 'prs', issues: 'issues' } })),10 },11});12 13export const GET = team.fetch;14export const POST = team.fetch;Share structured data
Messages in Board can also include structured data based on a schema you define. Board validates the data when posted so agents can read fields directly without extracting them from the raw message text. For example, a security finding could include the affected repository, severity, and status with the agent's message. Here is an example schema, security-finding@1 (where @1 is the version):
# Register the schema
vercel board schemas create security-finding@1 \  --file security-finding.schema.json \  --description 'A security finding reported by an agent.'
# List and inspect registered schemas
vercel board schemas
vercel board schemas inspect security-finding@1
# Post a finding that matches the schema
vercel board post security --schema security-finding@1 '{  "repository": "acme/web",  "severity": "high",  "status": "open"}'
Control access to your board
A core part of why we built vercel board was to fulfill our own needs for security and auditability. Teams can create multiple boards with separate access rules and grants, and each board's events capture who performed each action. This is how you can use the CLI to set it up:
# Close security/ (and channels under it), but keep yourself in
vercel board grants create --user you@acme.com --can 'security/=all'
vercel board grants create --everyone --can 'security/=none'
# Let an agent read and post there, and nothing else
vercel board grants create --project prj_security --environment production --can 'security/=read,post'
# See what someone can do, then take a grant away
vercel board grants explain --user bob@acme.com security/incidents
vercel board grants revoke g5
When working with Vercel Sandbox, use the SDK to give it board access with no credential inside the sandbox, limited to the channels and permissions you choose:
1import { board } from "@vercel/board";2import { Sandbox } from "@vercel/sandbox";3
4const team = board();5const fixer = team.as({ name: "reviewer" });6
7// Only dev/, and only to read and reply8const { allow, env } = await fixer.sandboxPolicy({9  can: { "dev/": ["read", "post"] },10});11
12const sandbox = await Sandbox.create({13  // The board's routes, plus npm. Every other host is blocked.14  networkPolicy: { allow: { ...allow, "registry.npmjs.org": [] } },15  env,16});17
18await sandbox.runCommand("npm", ["install", "-g", "@vercel/board"]);19await sandbox.runCommand("vb", ["reply", "<thread-id>", "looking into it"]);
Use cases
We use Board to connect agents with our teams' existing workflows and coordinate across multiple agents. Here are the patterns we've implemented.
Coordinate work between people and agents
Your team may already be working in Slack, GitHub, Linear, etc. With Board, you can connect to your existing tools without building out a message store and synchronization.
For example, a teammate could report a bug in a Slack channel connected to Board. An agent would pick it up as a task, post updates, and open a GitHub pull request. Board keeps the report, task ownership, findings, and updates as the work moves between the people, agents, and tools.
Help agents work together
You can give agents running on different machines or in different harnesses a shared backlog, for example a set of security tickets or bugs to investigate. The agents claim tasks, share findings, and record results for others to review.
Board also supports dependencies between tasks. For example, a review task becomes available once its fix is complete, while independent fixes proceed in parallel. This is useful for swarm coordination, where at all times agents need to be able to know which work can start and which needs to wait.
Get started
vercel board is now available as an experimental primitive.

Cloudflare's Clairic and Clairic-flash
Cloudflare has released open-weight versions of its extraction models, Clairic and Clairic-flash, designed for structured data extraction from text, images, and PDFs.
Deep dive
- Redesigned architecture: Shifted from a single forward pass to parallel slot autoregressive generation, allowing fields to be generated concurrently for higher accuracy.
- Capability expansion: Added support for PDF and image inputs in addition to raw text.
- Pricing strategy: Transitioning to a model where developers are charged only on input tokens, with Cloudflare absorbing the cost of output generation.
- Performance: Models report latency under one second for most tasks on Workers AI.
- Benchmark status: Internal benchmarks report zero errors on image/text extraction for the new models, though Cloudflare notes these are not yet externally verified.
Decoder
- Open-weight: Models where the trained weights are publicly available for download and use, though they may lack the full training dataset or exact training pipeline transparency of 'Open Source' models.
- Parallel slot autoregressive generation: A technique where multiple fields in a template are generated simultaneously in a single pass to reduce latency while maintaining contextual awareness.
- Workers AI: Cloudflare's serverless AI inference platform that allows developers to run inference on their global network.
Original article
Full article content is not available for inline reading.

Computer Scientists Facilitating Independent Review of a High-profile OpenAI and Anthropic Result
Researchers from UC San Diego and MIT are launching an independent review of claims by OpenAI and Anthropic that their models refuted the Exponential Time Hypothesis.
Deep dive
- The Core Claim: OpenAI and Anthropic claim their models successfully refuted the ETH, a foundational hypothesis in computational complexity.
- Independent Scrutiny: The academic community is organizing a formal review process, including a dedicated blog and upcoming academic conferences to vet the results.
- Historical Context: The ETH was formulated in 1998 by Impagliazzo and Paturi. The current verification effort seeks to ensure that results generated by LLMs hold up to rigorous mathematical standard.
- Implications: Successful refutation of the ETH would likely require a total reassessment of security assumptions in modern encryption protocols.
Decoder
- Exponential Time Hypothesis (ETH): A fundamental assumption in computational complexity that suggests certain problems (like 3-SAT) cannot be solved in sub-exponential time; it is the basis for many lower-bound results in computer science.
- Sub-exponential time: Algorithms that run faster than exponential time, which is considered the practical limit for solving NP-complete problems.
Original article
Computer Scientists Facilitating Independent Review of a High-profile Open AI and Anthropic Result
Both companies announced their models refuted the Exponential Time Hypothesis formulated by UC San Diego computer scientists
In case you missed the global media coverage including The New York Times, UC San Diego computer scientists Russell Impagliazzo and Mohan Paturi as well as MIT computer scientist Ryan Williams are facilitating an independent review of a high-profile result generated by two frontier AI labs, Open AI and Anthropic.
Both companies recently announced that their AI models have refuted the highly influential Exponential Time Hypothesis (ETH). If the findings hold, the refutation of ETH (and/or the rise of possible alternatives to ETH) could have broad implications for optimization algorithms and a wide range of applications in chip design, encryption systems used on the Internet, and much more.
Now that the future of ETH is a topic of hot discussion, Impagliazzo, Paturi and Williams have stepped into the role of helping the computer science community understand and assess the ETH claim independently.
Impagliazzo and Paturi are both professors in the UC San Diego Department of Computer Science and Engineering. Paturi is also the associate dean for artificial intelligence strategy and implementation at the UC San Diego Jacobs School of Engineering.
The team launched ETH: Community Examination and Discussion, a new blog that serves as a place for researchers to share findings and ideas regarding the future of ETH.
The team plans to hold one or more academic conferences, where verification work will be discussed, along with farther-reaching implications. This week on the blog, the team posted the OpenAI prompt that led to the ETH refutation.
ETH was proposed in 1998 by Impagliazzo and Paturi, with then-computer science PhD student Francis Zane, who is now an independent researcher.

Google turns to Blue Origin for a rocket, but its long-term problem remains
Google has contracted Blue Origin for a 2029 rocket launch to test AI computing infrastructure in space, signaling a long-term goal of orbiting data centers.
Deep dive
- Google is testing machine-learning compute in space through Project Suncatcher.
- The 2029 mission uses a New Glenn 7x2 rocket to test networking solar-powered satellites.
- Orbital data centers remain economically unviable without costs dropping to ~$200/kg.
- SpaceX's Starship is the only vehicle currently aiming for these costs, but prioritize internal payloads.
- Blue Origin, a potential future partner, is also developing its own constellation, Project Sunrise.
Decoder
- Sun-synchronous orbit: An orbit that allows a satellite to pass over a location on Earth at the same local solar time, providing constant solar exposure.
- Heavy lift launch vehicle: A rocket capable of placing 20,000 to 50,000 kg into low Earth orbit.
Original article
Blue Origin announced Thursday that its New Glenn rocket will launch data center satellites for Google in 2029 as part of that company’s Project Suncatcher program.
Google disclosed it was working on scalable orbiting data centers about a year ago and characterized the project as one of its research “moonshots.” The mission on New Glenn is designed to deploy satellites, each with computing capacity at roughly the scale of a data center rack, into Sun-synchronous orbit where they can receive nearly continuous solar energy.
“Project Suncatcher is a long-term moonshot to scale AI infrastructure in space by tapping into the abundant solar power in orbit,” said Travis Beals, senior director of Project Suncatcher at Google, in the news release. “This dedicated launch with Blue Origin represents a crucial milestone on our roadmap as we expand the boundaries of what’s possible for the future of compute.”
Catching a ride while they still can
The announcement comes as US commercial heavy lift rockets, including New Glenn, are filling up their capacity through the year 2030. The Google mission will fly on the 7×2 variant of the New Glenn rocket, the smaller version of the vehicle that has launched three times to date.
The purpose of the 2029 launch will likely be to test the ability to network solar-powered satellites equipped with AI chips and demonstrate machine-learning compute in space. In that sense, it will be a technology demonstration. Google did not say who it was contracting with to build the satellites, which may weigh something on the order of several tons.
Perhaps the bigger question for Google is not whether it can make this technology work—but whether it is tenable for a company to have ambitions for a large constellation of orbital data centers in the 2030s without its own launch vehicle.
Need for super cheap launch
There remain a lot of questions about the economic viability of orbital data centers, but almost everyone agrees on one universal truth: Without ultra low-cost, heavy lift capability, there is no way that data centers in space can be economically competitive with terrestrial data centers.
Upon announcing Project Suncatcher a year ago, Google said it was planning for the mid-2030s, when launch costs are projected to drop to as little as $200 per kg. The only rocket likely capable of reaching those costs during the next decade is SpaceX’s Starship vehicle, but in recent months it has become clear that SpaceX will prioritize its own payloads (including Starmind data centers) on Starship. For Google to reach its target price of $200 per kg, it would likely require a fully optimized Starship V4 (the company is currently flying a V3 Starship) that reaches a lift capacity of approximately 200 metric tons to orbit.
SpaceX has powerful incentives to prioritize its own orbital computing infrastructure, potentially leaving Google dependent on whatever Starship capacity and pricing SpaceX is willing to offer outside customers. So how does Google plan to reach orbit in the 2030s?
Perhaps this explains the new partnership with Blue Origin, which presently covers a single launch but could grow to more. By the 2030s Blue Origin should be flying the larger 9×4 variant of its New Glenn rocket, but this vehicle could face a cost disadvantage against a fully reusable, high-cadence Starship. And Blue Origin is planning its own orbital data center constellation, Project Sunrise. So again, Google could be stuck subsidizing a competitor while paying higher launch costs.
Can anyone else do this?
Perhaps another company, such as Rocket Lab, Relativity Space, or Stoke Space, will have a larger rocket by then.
But developing a super-heavy-lift rocket requires enormous capital. SpaceX has spent more than $15 billion developing Starship, according to its 2026 securities filings, and Blue Origin has likewise invested billions in developing New Glenn. In terms of time, both companies have put more than a decade of work into their large vehicles. For now, all of these other US launch companies are working through the growing pains of developing medium-lift vehicles.
At this point, Google has some not-great options. It can hope that one of the newer US launch companies steps up for commercial satellite operators and decides not to pursue its own constellation. It could buy one of those newer launch companies. Or Google could hire some rocket scientists to start developing powerful rocket engines and begin chasing SpaceX and Blue Origin in launch—both of which have a 25-year head start.
Moving into AI Product Engineering
Transitioning to AI product engineering requires moving from traditional deterministic software testing to designing flexible evaluations for non-deterministic model outputs.
Deep dive
- Core engineering skills—understanding systems, failure modes, and correctness—are transferable to AI work.
- 'Evals' are essential for testing non-deterministic model behaviors.
- A critical challenge is balancing UI/UX for human oversight versus allowing agents to perform tasks via MCP and API skills.
- Designers must determine when a human needs visual feedback vs. when an agent should act independently.
- The field is currently experimenting with how to provide 'high-fidelity' reports back to users from autonomous agents.
Decoder
- Eval: A test suite used to evaluate the accuracy or performance of an LLM's response against a set of expected outcomes.
- MCP (Model Context Protocol): An open standard for connecting AI models to data sources and development tools.
- Non-deterministic: Referring to systems where the same input can result in different outputs, a common trait of generative AI models.
Original article
Moving into AI Product Engineering
A fellow Whitman alum recently sent me a message asking about my move from leading the feature flags team (“traditional” product engineering) into doing AI product engineering at PostHog. He, like me, had begun his career primarily doing backend engineering, but he was studying AI and considering a similar transition into applied AI work. He wanted to know how I’d found the shift.
The transition hasn’t felt as big as the job descriptions might suggest. Software engineering itself is changing dramatically (citation not needed). While working on an AI product means spending more of my time in less well-defined waters around these changes, staying in systems engineering (i.e. working on the feature flags product & platform) wouldn’t have insulated me from them. To be successful in any engineering role, you still need to understand systems, failure modes, and how to prove correctness.
So that’s what this post is about – why I did it, what I’ve learned so far, and what I’d advise other folks who are considering it.
Using (and critiquing) AI tools was already part of my work
On the flags team, agents had become part of my day-to-day development work. I’d learned how to be productive with them, but I also knew the various ways they could fail and the importance of figuring out systems for validating agentic work.
I’ve written about some of those failure modes before, and as a user, I’d learned to mitigate most of them. But as a product engineer, I started thinking about how to build products that could help users get the same productivity gains I’d experienced without falling into some of the traps I’d had to dig out of.
In short: I’d used agents enough to have opinions about where they helped vs where they got in the way, and I wanted to work on smoothing over those rough patches.
Frontier-shaped problems
I’d already changed up the type of work I’d been doing at PostHog once before. I wrote earlier this year about wanting to get closer to users after spending much of my time on backend infrastructure and how I had moved to working more on the feature flags product (UI + SDKs).
It was a welcome change at first. I rebuilt the feature flags UI, which was fun – a good feature flag UI needs to make it easy to see what a flag is doing and help someone make changes without surprises. The work sharpened my product instincts, but for the most part I was getting better at applying patterns we (as an industry) already understood.
After a few months of that work, I wanted to spend more time on interfaces where we hadn’t figured out what “good” looks like yet. That’s what drew me to AI product engineering (and what I mean by “frontier-shaped”). I still wanted to be close to users, and I was curious about how building software on top of models could change their current workflows.
I had to learn how to write evals
That said, there are some less obviously applicable skills that are required in AI product engineering that don’t really come up much in traditional product engineering, and one big one is writing evals. The concept is similar to how we think (thought?) about testing for typical software products, but modeled around the nondeterministic behavior of LLMs. As with software testing, I had to turn “what does correct look like?” into something I could test, but evals need to be more flexible than traditional tests. The same request can have several good answers, and sometimes the best response is to ask the user a question.
Say I’m testing a new query tool for an analytics agent and ask it, “How many users signed up yesterday?” It’ll give me an answer, but an eval could show that this tool now counts signup events instead of unique users when I ask for the same number by country. That’s the kind of regression I want to catch before shipping, and that’s the kind of thing an eval helps with.
If you’re considering AI product engineering, I’d learn to write evals alongside building the product. My teammate’s post on how to benchmark AI agents is a good place to start.
The interface is the hardest part for me
The trickiest part for me so far, though, is figuring out the balance between building UI (and thinking about human UX) and making the same capabilities available through MCP (Model Context Protocol) and skills (which requires thinking about the agent UX, so to speak).
I definitely haven’t dialed this yet, but here’s what I’m thinking about so far:
For workflows, I think MCP and skills generally beat the shit out of clicking through a UI – if I know what I want done, I’d rather tell an agent and let it handle the steps.
But, if we’re at a part of the product where we want a human to decide what sort of workflow the agent should actually do, those tend to be areas where I want a UI. Things like an agent rolling out a feature flag (I’d want to see a blast radius and a graph of the potential image) or asking me to fix an error (I’d love to see a visual of “which users are affected”) We can do all that with text (and we probably still need text), but designing intentional visual previews in Agent-human UIs can help hmans spot things quickly that might be missed if they’re buried in words.
To that point – I don’t have a deep take on this yet, but one thing I still think about a lot when designing UX in the age of agents is how humans learn to make sense of what we can see long before we learn to read, and I want to make sure I’m building systems where agents can do things as effectively as possible while reporting back to humans in the way that is highest fidelity for them.
That’s the part of AI UI/UX I’m still working on getting my head around, I think. To what extent should agents do? To what extent should humans see and decide? We talk about “human in the loop” all the time, but nobody really knows where the human belongs yet, and I think we’re all still figuring it out.
It’s pretty fun, though.

LLM-assisted reverse engineering
Modern reverse engineering is being transformed by agents that can iteratively hypothesize, test, and document binary structures in record time.
Deep dive
- Use Ghidra for disassembly and MCP (Model Context Protocol) bridges for agent integration.
- Maintain a persistent state by forcing agents to document all findings in Markdown files.
- Use a hypothesis-driven debugging loop: formulate a theory, design a specific experiment to prove it, log the result, and repeat.
- Prefer Rust for implementing hacks due to strict compiler feedback that prevents agents from generating memory-unsafe code.
- Use UV for Python dependency management to create portable, single-file scripts for prototyping.
Decoder
- Reverse Engineering: The process of deconstructing software or hardware to understand its function and design, often without source code.
- MCP (Model Context Protocol): An open standard that allows AI agents to interact directly with local or remote development tools like disassemblers.
- Firmware: Low-level software that provides control for a specific piece of hardware.
Original article
I have been hacking both hardware and software for 2 decades. Previously manually. But in 2026 with the help of AIs the proccess is greatly sped up. Below I will describe my proccess briefly or how I do it.
Set Up
Tools which I mostly use are these:
- DeepSeek Harness + Deepseek v4.1 Flash: Thats the AI I am using. Occasionaly I use Codex with Luna or Terra but Deepseek is super performant, fast and cheap.
- Ghidra + MCP bridge: The best in the market, free, disassembler and decompiler. With the MCP bridge agents can use it very well.
- radare2 and kuna: CLI disassemblers and decompilers. Not as good as Ghidra but much faster and possibly better usable for AIs.
Process
What I basically do nowadays is just point the agent at the binary to be analysed and use my set of dedicated agent skills. Rest usually takes care of itself. But putting the skills besides, the flow is basically this.
- Find binary type, platform, build etc - based on this using appropriate decompiler (note - current AIs do fairly well with just disassembly . ie pure x86 or ARM instructions).
- Command agent to document all findings along the way to MD files. This serves several purposes. They become notes for your own understanding. They help the agent not lose the track after compaction / handoff to different agent. And last but not least, it helps the agent work more effectively, not get lost in circles etc. More about this later.
- Ask the agent to analyse basic structure. Main functions, main branching, imported functions etc of given binary. By binary I mean whatever. Desktop executable, website or firmware image.
Once I have this basic overview I can usually proceed any way I need to do modifications to the original binary or build mods or just help me understand it better.
On some occasions some things are not easily resolvable by simple disassembly or decompilation. In those cases you can do:
- Let the agent debug given binary and set breakpoints on specific parts to help it figure out given inner workings.
- Use logging. Either by somehow enabling it in the original binary or by making a probe (and this can mean many things) that injects to the original binary and records you via logs (to file) whatever is needed to resolve given feature.
- Give agent outside access - ie computer use for desktop apps, or api controllable emulator for running and controlling given firmware.
- Ask agent to try different approach. But you must be specific. Ie when it gets stuck in disasembly by following xrefs, ask it to try to follow strings in the binary instead.
- Read the entire LLM conversation and thinking. Current LLMs are smart but they still sometimes get to a narrow approach. By reading the traces you can often instinctively figure the agent it going into a blind path and give it suggestion as to how it might be approached better. That however skill of your own to have.
SKILLS
Here are some of my major skills I use frequently.
Matt Pottock - Grill me
It gives you several questions when your input might be valuable. I usually use it with this prompt:
Use skill /grill-me to ask me up to 5 questions
whose answers are crucial for your further progress.
Ask only one question at a time.
Ghidra / other RE tooling skill
It helps a ton to have a skill where your specific reverse engineering tooling is described. Ie to use radare2 or kuna. Or description of how to use the MCP Ghidra bridge and for what. Without such a skill, agents often give up too quickly getting lost, not knowing how to do the actual disassembly / decompilation.
Hypothesis debugging
That is also my own skill. Its related to how I wrote earlier how important it is to make the agent document everything into MD files. This skill forces agent who is getting stuck to follow this loop:
- Make a hypothesis of why / how something works. Write it down into CSV table of hypotheses, saved on disc.
- Design experiment (probe, logging, ...) which will definitively prove or disprove this hypothesis.
- Record the result.
- Repeat.
Implementation of hacks and probes
For implementing anything I basically go for 2 toolings.
- Python but with UV tooling. UV tooling allows to make custom
envssuper quickly and portably. Also allows to make single-file, inline dependencies scripts. Python is great for prototyping or quickly making probes or even decompilation helpers. - Rust for actual implementation of given hack. Whenever it is possible I am using rust for this. It has many reasons but he two main are:
- it is very elegant language for me personally to work with and
- it provides brutally good feedback loops to the agent when it iterates - the compiler is very strict and points the agent immediately to any possible memory or syntax issues he might be heading to.
My hacking successes
With the AI assisted reverse engineering I was able to achieve such crazy reverse engineering succeses, in the last 6 months, which would take me years each on its own, if done by hands.
- Reverse engineered and hacked Alphasmart NEO typewriting device
- Completely mapped communication protocols of many devices like EmWave biofeedback device or both my Sony Alpha mirrorless cameras.
- Hacked into and developed custom firmwares for musical synthesizers:
- Arturia MiniFreak
- Teenage Engineering OP-Z
- Akai MPC Sample
- Made custom firmware for Xteink X4 ebook reader
- Fixed driver for old HP printer for MacOs
- Cracked tons of license-locked abandonware softwares from my youth
- Developed custom lightweight Evernote client
Final thoughts
Reverse engineering and hacking into old softwares or devices has always been a hobby for me. I understand assembly, I understand hardware. But it was long and tedious process.
With the cheap accesibility to smart LLM tools in these days, this hobby took dramatic turn for me. I do not miss manually analyzing the assembly instructions. But I love quickly getting the results. Yes my long experience helps me steer the agents the correct way. But that is also fun. And I am learning a ton of things along the way.
I wish everyone would try to do some hacks of his own. For me the hobby is driven by curiosity. And LLMs didn't take that away. They gave me turbo boost to my wonderings and explorations. Let's free our minds!

A game you cannot win unless you have a quantum computer
Google Quantum AI researchers demonstrated 'quantum contextuality' on a 105-qubit processor, proving it can solve games that are impossible for classical computers.
Deep dive
- Quantum contextuality means measurement outcomes are not fixed before observation but depend on the full context of other measurements performed.
- The 'magic square' game is impossible for classical systems because row and column parity requirements are contradictory.
- Google's Willow processor achieved a 98.3% win rate, far exceeding the 88.89% classical limit.
- The team measured the Bell–Kochen–Specker inequality (χ), achieving 5.590 (where 4 is the classical limit and 6 is the quantum limit).
- Quantum effects remain useful at scale, demonstrated by consistently beating classical parity rules in games with up to 71 qubits.
- This benchmark detects subtle coherent hardware errors that standard random-circuit tests miss.
Decoder
- Contextuality: A principle of quantum mechanics where the outcome of a measurement is not an intrinsic property of the system but depends on the context of other measurements made.
- Qubit: The basic unit of quantum information, analogous to a classical bit but capable of existing in a superposition.
- Bell Pair: A pair of entangled qubits that share a correlated quantum state.
- GHZ State: A multi-qubit entangled state used to test quantum coherence and parity rules across many particles.
Original article
A game you cannot win unless you have a quantum computer
On a superconducting processor, we turned one of quantum mechanics’ strangest features into something you can measure, benchmark, and put to work across systems as large as 105 qubits.
Here is a Sunday paper-style puzzle you can try right now. Draw a 3×3 grid. Fill every cell with either +1 or −1, subject to two rules: each row must multiply to +1, and each column must multiply to −1.
Go ahead. We’ll wait…
You didn’t manage it, right? There is an elegant reason for that. For a row to multiply to +1, it needs an even number of −1s. For a column to multiply to −1, it needs an odd number. Add up the rows and you learn the grid contains an even number of −1s. Add up the columns and you learn it contains an odd number. Well…That’s impossible!
The grid would have to be two contradictory things at once. No such table exists; it is a paradox.
Now turn the puzzle into a game: Each round, Alice is handed a row and Bob a column. Without talking, Alice fills her row by the row rule and Bob fills his column by the column rule. They win if they put the same number in the square where their row and column intersect. Any plan made in advance is just a pre-written table, meaning at best they will win 8 out of 9 rounds. This changes if they use a quantum computer. It won't fill in the impossible grid, but in principle, it lets them win every round.
The reason is a property called quantum contextuality, arguably the strangest feature of quantum mechanics. Einstein once famously asked whether the moon is there when nobody looks, his way of insisting that physical properties ought to exist whether or not anyone measures them. For quantum systems, contextuality is the precise, experimentally testable statement that the answer can be no: you cannot assign fixed, pre-existing values to everything you might measure.
What a measurement yields can depend on which other compatible measurements you make alongside it (i.e., on its context). This is not only a deep philosophical statement, but more so, cutting-edge science and the basis of a new technology. And in the game above, Alice and Bob can use it to engineer a solution. Their answers are not looked up in a hidden table written in advance; the table does not exist. Their answers come into being as they measure, and quantum correlations stitch them together more tightly than any classical rulebook permits.
Entanglement usually gets top billing as the “magic ingredient” of quantum computing. But a growing body of theory suggests contextuality is the deeper resource, the thing that actually powers certain quantum algorithms past their classical counterparts. The catch is that, until recently, contextuality had been demonstrated almost exclusively in small systems of a few particles. Whether it survives, and stays useful, in the many-body systems that real quantum computers are made of was an open question.
That is the question we set out to answer. In "Quantum-classical separation in bounded-resource tasks arising from measurement contextuality," published in Science, we demonstrate and measure contextuality on our superconducting quantum processors. Our qubits win the magic square game 98.3% of the time, exceed the classical limit on a contextuality test, and outperform classical strategies in tasks spanning up to 105 qubits. Along the way, these tasks proved to be a sensitive new benchmark for quantum hardware, catching subtle errors that random-circuit tests miss.
Beating the classical bound
We ran what is commonly called the magic square game on our Willow quantum processor. Alice and Bob each hold two qubits, sharing two entangled Bell pairs instead of a pre-written table, and measure them using preset settings for their assigned row or column to get their ±1 entries.
The best conceivable classical strategy loses at least one round in nine, winning at most 88.89% of the time. When we played all nine versions of the game 100,000 times apiece, our qubits lost roughly one in sixty, winning 98.30% of them (0.9830 ± 0.0001).
The gap is meaningful and statistically significant: our qubits coordinated better than any pre-written table allows. That's because no cell has a value fixed in advance. Each answer takes shape only when it is measured alongside the rest of its row or column (its context), and shared entanglement makes Alice's and Bob's answers for the shared cell agree.
With shared entanglement and a prearranged measurement plan, Alice and Bob can in principle agree at the intersection in every round. On our hardware, noise causes about one loss in 60.
Putting a number on contextuality
The magic square game demonstrated the potential power of contextuality, so next we set out to measure how contextual a machine is. We used a Bell–Kochen–Specker inequality, closely related to the famous Bell test which showed that entangled particles like the Bell pairs above can't carry answers fixed in advance. Our inequality bundles a set of correlations into a single number, χ. In terms of the rows and columns from the game above it reads, χ = R1 + R2 + R3 − C1 − C2 − C3, where R and C represent the products of the rows and columns Alice and Bob had to calculate earlier:
| +1 | +1 | +1 | R1 = (+1)*(+1)*(+1) = +1 |
| +1 | −1 | −1 | R2 = (+1)*(−1)*(−1) = +1 |
| −1 | +1 | −1 | R3 = (−1)*(+1)*(−1) = +1 |
| C1 = (+1)*(+1)*(−1) = −1 | C2 = (+1)*(−1)*(+1) = −1 | C3 = (+1)*(−1)*(−1) = +1 | χ = 4 |
Any universe where measurement outcomes are predetermined must obey χ ≤ 4 (try a few tables and you will see that χ can only take values -4, 0, and 4). Quantum mechanics permits values up to 6, which can only happen if all Rs = +1 and all Cs = -1. And unlike most such tests, this one is state-independent: it doesn’t matter how you prepare the qubits, which makes it a property of the machine rather than of a carefully chosen input.
Measuring χ is demanding: every row and column must be measured on the same two qubits, one after another, without disturbing them. We did this with an extra helper qubit (an "ancilla") that picks up each result and is measured instead, leaving the two main qubits intact. We ran 540 measurements in a row, repeated 1,000 times.
We measured χ = 5.590 ± 0.008.
Comfortably past the classical bound of 4 and only 7% away from the quantum limit. A number that says: the contextuality is in this machine in this quantity.
Does it survive at scale?
Two qubits are one thing, but quantum effects are fragile, and every added qubit brings noise that can wash them out. Useful quantum computing needs many qubits working together, so the question is whether contextuality survives at scale.
In the GHZ parity game, N players share one entangled GHZ state (a superposition of all qubits being 0 and all being 1). Each player gets a one-bit question and answers with one bit, without communicating. They win if the parity (even or odd) of all the answers matches a rule set by the questions. Random guessing wins half the time, and the best classical plan does only a bit better: 75% for three players, shrinking toward 50% as players are added. A shared GHZ state wins every time. We played with up to 71 players, one per qubit. Noise keeps us below 100% and grows with each added qubit, so our lead narrows, but we stay above the classical bound throughout. We also verified genuine entanglement across 45 qubits, more than the full size of many earlier GHZ experiments.
Each player measures their qubit in a basis set by their question bit. Despite hardware noise, the measured win rate stays above the best classical strategy by many standard deviations, up to 71 players.
Beyond multiplayer games, the same physics separates shallow quantum and classical circuits. In 2018, a landmark theorem proved that a specific problem, finding a hidden linear function, can be solved by a constant depth quantum circuit, and that no classical circuit of constant depth can. The source of this quantum advantage traces back to contextuality.
In this proof, constant depth matters. It means the circuit doesn’t get deeper as the problem gets bigger. Because every output bit is computed in a fixed number of steps, information has time to travel only a short distance. Each classical output can therefore only “see” a small neighborhood of the input, like a rumor that must cross a city in three minutes. Quantum circuits, with entanglement already laid down, are not so limited.
That algorithm had never been run at scale on real hardware. We ran it, solving hidden-linear-function instances on grids of up to 105 qubits, with success probabilities above one-half, using exactly the shallow-circuit recipe the theory prescribes.
By applying a few layers of gates, we can encode a hidden linear function problem on our processor. As the system size grows, noise degrades the probability of success from ~1 to 0.6 when reaching maximum processor size, still staying above the conjectured classical bound.
The unexpected dividend: A better ruler
While running these experiments, something useful happened along the way. These tasks demand that many qubits agree simultaneously and exactly. Running them surfaced subtle coherent errors in our system, the kind that rotates a quantum state slightly off-target, which conventional random-circuit benchmarks tend to average away into invisibility.
That suggests a second use for contextuality: not just as a computational resource, but as a ruler.
Most benchmarks ask whether a processor can clear some classical bar. These tasks instead give hardware a ceiling set by physics itself: χ = 6, a win probability of 1, a perfect contextual fraction. The distance between what a machine achieves and what nature permits becomes an objective, meaningful score. And unlike classical bars that get easier to clear, this ceiling never moves. The better our quantum processors get, the more precisely such a benchmark discriminates. This is particularly relevant for real-world applications, such as simulations of molecules for chemistry and materials science, because it measures a processor’s ability to run structured algorithms, where subtle errors can’t hide.
What comes next
A nearly century-old argument about whether physical systems always exist when nobody looks turns out to have a measurable test. For our qubits, the verdict is clear: not everything we measure can have pre-existing values waiting to be observed. Theory links contextuality to the "magic states" that error-corrected quantum computers need to run full algorithms, which our team recently prepared using magic state cultivation.
Measuring contextuality across many qubits lets us probe an open question in physics and computer science on real hardware: what gives quantum computers their edge.
Acknowledgements
This work was carried out by the Google Quantum AI team together with our academic collaborators. We thank everyone who built and maintained the hardware, control electronics, cryogenics and software that made these experiments possible.
Do not buy RAM, compress!
Instead of upgrading expensive RAM, Linux users can use zram or zswap to compress memory, often achieving 3x to 4x capacity increases.
Deep dive
- Memory compression allows systems to hold more data by storing pages in a compressed RAM region rather than writing to disk.
- Compression ratios of 1:3 or higher are common for typical workloads (browsing, background tasks).
- zram creates a compressed block device in RAM, whereas zswap acts as a compressed cache between the page cache and the disk.
- Most desktop Linux users should favor zswap as it is more efficient for managing memory pressure.
Decoder
- zram: A kernel feature that creates a compressed block device in RAM to act as a swap space.
- zswap: A feature that provides a compressed write-back cache for swapped pages, intended to reduce disk I/O.
Original article
Do not buy RAM, compress!
AI has changed a lot. We do more work in parallel. This increases the memory demand on our workstations. Also, memory is expensive and often not extendable. So buying more RAM is not an easy option. Recently I was running out of memory, I found my solution in zram, a solution to compress memory.
Memory compression is not new. If you have a Windows or Mac device you are already using it. Also, many Android smartphones utilize the technique of using compression to put more data into the RAM. Unfortunately not all Linux environments have RAM compression enabled by default. Fedora, Pop!_OS do, but Ubuntu doesn’t. Amazon Linux only enables zram on smaller virtual machines. Most other distributions do not have it enabled.
Compressing memory does come with small, but not really noticeable, downsides. It takes a little bit more from your CPU and adds latency to some processes. What you gain is gigantic amounts of extra capacity. It is not uncommon to see compression ratios up to 1:4.
I remember that in the early days of writing SaaS software we would often need double the size of the machines when we added more features to our monolithic app. Often the CPUs were under little stress, so we could have avoided upgrading if we had enabled RAM compression. This could have cut our Cloud spend in half!
How it looks in practice
I opened a lot of websites in Firefox. So many, it would almost fully take all system memory. (I have 32GB with some reserved for the graphics)
for u in nos.nl nu.nl telegraaf.nl ad.nl volkskrant.nl nrc.nl rtl.nl tweakers.net buienradar.nl ns.nl npo.nl \
  bbc.com/news edition.cnn.com theguardian.com nytimes.com reuters.com apnews.com aljazeera.com dw.com spiegel.de lemonde.fr washingtonpost.com bloomberg.com \
  theverge.com arstechnica.com techcrunch.com wired.com engadget.com phoronix.com lwn.net news.ycombinator.com tomshardware.com \
  github.com/torvalds/linux github.com/microsoft/vscode github.com/rust-lang/rust stackoverflow.com/questions gitlab.com developer.mozilla.org docs.python.org kernel.org ubuntu.com huggingface.co \
  youtube.com "youtube.com/results?search_query=linux" "youtube.com/results?search_query=music" "youtube.com/results?search_query=documentary" twitch.tv vimeo.com dailymotion.com soundcloud.com open.spotify.com \
  reddit.com reddit.com/r/linux reddit.com/r/worldnews reddit.com/r/pics reddit.com/r/technology x.com instagram.com linkedin.com pinterest.com tumblr.com imgur.com 9gag.com medium.com quora.com \
  bol.com coolblue.nl marktplaats.nl amazon.nl amazon.com ebay.com aliexpress.com ikea.com/nl/nl zalando.nl etsy.com mediamarkt.nl ah.nl \
  google.com/maps openstreetmap.org booking.com airbnb.com tripadvisor.com klm.nl schiphol.nl \
  en.wikipedia.org/wiki/Linux en.wikipedia.org/wiki/Netherlands en.wikipedia.org/wiki/Amsterdam en.wikipedia.org/wiki/World_War_II nl.wikipedia.org/wiki/Nederland \
  imdb.com rottentomatoes.com archive.org nationalgeographic.com nasa.gov flickr.com/explore espn.com weather.com \
  canva.com figma.com notion.so trello.com office.com dropbox.com wikihow.com; do
  firefox --new-tab "https://$u" >/dev/null 2>&1; sleep 1
done
If we look at the running apps, then we see it should not fit.
In the memory usage we see that some demand was placed into the zram swap space.
In the terminal we can check how much memory is used, and we can calculate the compression ratio.
5.7G of data in 1.7G of RAM. That’s a compression ratio of 1:3.35.
Getting started with zram compression
Compressing RAM is something which helps to get you more out of your own hardware, but also out of your cloud environment. Do more with less.
The Arch Linux wiki has a good article on how to get started.
Looking forward to hearing about your experiences.
Update (20 November 2026)
zram is nice, but zswap is better!
Yesterday the article got featured on Hacker News.
Nice to see the conversation and I hope that some of you started experimenting with compressing memory. Making more efficient use of the available resources is something important to understand as a community.
Two articles were mentioned that I think are a very important addition. While zram works fine for my situation, they advocate that zswap is the better option for most situations. After reading both articles I agree with this conclusion.
So, I will be changing my configuration to use zswap instead.
Make sure to read the following:
- I was wrong! zswap IS better than zram by Hayden James, in Blog Linux
- Debunking zswap and zram myths by Chris Down

AI isn't replacing your job. It's turning it into low-paid gig work
Data labeling platforms are shifting from low-wage labor pools to high-credential professionals, but they are applying the same volatile, precarious gig-work dynamics.
Deep dive
- High-credential roles (e.g., cardiologists, lawyers) are being used to rank and verify model outputs, with initial pay rates often used as a tool to recruit talent quickly.
- Platforms like Outlier (Scale AI) and Mercor use terms that allow immediate, unilateral account deactivation and payment withholding.
- The 'extractivist' model relies on moving work to wherever labor is cheapest or most compliant, repeating cycles of wage suppression regardless of the worker's education level.
- Legal challenges, such as class-action lawsuits regarding worker classification, are currently active in San Francisco and Kenya, though they have yet to curb the underlying model.
Decoder
- Platform Extractivism: An economic model where digital platforms extract value from users and workers in lower-income regions or marginalized groups by controlling the infrastructure and terms of work while capturing the majority of the profit.
- Data Annotation: The process of labeling or tagging data (images, text, video) to provide ground truth for training machine learning models.
Original article
The gig economy has arrived for cardiologists. Recruiting platform Outlier, run by Scale AI, advertises offers of up to $180 an hour for physicians in the U.S. to design complex cardiac scenarios, review artificial intelligence-generated reports, and rank model outputs. The site offers up to $7.50 an hour for Tagalog work in the Philippines for the same job, and up to $12.50 an hour for Swahili in Tanzania.
Companies like Scale AI first outsourced data work to wherever labor was cheapest. Now, they are recruiting physicians, lawyers, and Ph.D.s to generate and annotate data, rank model answers, and verify outputs. Higher credentials can raise the advertised rate, but the platform still controls payment and working conditions.
They begin by paying well to build a workforce, then they cut the rates and move on.
I’ve spent the last six years interviewing the people who do this work. Most were in Venezuela, where economic collapse has left a large, educated population online and out of options. One of them, Rogelio, taught computer science until the economic crisis and the pandemic left his family without work. His 13-year-old son discovered they could earn money labeling images of cars and roads on the platforms Hive and Scale AI’s Remotasks, using a laptop the Hugo Chávez government had issued to schoolchildren a decade earlier. The boy made 18 cents for a few hours of work. Rogelio joined him and made just over $2 on his first day.
For a while, the work paid. A task called Beast Mode where workers labeled objects in people’s homes paid more than any other work the family had done. In December 2020, with schools closed and the whole family working, it brought in $20 in a single day. It was the most they would ever make. By early 2021, Beast Mode had disappeared, and their earnings fell below Hive’s $5 weekly payout threshold.
This is how many platforms operate: They begin by paying well to build a workforce, then they cut the rates and move on. Remotasks ended its hourly program in Venezuela in 2021 and made a splash in Kenya the same year. In March 2024, it discontinued operations in Kenya, Nigeria and Pakistan. Scale AI attributed the closures to “enhanced security protocols,” and said notices had gone out three weeks ahead but later acknowledged that Kenyan workers never received them “due to operational errors.” Most workers who spoke to Rest of World at the time said the platform simply froze them out.
The pattern has a name, and it’s older than AI: extractivism. It is a system that takes resources and value from people and places for accumulation elsewhere, on terms set by the buyer rather than the worker. The term also stands for what is taken and what is left behind. The crisis that put Rogelio’s family online was the residue of an oil economy that built little else.
An oil field stays put, while a platform can send the next batch of tasks to workers somewhere else.
One woman I interviewed in Venezuela drew a pension from the state oil company. By 2021, it was worth about $1 a month, which she said couldn’t buy half a dozen eggs. She was labeling data on Hive to make up the difference, but that income was even less secure. An oil field stays put, while a platform can send the next batch of tasks to workers somewhere else.
AI is usually described as built on extracted data: authors’ books, artists’ works, all used to train models. But the extraction has another layer: the new examples, evaluations, and corrections commissioned to improve those models. That material has to be created by someone, for a fee, which is set by the platform — whether it is $2 for the teacher in Venezuela or up to $180 an hour for a cardiologist in the U.S.
Outlier’s terms let the company delay or suspend payment during an investigation of a worker’s tasks and withhold “some or all amounts accrued” where it finds a violation “in the company’s sole determination.” The company may also deactivate an account “immediately without prior notice for any reason.” The same language appeared word for word in the Remotasks terms that Rogelio’s family worked under in 2021.
Earlier this year, Josh Dzieza reported on the laid-off lawyers, scientists, and screenwriters now filling these platforms. Of the more than 30 workers he interviewed, nearly all described the same arc: Demands increased, target times shrank, and pay fell as a project went on. One designer was tagging videos for Meta at $21 an hour when the project ended for “scope changes.” Days later, the same job reappeared under a new name at $16 an hour — the same sequence that Rogelio’s family went through five years earlier.
Of course, workers can leave, and many do. But the ones who stay are often those who can’t leave. One woman I interviewed was confined to her home during the Covid-19 pandemic by a health condition and couldn’t risk losing the job. “This is my only source of income,” she told me.
The rate can change suddenly, the task can disappear without warning, and they have no say over any of it.
None of this is unknown within the industry. In a 2024 meeting convened by the nonprofit Partnership on AI and the Fairwork project which rates platform companies, I sat with representatives of AI companies and the outsourcing firms that supply them. The AI companies said they didn’t employ the data workers; the outsourcing firms said their operations were determined by the prices the AI companies expected. Everyone agreed pay should be better, but when the question of representation came up, the room went quiet as no workers were present.
Workers have still acted. In March 2023, a judge in Kenya temporarily halted the dismissal of 260 Facebook content moderators, prevented Meta from moving their work to another contractor, and barred Meta and contractor Majorel from blacklisting workers. As workers fought in Kenya, Meta moved the work to West Africa.
American courts are also grappling with this issue. Claims by workers on Scale AI’s platforms led to a proposed settlement that has received preliminary approval in San Francisco. The company denies wrongdoing. A separate class action suit alleges Mercor misclassified more than 30,000 lawyers, doctors, and engineers while setting their pay and reviewing their work. Mercor’s clients have included OpenAI, Anthropic, and Meta, but they are not named as defendants. The case is ongoing.
A cardiologist who is offered a three-digit hourly rate is not in the same position as Rogelio and his family. What connects them is the fact that the rate can change suddenly, the task can disappear without warning, and they have no say over any of it.
The work will keep moving, and the rules will continue to be set by the companies that commission it, wherever the next worker logs on, whether in Kenya, Venezuela, or the Philippines.
Introducing mTLS for Network Load Balancer
AWS Network Load Balancer now natively supports mutual TLS, allowing offloading of certificate validation and identity filtering from backend services.
Deep dive
- Feature: Mutual authentication at Layer 4 (TCP/TLS) within the AWS Network Load Balancer.
- Revocation: Supports Certificate Revocation Lists (CRL) uploaded to S3.
- Filtering: Allows filtering incoming traffic based on certificate fields (CN, OU, SAN DNS, SAN URI/SPIFFE) using exact or prefix matching.
- Performance: Maintains Layer 4 throughput while handling TLS termination and certificate inspection.
- Integration: Compatible with AWS Private Certificate Authority and third-party CAs.
- Observability: Exposes handshake metrics in CloudWatch and provides detailed rejection reasons in access logs.
Decoder
- mTLS (mutual TLS): A security protocol where both the server and the client provide and verify digital certificates, ensuring mutual trust.
- SPIFFE: A standard for platform-agnostic, cryptographically verifiable identities for software services.
- Trust Store: A repository of trusted root certificate authorities used to verify the authenticity of a client certificate.
Original article
Introducing mTLS for Network Load Balancer
Many teams use mutual TLS (mTLS) to verify that only trusted clients reach their applications. To implement it, they build home-grown solutions or run third-party proxies, which are hard to maintain because the X.509 libraries they depend on need frequent updates. Building and running these solutions also consumes developer time and compute resources. Today, we are bringing mTLS to Network Load Balancer (NLB).
NLB operates at Layer 4 (TCP, UDP, and TLS), handles millions of requests per second at ultra-low latency, and terminates TLS for your applications. Now NLB also handles mutual authentication for you, so you no longer need to build, update, or run your own mTLS solution. NLB supports mutual authentication in verify mode. During the TLS handshake, NLB presents its server certificate, which the client verifies. NLB also authenticates clients that present X.509 certificates, checks whether their certificates have been revoked, and can restrict access to specific certificate identities with client certificate filtering. This post explains how the feature works, how to set it up, and what to consider when you design your deployment.
TLS and mTLS
NLB already supports TLS listeners, which terminate TLS connections from clients. With TLS, only the client authenticates the server. With mTLS, the client and the server authenticate each other. The server requests a certificate from the client, and the client sends one and proves it holds the matching private key. The server then validates the client certificate’s chain of trust and expiry. Figure 1 shows the mTLS handshake.
Figure 1: mTLS handshake between a client and a server
Customer use cases
Use mutual authentication on NLB in situations like these:
- Central public key infrastructure (PKI), shared trust: Your central PKI team manages your certificate authorities (CAs) and revocation lists. You use AWS Private Certificate Authority, third-party CAs, or self-signed CAs. Your security team wants every application to authenticate clients against the same trust stores.
- Revocation without replacing the root: You need to invalidate individual client certificates, such as those of retired devices or offboarded partners, to revoke their access while the root CA that signed them stays valid.
- Access control finer than the CA: Your CA issues certificates to production, staging, and corporate environments, but only production clients should reach this service. With client certificate filtering, NLB admits only certificates whose fields match a filter on the listener, such as an Organizational Unit (OU) of Production, a Common Name (CN), or a Secure Production Identity Framework for Everyone (SPIFFE) ID, so you don’t need a separate CA for each access boundary.
- Device fleets over TCP: You run a fleet of Internet of Things (IoT) devices that connect to a TCP service behind NLB. Each device has its own SPIFFE identity, and only your devices should reach the service.
How NLB supports mTLS authentication
You attach a trust store to an NLB TLS listener and set mutual authentication to verify mode. During the handshake, NLB presents its server certificate as it does for any TLS listener, then checks the client certificate against your trust store, any client certificate filters, and any revocation list. Only clients that pass every check reach your targets, and targets receive no client certificate data, so your backends need no certificate inspection logic.
Client certificate filtering, new with NLB mTLS, adds identity-based access control on top of trust validation. A single CA often issues certificates to many environments or teams, so trusting the CA admits all of them. With filtering, you list the identities allowed to connect, such as an Organizational Unit, a Common Name, a DNS name, or a SPIFFE ID, and NLB rejects every other certificate during the handshake. Because NLB doesn’t pass certificate fields to your targets, filtering is how you enforce client identity without adding that logic to each backend.
Figure 2: NLB mTLS verify mode architecture
Figure 2 shows the end-to-end flow.
- Upload your certificate authority (CA) certificate bundle and, optionally, a certificate revocation list (CRL) to Amazon Simple Storage Service (Amazon S3).
- Create a trust store from the CA bundle and optionally add the CRL to it.
- Configure a TLS listener with mutual authentication in verify mode that uses the trust store. Optionally, configure client certificate filtering.
- A client opens a TLS connection. NLB sends its server certificate and requests the client’s certificate.
- NLB validates the client certificate. It checks the chain of trust to a root in the trust store and the expiry of every certificate in the chain. It also checks for the clientAuth purpose in the Extended Key Usage (EKU) extension. If you allow expired client certificates, NLB accepts an expired client certificate that otherwise chains to a trusted CA.
- If you configured client certificate filtering, NLB compares your filters with fields in the client certificate.
- If the trust store includes a CRL, NLB checks the client certificate against it.
- If every check passes, NLB accepts the connection and forwards traffic to the targets. If any check in steps 5–7 fails, NLB closes the connection and records the failure in its access logs. For the full list of failure scenarios, see Mutual authentication in the User Guide for NLB.
How NLB evaluates client certificate filters
You can filter on four fields: Subject.CN (Common Name), Subject.OU (Organizational Unit), SAN.DNS (DNS names in the Subject Alternative Name), and SAN.URI (URIs in the Subject Alternative Name, including SPIFFE IDs). Each filter uses one of two match types:
EXACTmatches when the certificate field value is identical to the configured value.PREFIXmatches when the certificate field value starts with the configured value. This suits hierarchical identities such as SPIFFE URIs and domain name prefixes.
For the Subject.CN, Subject.OU, and SAN.DNS fields, matching is case-insensitive. For the SAN.URI field, the scheme and host are matched case-insensitively, and the rest of the URI, such as the path, is matched case-sensitively. For example, a filter value of SPIFFE://EXAMPLE.COM/workload matches spiffe://example.com/workload, but does not match spiffe://example.com/Workload.
NLB evaluates filters with these rules:
- After cryptographic checks. The order is trust chain validation, then filtering, then the CRL check. NLB never inspects the fields of an untrusted certificate.
- OR logic, fail-closed. One matching filter is enough to pass filtering. If filters are configured and none match, NLB rejects the connection.
- Multiple values. When a field has several values, such as multiple OUs or DNS names, a filter matches if any one value matches.
- Missing fields. If a certificate lacks the field a filter references, that filter does not match.
- Per listener. Filters belong to a listener, so listeners that share a trust store can enforce different policies.
Filtering is optional. Without filters, NLB accepts every connection that passes trust chain validation and revocation checks. Certificate filtering is included with NLB mutual authentication at no additional cost.
Prerequisites
Have the following in place, all in the same AWS Region:
- A virtual private cloud (VPC) with at least two subnets in different Availability Zones.
- A security group for the load balancer that allows TCP 443 from your clients, and a backend security group that allows the listener’s target port from the load balancer.
- A TCP target group with a healthy backend.
- A server certificate for the TLS listener in AWS Certificate Manager (ACM).
- AWS Command Line Interface (AWS CLI).
- OpenSSL, to create the test certificates.
- A private Amazon S3 bucket in the same Region, to hold the CA certificate bundle.
Set up mTLS on NLB
In this walkthrough, you use OpenSSL and the Amazon Elastic Compute Cloud (Amazon EC2) console to create test certificates, set up an NLB with mTLS in verify mode, and test it with trusted and untrusted clients. You then add client certificate filtering to admit only specific identities.
Step 1: Create test certificates and upload the CA bundle
In this step, you create a test CA and two client certificates with OpenSSL, then upload the CA certificate to Amazon S3 so NLB can build a trust store from it. client1 is signed by your CA, so NLB accepts it. bad-client is self-signed, so NLB rejects it. If a client certificate includes an Extended Key Usage (EKU) extension, that extension must contain clientAuth, or NLB rejects the certificate. If you already have a CA, upload its certificate bundle instead and issue client certificates from it.
openssl req -x509 -nodes -days 365 -newkey rsa:2048 \
  -keyout ca.key -out ca.pem -subj "/CN=example-root-ca"

openssl req -new -nodes -newkey rsa:2048 \
  -keyout client1.key -out client1.csr \
  -subj "/OU=Engineering/CN=client1.example.com"
printf "%s\n" "extendedKeyUsage=clientAuth" > client1.ext
openssl x509 -req -days 365 -in client1.csr \
  -CA ca.pem -CAkey ca.key -CAcreateserial \
  -extfile client1.ext -out client1.pem

openssl req -x509 -nodes -days 365 -newkey rsa:2048 \
  -keyout bad-client.key -out bad-client.pem -subj "/CN=rogue.example.com"
Upload the CA certificate to a private Amazon S3 bucket in the same Region:
aws s3 cp ca.pem s3://amzn-s3-demo-bucket/ca-bundle.pemStep 2: Create the Network Load Balancer and configure the TLS listener
In this step, you create an internet-facing Network Load Balancer in your VPC from the Amazon EC2 console (Figure 3). Choose two subnets in different Availability Zones for high availability, and attach the load balancer security group from the prerequisites (Figure 4).
Figure 3: Basic configuration
Figure 4: Network mapping and security groups
Next, configure a TLS listener on port 443 that forwards to your target group. Keep the recommended security policy, and choose your server certificate from ACM (Figure 5).
Figure 5: TLS listener and server certificate
Step 3: Turn on mTLS and create a trust store
In this step, you turn on mutual authentication for the listener and create a trust store from the CA bundle you uploaded in Step 1 (Figure 6). A certificate revocation list is optional, and you can add one now or after the trust store is created. The console creates the trust store together with the load balancer.
Figure 6: Turning on mTLS and creating a trust store
Keep the default advanced mTLS settings: NLB rejects expired client certificates and doesn’t advertise your trust store’s CA names to clients (Figure 7). Turn on CA name advertising if your clients hold several certificates, such as smart cards, so each can pick one your trust store accepts. Any connecting client can then see which CAs you trust. Leave Client certificate identity filters empty for now. You configure client certificate filtering in Step 5.
Figure 7: Advanced mTLS listener settings
Step 4: Review, create, and test
In this step, you review your settings, create the load balancer, and confirm that NLB accepts only trusted clients. After the load balancer’s status changes to Active, copy its DNS name. The listener’s mTLS column shows Verify with trust store (Figure 8).
Figure 8: The load balancer with mTLS in verify mode
Test with curl. The load balancer’s DNS name doesn’t match the domain name on your ACM server certificate, so the commands use the -k flag to skip server certificate verification. The flag doesn’t affect client authentication. A request with client1, which your CA signed, reaches the backend:
curl -k --cert client1.pem --key client1.key https://<nlb-dns-name>/

Hello from mTLS_NLB backend
A request with no client certificate is rejected:
curl -k https://<nlb-dns-name>/

curl: (55) Send failure: Connection reset by peer
A request with bad-client, which isn’t signed by a CA in your trust store, is also rejected:
curl -k --cert bad-client.pem --key bad-client.key https://<nlb-dns-name>/

curl: (56) Connection reset by peer
What to look for: A rejected client gets a connection reset and no HTTP response. With TLS 1.3, the client finishes its side of the handshake before NLB rejects the certificate, so the rejection appears as a reset on the first request rather than as a handshake error. The exact curl error code and message depend on your curl and OpenSSL versions.
Step 5: Configure client certificate filtering
In this step, you edit the listener to add client certificate filtering, so NLB admits only specific trusted clients. Under Client certificate identity filters, add one filter for each identity you want to allow (Figure 9). This example uses two filters:
| Action | Field | Match type | Value |
| Accept | Subject Organizational Unit (Subject.OU) | Exact | Production |
| Accept | URI Subject Alternative Name (SAN.URI) | Prefix | spiffe://example.com/ns/prod/ |
Figure 9: Client certificate identity filters
Filters are combined with OR, and Accept is the only action, so a trusted certificate that matches no filter is rejected.
To test the filters, issue two more client certificates from your CA, both with the clientAuth extended key usage, then compare your results with the table that follows the commands. NLB matches the SAN URI as a string and doesn’t check which system issued the certificate, so any certificate signed by a CA in your trust store with the right URI works. In production, these IDs typically come from a SPIFFE implementation such as SPIRE. For this test, OpenSSL is enough.
# client2: OU=Production with a prod SPIFFE ID (matches both filters)
openssl req -new -nodes -newkey rsa:2048 \
  -keyout client2.key -out client2.csr \
  -subj "/OU=Production/CN=client2.example.com"
printf "%s\n" "extendedKeyUsage=clientAuth" \
  "subjectAltName=URI:spiffe://example.com/ns/prod/sa/orders" > client2.ext
openssl x509 -req -days 365 -in client2.csr \
  -CA ca.pem -CAkey ca.key -CAcreateserial \
  -extfile client2.ext -out client2.pem

# client3: OU=Engineering with a prod SPIFFE ID (matches only the SAN URI filter)
openssl req -new -nodes -newkey rsa:2048 \
  -keyout client3.key -out client3.csr \
  -subj "/OU=Engineering/CN=client3.example.com"
printf "%s\n" "extendedKeyUsage=clientAuth" \
  "subjectAltName=URI:spiffe://example.com/ns/prod/sa/payments" > client3.ext
openssl x509 -req -days 365 -in client3.csr \
  -CA ca.pem -CAkey ca.key -CAcreateserial \
  -extfile client3.ext -out client3.pem
With the filters in place, send a request with each certificate:
curl -k --cert client1.pem --key client1.key https://<nlb-dns-name>/
curl -k --cert client2.pem --key client2.key https://<nlb-dns-name>/
curl -k --cert client3.pem --key client3.key https://<nlb-dns-name>/| Client certificate | Result |
| client1 (OU=Engineering), before filters | Accepted |
| No certificate, or bad-client (untrusted CA) | Rejected |
| client1 (OU=Engineering, no SAN URI), with filters | Rejected: matches no filter |
| client2 (OU=Production and a prod SAN URI) | Accepted: matches both filters |
| client3 (OU=Engineering and a prod SAN URI) | Accepted: matches the SAN URI filter (OR logic) |
Figure 10 shows how NLB evaluates a client certificate in this example and where each test certificate is accepted or rejected.
Figure 10: How NLB evaluates a client certificate against trust, revocation, and filters
Design considerations
Plan for the following when you design your trust stores:
- Your existing CA or AWS Private CA: If you already have a PKI solution or vendor, upload your root CAs to the trust store. AWS Private Certificate Authority works the same way: In both cases, you upload the CA certificates as a PEM file.
- Size limits: Trust stores, certificate chains, client certificate filters, and revocation lists have size limits. See Quotas for your Network Load Balancers.
- Trust store sharing: You can manage client trust from one central account and share trust stores with other accounts, or across your organization in AWS Organizations, through AWS Resource Access Manager (AWS RAM).
- Certificate purpose: If a client certificate includes an Extended Key Usage (EKU) extension, it must contain clientAuth. If it includes a Key Usage (KU) extension, that extension must assert digitalSignature or keyAgreement. These checks apply whether or not you configure client certificate filtering, and a certificate that omits an extension passes that check.
- TLS policies and tooling: Mutual authentication works with all generally available TLS security policies, and you can configure it with AWS CloudFormation and the AWS Load Balancer Controller.
- Health checks: They work as before. NLB does not use client certificate information for health checks, so turning on mutual authentication requires no extra setup.
- Monitoring: NLB publishes Amazon CloudWatch metrics for mutual authentication, including handshake counts, error counts, handshake latency, and client certificate expiration. Use them with access logs to spot rising rejection rates or certificates that are close to expiring.
- Troubleshooting: NLB access logs record whether each client passed or failed mutual authentication and why. To turn them on, see Enable access logs.
Revoke client certificates
To revoke access for a client certificate before it expires, upload a CRL to Amazon S3, then add it on the trust store’s details page in the Amazon EC2 console. NLB imports the CRL when you add it and doesn’t read it from Amazon S3 on each connection. When your list changes, add the updated CRL to the trust store again.
Clean up
To avoid ongoing charges, delete the resources you created in this walkthrough:
- In the Amazon EC2 console, under Load Balancing, choose Load Balancers. Select your Network Load Balancer and choose Actions, Delete load balancer. This also deletes its listeners.
- Under Load Balancing, choose Trust Stores. Select your trust store and choose Actions, Delete.
- Under Load Balancing, choose Target Groups. Select your target group and choose Actions, Delete. Then terminate the backend instances and delete the security groups if you created them for this walkthrough.
- In the Amazon S3 console, delete
ca-bundle.pemand any CRL file from your bucket. Delete the bucket if you created it for this walkthrough. - On your computer, delete the test certificates and private keys you created with OpenSSL.
Conclusion
With mTLS on NLB, only clients you trust reach your TCP and TLS applications, and you no longer run proxies or update X.509 libraries to get there. Your PKI team keeps one source of trust, and you can revoke a client without replacing its CA. Each listener admits only the identities it should serve, with no changes to your backend code.
mTLS for NLB is available in all AWS Regions where NLB is available. You can configure mutual authentication through the AWS Management Console, AWS CLI, AWS SDKs, or AWS CloudFormation, and troubleshoot it with access logs. For setup details and limits, see Mutual authentication in the User Guide for NLB.

The 2026 Flaky-Test Tooling Landscape: An Honest Comparison
An IEEE study confirms that up to 16.3% of failed CI pipelines contain missed flaky failures, rendering simple rerun-based detection unreliable.
Deep dive
- Research: 2026 IEEE study on 8.8 billion executions indicates rerun-based detection misses nearly 1/6th of actual flaky failures.
- The Quarantine Problem: 'Quarantine' inconsistently means either 'run and report failures without blocking' or 'skip execution entirely', with the latter hiding potential recovery.
- Harness Approach: Uses a 14-day same-commit window for detection and requires 5 consecutive passes for automatic reinstatement.
- Buildkite: Prefers a 'mute' vs 'skip' model to manage CI budgets vs reliability.
- CircleCI: Recently GA'd automatic reruns and test atom pricing.
- Evaluation Criteria: Focus on identifying how a tool defines 'flakiness', what it does during quarantine, how it handles ownership, and its true total cost of ownership.
Decoder
- Flaky Test: A test that produces inconsistent results (passing or failing) for the same code state, typically due to environmental non-determinism.
- Test Shard: A logical subset of a test suite executed in parallel to reduce total pipeline duration.
- Quarantine: A policy that flags unstable tests to prevent them from blocking deployment while maintaining observation.
Original article
The 2026 Flaky-Test Tooling Landscape: What Independent Reviews Actually Say
Seven flaky-test tools compared in 2026, grounded in independent research. What Harness, Buildkite, CircleCI, Trunk and others really do.
TL;DR
- Test time is not pipeline time. Measure where the time actually goes before changing the test runner or the retry policy.
- A green rerun is not a fix. Quarantine is the honest middle path when the test keeps running and the signal survives.
- Fix state and ingestion first. Only after tests are deterministic do parallel shards, selective execution, and the Harness agent's test-health policies pay off.
A test fails in CI. You rerun the pipeline without touching a single line of code, and this time everything passes. The commit ships. Nobody files a ticket.
Three weeks later, the same test fails on a different branch. Then on main. By the time anyone looks, it has been flaking quietly for a month, and nobody can agree whether it ever caught a real regression or just burned CI minutes.
This is what makes flaky tests expensive. The direct cost of rerunning them is real, but the compounding cost is reader trust. Once a team stops believing a red pipeline, they stop blocking merges on it, and the whole point of CI collapses from the inside.
By 2026, the market has responded. CI platforms ship same-commit flaky detection and quarantine policies. Dedicated reliability vendors sell detection and recovery workflows as a layer on top of your existing CI. Test-observability platforms wire the whole lifecycle into their broader instrumentation. Every vendor page promises better reliability. The useful question is harder: what does independent evidence actually say about any of this?
Independent research says reruns are not enough
The dominant detection approach in the literature and in most vendor products is still dynamic rerun-based: run a test enough times and inconsistent outcomes expose flakiness. Recent independent studies suggest that is a shakier foundation than product pages imply.
A 2026 study in IEEE Transactions on Software Engineering analyzed 8.8 billion test executions across four industrial projects and found that 9.8% to 16.3% of failed pipeline runs involved flaky failures that existing detection mechanisms missed. Failure rates also varied by as much as three times between environments, meaning the test environment itself is a variable the detection logic is usually blind to.
A 2026 evaluation of Shaker for Python projects pushed on this further. Across 137 paired tests, Shaker's stress-based detection caught 37.2% of known flaky cases, ordinary reruns caught 35.8%, and the difference was not statistically significant.
Detection methodology matters less than knowing what your tool misses. The real differences across vendors are not whether they detect flaky tests; they are what happens next: how a flaky test is quarantined, what evidence survives quarantine, how a team learns the test has been fixed, and what adoption actually costs.
The seven tools in play
The 2026 landscape sorts into three groups. CI-native capabilities inside the platform you already use (Harness CI, Buildkite Test Engine, CircleCI). A dedicated reliability layer on top of any CI (Trunk, BuildPulse, Mergify). A test-observability model inside a broader platform (Datadog).
| Tool | Detection | What quarantine does | Primary focus |
|---|---|---|---|
| Harness CI | Same-commit inconsistency | Test keeps running, failures excluded from pipeline status | CI-native reliability |
| Buildkite Test Engine | Historical monitors | Muted (runs, failures ignored) or Skipped (does not run) | Configurable test state |
| CircleCI | Same-commit plus auto reruns | Failed-test retry, test-atom metered | CI-integrated optimisation |
| Trunk Flaky Tests | Flakiness monitors | Keeps running without blocking the job | Dedicated reliability layer |
| BuildPulse | Git-based plus statistical | Quarantine list exposed via API, CI skips | Impact and prioritization |
| Mergify Test Engine | Default-branch plus PR reruns | Quarantine with continued reporting | Prevention before merge |
| Datadog Test Optimization | Historical plus Early Flake Detection | Active, Quarantined, Disabled, Fixed lifecycle | Reliability inside observability |
The Harness agent: flaky management inside the pipeline
The Harness agent treats flaky-test management as part of normal CI, not a separate product. That matters because every other tool on this list is either an add-on with its own ingestion contract or a workflow that only lights up above a plan tier. The Harness agent ships detection, test-health visibility, and quarantine inside the stage the test already runs in.
Per the Flaky Test Detection docs, a test is flaky when it has both passed and failed on the same commit inside a 14-day observation window. It clears after five consecutive successful executions or when no inconsistency has occurred for 14 days. The 14-day window is the same window CircleCI uses, which is useful because detection semantics are at least consistent across the CI-native options.
Test Management layers test-health visibility and quarantine on top. A quarantined test keeps running, its results still land in the dashboard, and its failures can be configured to stop breaking the pipeline.
Buildkite Test Engine: Muted vs Skipped is the whole decision
Buildkite builds flaky management around test state. The test-state docs define two behaviors. Muted tests keep running, their failures do not block the build, and data keeps flowing. Skipped tests do not run at all, which means the system cannot tell you whether they have recovered. Buildkite's own guidance is to prefer muting over skipping unless a test must not run. Skipping is a budget decision, not a reliability one.
CircleCI: automatic reruns went GA this October
CircleCI's Test Insights docs use the same same-commit, 14-day definition of flakiness Harness does. The 2026 change is Smarter Testing. On 13 October 2026 CircleCI announced general availability of a bundle including automatic reruns, intelligent test selection, dynamic splitting, and analytics.
Automatic reruns answer one question: is this failure reproducible? They are not a quarantine lifecycle. A test that passes on rerun is marked a potential flake, and the build continues. There is no notion of ownership, no automated reinstatement after N clean runs.
Trunk Flaky Tests: separating flaky from broken
Trunk builds flaky-test reliability as a product in its own right. Through Trunk's quarantine, known flaky tests keep running and reporting without blocking the job. The important design choice is one Trunk is explicit about: automated quarantine applies to tests already identified as flaky, not to tests that are consistently broken, because quarantining them hides a real regression.
BuildPulse: measuring the cost of flakiness
BuildPulse puts the operational cost of flaky tests front and centre. Its Flaky Tests Dashboard documents Git-based detection, which compares inconsistent outcomes against equivalent Git tree states, and statistical detection against thresholds. Beyond detection, BuildPulse surfaces metrics most CI platforms do not: disruption frequency per test, failed builds attributable to specific flakes, and engineering time lost.
Mergify Test Engine: catch flakes before they merge
Mergify splits the problem into Prevention, Detection, and Quarantine. Detection looks at test results on the default branch to find existing unreliable tests. Prevention operates on pull requests: with the right framework integration and a configured rerun budget, it reruns new or modified tests on the PR to expose inconsistent behaviour before merge.
Datadog Test Optimization: observability for tests
Datadog's Flaky Tests Management docs model a test's state as Active, Quarantined, Disabled, or Fixed, and track transitions. A quarantined test keeps its history, so when the team eventually investigates, the full timeline is there. Early Flake Detection proactively reruns previously unseen tests, similar in spirit to Mergify Prevention, wired into the same instrumentation that already watches your services.
The four questions that beat a feature matrix
How does the tool identify a flaky test? Same-commit inconsistency, PR reruns, and statistical detection against thresholds are three different signals. Each catches a different subset of flakes and misses a different subset.
What exactly does quarantine do? Quarantine is one word doing two very different jobs. In one version, the test keeps running, its failures stop blocking merges, and the signal survives. In the other, the test does not run at all, which saves time but destroys the only mechanism that would tell you it recovered. The second model is cheaper and more dangerous.
How does the team learn a test is fixed? Detection is where every vendor markets. Recovery is where most of them go quiet. Who owns the quarantined test, how is ownership tracked, what gets reinstated automatically, what demands manual review.
What does adoption actually require? A vendor supporting JUnit reports does not necessarily support quarantine on JUnit reports. Advanced detection often needs a native agent, a minimum library version, or an account feature flag.
Which approach fits which team
There is no independently established universal winner across these seven products.
Teams that want detection, test-health visibility, and quarantine inside the CI stage, without maintaining a second ingestion contract on top, get the most compact answer from the Harness agent.
Teams on another CI who do not want to move it, but do want governance on top, split between Trunk (quarantine with a clear flaky/broken distinction), BuildPulse (impact measurement and API-driven skipping) and Mergify (prevention before merge).
Teams already deep in Datadog for application observability get the test lifecycle in the same instrumentation, with native-agent coverage as the trade-off to verify.
A trustworthy pipeline is more than a green pipeline
Flaky-test management in 2026 has moved past "run it twice." Tools now stitch together detection, proactive reruns, quarantine, test-health dashboards, ownership, and recovery. The research is clear on one thing: flakiness is hard to detect completely, and every detection technique has conditions under which it falls over. The useful tools are the ones that do more than hide failed builds. They help developers understand what went wrong, keep an audit trail on unreliable tests, and give the team a defensible way to restore confidence once a test is actually fixed.
The objective is not to make every pipeline green. It is to make a green pipeline mean something.
OpenVINO (GitHub Repo)
OpenVINO is an open-source Intel-backed toolkit for running AI inference efficiently across CPUs, GPUs, and NPUs without needing original frameworks.
Deep dive
- Cross-Platform: Supports Intel CPUs, GPUs, and NPUs.
- Framework Support: Direct integration with Hugging Face Optimum Intel, ONNX Runtime, and standard model formats.
- Optimization: Includes advanced techniques like quantization and pruning via NNCF.
- GenAI Focus: Recent updates include specialized GenAI APIs for LLM pipelines, including tokenizers and chatbot examples.
- Deployment: Scales from lightweight edge devices to large server deployments using OpenVINO Model Server (OVMS).
Decoder
- Inference: The process of running a trained model to make predictions or generate outputs.
- Quantization: The process of reducing the precision of the numbers used in a model's weights, significantly speeding up execution while maintaining accuracy.
- NPU (Neural Processing Unit): A specialized hardware accelerator designed specifically for neural network operations.
Original article
Open-source software toolkit for optimizing and deploying deep learning models.
- Inference Optimization: Boost deep learning performance in computer vision, automatic speech recognition, generative AI, natural language processing with large and small language models, and many other common tasks.
- Flexible Model Support: Use models trained with popular frameworks such as PyTorch, TensorFlow, ONNX, Keras, PaddlePaddle, and JAX/Flax. Directly integrate models built with transformers and diffusers from the Hugging Face Hub using Optimum Intel. Convert and deploy models without original frameworks.
- Broad Platform Compatibility: Reduce resource demands and efficiently deploy on a range of platforms from edge to cloud. OpenVINO™ supports inference on CPU (x86, ARM), GPU (Intel integrated & discrete GPU) and AI accelerators (Intel NPU).
- Community and Ecosystem: Join an active community contributing to the enhancement of deep learning performance across various domains.
Check out the OpenVINO Cheat Sheet and Key Features for a quick reference.
Installation
Get your preferred distribution of OpenVINO or use this command for quick installation:
pip install -U openvinoVerify Installation
After installation, you can verify OpenVINO is installed correctly by running:
import openvino as ov
print(ov.__version__)
Check system requirements and supported devices for detailed information.
Tutorials and Examples
OpenVINO Quickstart example will walk you through the basics of deploying your first model.
Learn how to optimize and deploy popular models with the OpenVINO Notebooks:
- Create an LLM-powered Chatbot using OpenVINO
- YOLOv11 Optimization
- Text-to-Image Generation
- Multimodal assistant with LLaVa and OpenVINO
- Automatic speech recognition using Whisper and OpenVINO
PyTorch Model
import openvino as ov
import torch
import torchvision

# load PyTorch model into memory
model = torch.hub.load("pytorch/vision", "shufflenet_v2_x1_0", weights="DEFAULT")

# convert the model into OpenVINO model
example = torch.randn(1, 3, 224, 224)
ov_model = ov.convert_model(model, example_input=(example,))

# compile the model for CPU device
core = ov.Core()
compiled_model = core.compile_model(ov_model, 'CPU')

# infer the model on random data
output = compiled_model({0: example.numpy()})
TensorFlow Model
import numpy as np
import openvino as ov
import tensorflow as tf

# load TensorFlow model into memory
model = tf.keras.applications.MobileNetV2(weights='imagenet')

# convert the model into OpenVINO model
ov_model = ov.convert_model(model)

# compile the model for CPU device
core = ov.Core()
compiled_model = core.compile_model(ov_model, 'CPU')

# infer the model on random data
data = np.random.rand(1, 224, 224, 3)
output = compiled_model({0: data})
Generative AI with OpenVINO
Get started with the OpenVINO GenAI installation and refer to the detailed guide to explore the capabilities of Generative AI using OpenVINO.
Documentation
User documentation contains detailed information about OpenVINO and guides you from installation through optimizing and deploying models for your AI applications.
OpenVINO Ecosystem
OpenVINO Tools
- Neural Network Compression Framework (NNCF) - advanced model optimization techniques including quantization, and sparsity.
- GenAI Repository and OpenVINO Tokenizers - resources and tools for developing and optimizing Generative AI applications.
- OpenVINO™ Model Server (OVMS) - a scalable, high-performance solution for serving models optimized for Intel architectures.
- Intel® Geti™ - an interactive video and image annotation tool for computer vision use cases.
Integrations
- 🤗Optimum Intel - grab and use models leveraging OpenVINO within the Hugging Face API.
- Torch.compile - use OpenVINO for Python-native applications by JIT-compiling code into optimized kernels.
- ExecuTorch - use ExecuTorch with OpenVINO to optimize and run AI models efficiently.
- OpenVINO LLMs inference and serving with vLLM - enhance vLLM's fast and easy model serving with the OpenVINO backend.
- OpenVINO Execution Provider for ONNX Runtime - use OpenVINO as a backend with your existing ONNX Runtime code.
- LLMWare - seamlessly build enterprise AI apps, agentic workflows, RAG pipelines, multimodal use cases, and more.
- LlamaIndex - build context-augmented GenAI applications with the LlamaIndex framework and enhance runtime performance with OpenVINO.
- LangChain - integrate OpenVINO with the LangChain framework to enhance runtime performance for GenAI applications.
- Keras 3 - Keras 3 is a multi-backend deep learning framework. Users can switch model inference to the OpenVINO backend using the Keras API.
Performance
Explore OpenVINO Performance Benchmarks to discover the optimal hardware configurations and plan your AI deployment based on verified data.
Contribution and Support
You can ask questions and get support on:
- GitHub Issues.
- OpenVINO channels on the Intel DevHub Discord server.
- The openvino tag on Stack Overflow.
Telemetry
OpenVINO™ collects software performance and usage data for the purpose of improving OpenVINO™ tools. This data is collected directly by OpenVINO™ or through the use of Google Analytics 4. You can opt-out at any time by running the command:
opt_in_out --opt_outLicense
OpenVINO™ Toolkit is licensed under Apache License Version 2.0.
OpenSRE (GitHub Repo)
OpenSRE is a self-hosted agent that automatically investigates failed CI/CD pipelines, separates infrastructure issues from code bugs, and pushes fixes for review.
Deep dive
- Architecture: Self-hosted agent; supports private deployment to ensure data privacy.
- Capability: Automatically correlates failed CI logs with observability data (Grafana, Datadog, Sentry).
- ** Remediation**: Suggests and pushes code fixes directly to the failing PR branch.
- Differentiation: Explicitly distinguishes between infrastructure/CI flakiness and actual logic regressions.
- Interface: CLI (REPL), Headless (for CI jobs), and embedded Python API (for automation integration).
- Security: Designed for auditable prompts and structured log handling.
Decoder
- REPL (Read-Eval-Print Loop): An interactive shell that processes input, evaluates it, and prints the result, common for CLI tools.
- Tool-calling loop: An AI agent behavior where it can invoke predefined external functions/tools to gather information or perform actions.
- CI/CD Reliability: The practice of maintaining a high success rate and predictable behavior in automated delivery pipelines.
Original article
OpenSRE: The open-source agent for CI/CD reliability
Your CI tells you it broke, but not why or how to fix it. OpenSRE is a CLI agent that reads the failed run, traces the cause and pushes a fix for you to review. Self-hosted, with your own models.
🚧 Public Alpha: Core workflows are usable for early exploration, though not yet fully stable. The project is in active development, and APIs and integrations may evolve.
Before you begin
Make sure you have:
- A terminal open in a code project
- A Git repository (recommended for the full workflow demonstration)
Step 1: Install and start opensre
macOS or Linux:
curl -fsSL https://install.opensre.com | bash -s -- -ghWindows (PowerShell):
& ([scriptblock]::Create((irm https://install.opensre.com/install.ps1))) -ghThen start OpenSRE:
opensreThe installer fetches the latest build from main without requiring sudo. If opensre is not found, follow the PATH instructions printed by the installer or open a new terminal.
Why OpenSRE?
AI writes more of the code every month. Someone still has to fix the build.
When CI goes red, it tells you that something failed, not why or how to fix it. Under deadline pressure, teams hit re-run and move on, flaky checks pile up, main stays red, and the real investigation waits for whichever senior engineer has time. OpenSRE is an open-source CI/CD reliability agent that does that investigation for you, built to run on your own infrastructure with your own models:
- Recover from red builds faster: it investigates the moment a run fails, reading logs, testing hypotheses and pushing a fix for you to review
- Fix the cause, not just the rerun: it separates CI-caused failures from code-caused ones, so you fix the right thing
- Know what CI is costing you: failure rate, developer hours lost to unreliable CI, and how long
mainstays red - Senior-level context for everyone: every engineer gets the same depth of analysis
Quick Start
Run opensre to sign in and get started. The first launch activates the hosted model.
opensreWebapp contributors can run opensre setup --dev to authenticate through http://localhost:3000.
Interactive shell — with no subcommand, opensre validates your account and starts a REPL (TTY required). You can exit and stay signed out, but the shell only opens for an active account. Describe incidents in plain language, watch the agent work, and use slash commands for session control (/help, /status, /cost, /sessions, /resume, /compact, /new, /exit) and integrations (/integrations list, /integrations verify). Ctrl+C cancels an in-flight turn without losing session state.
Headless CLI — run one agent turn non-interactively from a terminal, script, or CI job:
opensre ask "why is checkout-api slow?"From Python — drive the agent in-process from your own code:
from surfaces.embedded import start_embedded_session

session = start_embedded_session()
result = session.chat("why is checkout-api slow?")
if result.action_result.accounting_status == "completed" and not result.cancelled:
    print(result.primary_response_text)
Deployment
An OpenSRE Cloud managed gateway, an AWS EC2 path, and a general self-hosted option:
- OpenSRE Cloud managed gateway: an organization admin provisions it in the web app; signed-in shell users can check, start, or stop it without handling infrastructure credentials locally.
- Gateway (AMI + systemd):
make build-gateway-imagethenmake deploy-gateway— Telegram gateway only, no Docker; the gateway is installed into a server image that new servers start from. - Self-hosted container (Railway / ECS / Vercel): deploy the repo
Dockerfile, selectMODE, and setLLM_PROVIDERplus its API key.
How OpenSRE Works
When a CI run fails, an alert arrives, or you ask a question, OpenSRE automatically:
- Fetches the relevant context: failing checks and CI logs, recent commits and deploys, and correlated logs, metrics and traces
- Masks sensitive identifiers (optional) before external LLM calls
- Reasons across your connected systems to test hypotheses in a tool-calling loop, separating CI-caused failures from code-caused ones
- Answers with an evidence-linked response in the conversation
- Fixes the cause and pushes it to the PR branch for you to review, or suggests next steps and, optionally, executes remediation actions
- Posts a summary directly to Slack, PagerDuty, or Telegram — no context switching needed
Integrations
OpenSRE connects to 60+ tools and services across the modern cloud stack, from LLM providers and observability platforms to infrastructure, databases, and incident management.
Security
OpenSRE is designed with production environments in mind: structured and auditable LLM prompts, local transcript handling by default, and no silent bulk export of raw logs.
Telemetry
First-party product analytics and Sentry (errors) are opt-out. Quick disable:
export OPENSRE_NO_TELEMETRY=1License
Apache 2.0
Traffic mix matters
Microsoft's M365 outage highlights how subtle traffic patterns and key contention in testing labs can lead to massive discrepancies in production performance.
Decoder
- SKU: Stock Keeping Unit; in cloud contexts, it refers to specific instance types or configurations with distinct hardware/resource profiles.
- Key skew: A condition in databases where a small subset of keys (data) receives a disproportionately high volume of access requests, causing contention.
- Zipf distribution: A statistical distribution often used to model data access patterns where a few items are extremely popular while most are accessed rarely.
Original article
Traffic mix matters
Wanna listen to my mixtape?
The preliminary report on last week’s M365 outage contains one statement that really caught my eye:
Our normal load testing did not detect the latent issue because [of] the traffic mix and SKUs used in our labs.
There’s a lot going on in this report (as there is in any report for a complex system), but I wanted to zoom in on this one issue: traffic mix. It’s important, because its the one thing that makes the difference between a great load test and a complete waste of time.
The performance of computer systems is extremely sensitive to workload mix.
Let’s start with a simple simulator, looking at a system with a table of locks. Requests arrive with a key, hold the lock for their key for some period of time, and then free the lock and complete. This isn’t an unreasonable mental model of a relational database, where each transaction takes a lock during its execution.
Each request takes one of 16 worker threads, waits in a FIFO queue for the lock on its key, holds the lock for an exponentially distributed time (mean 1 ms), then releases it and frees its thread. Keys are drawn from a Zipf distribution over N keys; a coefficient of 0 is uniform.
As we may expect, the more skewed the distribution, the less throughput you get out of the system. A small number of keys are highly contended, leading to under utilization of the rest of the resources of the machine, driven by the global concurrency limit.
Now, let’s consider a different mental model of a relational database (at least a single-system one like Postgres). A fast, local, in-memory cache containing some of the accessed data backed by a slower store containing the rest of the data.
Each request takes one of the same 16 worker threads and reads its key. A hit is served from an LRU cache; a miss goes to storage (exponentially distributed, mean 1 ms) and the key is added to the cache. Keys are drawn from a Zipf distribution over N keys; a coefficient of 0 is uniform. Note the log scale on the throughput axis.
This curve goes the other way! The more skewed the distribution, the better the performance, over something of a broad range. This is what makes it so important that workload mix in load tests and benchmarks matches real production traffic: throughput can vary by multiple orders of magnitude, in both directions, depending on things as subtle as key skew in the benchmark workload. This is especially true in relational database-shaped things, but applies to systems of all kinds.
Aside: This is also a reason I like optimistic concurrency control, and architectures with a single cost/latency mode. Aurora DSQL reflects this thinking on how to make things less workload sensitive: all reads go to a single fast storage layer, and nobody is holding resources waiting on locks.
Wait for pull request events with GitHub CLI
The new GitHub CLI 'gh event' commands allow developers and agents to stream pull request updates in real-time, eliminating the need for polling.
Decoder
- Polling: A technique where a client repeatedly requests status updates from a server at fixed intervals, which is inefficient compared to event-based push updates.
Original article
GitHub CLI now supports GitHub Event Streams. With gh v2.105.0, you and your agents can wait for a pull request to change with a single command instead of polling it in a loop.
Run gh event listen with a pull request URL and the events you care about, such as a submitted review. It creates the subscription, opens the stream and prints each event as a line of JSON.
- By default, it exits after the first event, so it slots into scripts and agent loops.
- Use
--countto wait for several events,--followto keep listening, and--timeoutto stop waiting. - Use
--jqor--templateto pull out just the fields you need.
You can wait for submitted reviews, pull request state and head changes, merge conflicts and completed check suites. To manage subscriptions directly, use gh event subscription create, list, view, and delete.
Agents discover the new commands on their own: gh pr create, gh pr view, gh run view, gh run watch, and gh api now suggest gh event listen instead of polling.
Availability
The gh event commands are in preview and may change. They require access to Event Streams, which is in preview on GitHub.com. To get access, sign up for the Event Streams waitlist.
To get started, upgrade to gh v2.105.0 or later. For details, see the gh event manual and the Event Streams documentation, or run gh event --help.
Share your feedback in the GitHub Community discussion.
Docker Rebrand 2026: New Logo, Colors, and Strategy Explained
Docker is rebranding to 'Run on Trust,' shifting its focus from simple containerization toward securing autonomous AI agents in execution environments.
Deep dive
- Strategic Pivot: Transitioning from just 'Build, Ship, Run' to 'Run on Trust' with a focus on containment for AI.
- Visual Overhaul: New 'Docker Base' color (#6172FF), GT Planar typography, and a simplified whale logo.
- New Product Direction: Development of Docker Sandboxes (SBX) specifically for isolating and controlling AI agent execution.
- Security Focus: Emphasis on supply-chain security and hardened images for autonomous workflows.
Decoder
- Autonomous AI agent: A program capable of completing complex tasks by planning, using tools, and making decisions without human intervention.
- Trusted runtime: An execution environment designed to prevent malicious or unauthorized code from accessing host system resources.
Original article
New Docker. New whale. New mission. 🐳
On November 19, 2026, Docker introduced its new brand identity, including a redesigned logo, a new color palette, and a bigger strategic ambition.
The message? Run on Trust.
As a Docker Captain and container security author, I have a few thoughts. And some book announcements of my own!
1. Docker's Angle: From Containers to Containment
Docker became famous for making applications portable and reproducible. Now, with autonomous AI agents entering development workflows, Docker is positioning itself as the trusted execution layer for both applications and agents.
We need to containerize the application and contain the agent.
What changed?
| Old Docker | New Docker (2026) | |
|---|---|---|
| Logo | Whale carrying containers | Simplified whale and containment symbol |
| Signature color | Docker Blue #2496ED |
Base Blue #6172FF |
| Core message | Build, Ship, Run | Run on Trust |
| Main focus | Containerization | Trusted execution and containment |
| Workloads | Applications and services | Applications and autonomous AI agents |
| Audience | Primarily developers | Developers, enterprises, and AI builders |
| Security story | Container and supply-chain security | Trusted runtime, supply chain, and ecosystem |
Docker isn't abandoning containers. It's extending the principles that made containers successful into the AI era. Its commitment to containers, open source, and developers continues.
The new Docker colors
The familiar bright blue gets a more violet-toned replacement, supported by neutral backgrounds and vivid accents.
Primary palette
| Color | Hex |
|---|---|
| Base | #6172FF |
| Canvas | #F5F2EE |
| Zero | #FFFDFA |
| Ether | #101010 |
| Ink | #1D1D1D |
Secondary palette
| Color | Hex |
|---|---|
| Launch | #FF6A3D |
| Sand | #FFCEA5 |
| Neutral | #DDD4C9 |
| Air | #D1E4FF |
| Bloom | #F3E5F6 |
| Flux | #00E476 |
| Trigger | #FF3D40 |
| Console | #3345D6 |
| Root | #5C0909 |
Typography changes too, with GT Planar as the primary typeface and GT Standard Mono for technical accents.
New words, new priorities
Docker's new messaging centers on three pillars:
- Trusted Runtime: Isolate and run autonomous agents safely.
- Trusted Supply Chain: Protect the software and dependencies those agents use.
- Trusted Ecosystem: Bring tools, models, and security controls together.
Two phrases capture the direction particularly well:
Trust Docker for the agents you don't.
Contain your agents, not your ambition.
This is an interesting shift. Containers made software portable. Docker Sandboxes aim to make autonomous execution controllable, with Docker AI Governance alongside them to help teams govern agent activity.
And the whale? He's still here.
Back in October 2013, Docker's community named its whale Moby Dock, a playful reference to Herman Melville's 1851 novel Moby-Dick. Captain Ahab spent that story hunting a whale.
Thirteen years later, Docker's whale has evolved again. Sorry, Captain Ahab. But don't worry: Captain Ahab is still around, too. He's a character in my comic book Black Forest Commandos: Asgard Mission.
2. My Angle: New Docker, New Books
As a Docker Captain, I've spent years helping developers secure their containers, supply chains, and Kubernetes environments.
Docker's new direction fits what I've been working on throughout 2026: Security for both containers and autonomous agents.
And I have three books to talk about.
| Book | Status | What's changing? |
|---|---|---|
| Black Forest Shadow 2.0 | Released November 13, 2026 | 194 full-color pages, three new DLCs, updated security lessons |
| Docker Sandboxes (SBX) | In development | A standalone, hands-on guide to isolating AI agents |
| Docker and Kubernetes Security 2.0 | Planned for early 2027 | A substantive second edition with refreshed branding and security content |
Black Forest Shadow 2.0: The Shadow Returns 🌲
On Friday the 13th of November, I released the second edition of Black Forest Shadow, my dark fantasy guide to Docker and Kubernetes security.
The new edition expands from 143 to 194 pages, adds three bonus stories, upgrades the illustrations to full color, and updates the technical lessons with Docker Sandboxes, SIP (Security Immediate Plan), and recent supply-chain attacks.
Even in the Black Forest of 1865, security threats keep evolving.
Docker Sandboxes: Contain, Don't Just Containerize 📦
My next book focuses entirely on Docker Sandboxes (sbx).
I'll cover agent isolation, sandbox architecture, networking, credentials, Kits, reproducible development environments, and the trade-offs between containers and sandboxes.
The fun part? I'm using Docker Sandboxes as the development environment to build the book itself.
Docker and Kubernetes Security 2.0 🐳
Finally, I'm announcing the upcoming second edition of Docker and Kubernetes Security, planned for early 2027.
The first edition covered the security lifecycle from container images to Kubernetes runtime protection. The second edition will revisit that foundation in light of evolving supply-chain attacks, hardened images, attestations, and autonomous development workflows.
It will also feature a redesigned cover aligned with Docker's new identity.
Not merely a new logo on an old book. A proper second edition.
Docker is changing how it presents itself to the world, and I'm excited to see where its focus on trusted execution leads.
One thing hasn't changed: Secure software still needs boundaries, evidence, and practical controls.
Contain your agent, containerize your application, and drink good coffee while you do it (I recommend beans from Ethiopia):
Run on Trust.
Design by Playground
Designers are moving beyond static Figma mockups by using AI to generate 'disposable' playgrounds that test real code, interactions, and edge cases.
Decoder
- Design tokens: Small, reusable design attributes (like color codes or spacing values) that can be shared across design tools and codebases to ensure consistency.
Original article
For all the years there's been software designers, there's been a dominant software design tool: Photoshop, Sketch, Figma. Increasingly though, designers are making their own highly specific (and disposable) design tools using AI coding agents. Let's call it "design by playground."
So what's a playground? If you've been a front end developer, a playground isn't a new concept. Effectively, you create a tool that allows you to manipulate variables and see their outcomes on an interface in real time. You can use a playground to see a bunch of variants at once (long text, short text, no text), play with options (big text, bold text, red text), and actually interact with designs.
The advantages over static mockups are obvious, no matter how good you are at Figma. A playground can pull in real content and data, so long names, missing images, and other edge cases get thought about upfront instead of being flagged by developers later. Animation timing, transitions, and loading, empty, and error states all become controls you can adjust and test.
But if that's the case, why hasn't everyone been designing by playground all these years? Put simply, building playgrounds took more time than it was worth. Fidgeting with mockups was faster and easier than building a tool from scratch that you'd probably never use again.
Of course, AI coding agents have changed that completely. A frontier model with a good harness can whip up playgrounds in minutes at minuscule cost. So there's no barrier to building a bespoke design tool whenever you need it. You can spin up a playground for a single design question or feature and toss it once you've got your answer.
And a highly specific tool often beats a generic one, especially when it runs in the same environment your software does: the Web, iOS, Windows, etc. That way you're looking at real font rendering, scrolling, touch and hover behavior, performance, and screen sizes, all things static mockups can only approximate. And the values you settle on in a playground can be exported directly as code or design tokens for engineers (or more likely, coding agents) to pick up.
Here's an example you can play with yourself... AI agents do a lot (reasoning, tool use, delegation, monitoring, etc.). How much of that work do you show people in your app's UI? I built a design playground to try out different designs, tweak details, and animate them to see what works best. Try it out.
Design tools used to be something you spent years learning. Now they can be something you make, use for an afternoon, and happily move on. They're called playgrounds for a reason.

shadcn/ui for Video (Website)
Remocn provides a registry of over 930 MIT-licensed Remotion components that AI agents can compose into production-ready product demo videos.
Decoder
- Remotion: A library that allows developers to create videos using React and web technologies like CSS and SVG, which are then rendered into video files.
Original article
You want the video, not the ordeal
Remocn is shadcn/ui for video. Describe your product to your AI agent, and it builds the demo video from ready-made pieces while you watch in the browser.
How it works: The whole setup is one session.
An agent, an empty folder and a single prompt. You describe, it builds, you watch it happen.
- Open an agent in an empty folder
- Paste one prompt
- A player opens in your browser
$ mkdir acme-launch && cd acme-launch && claudeSet up a new Remotion video project in this folder, then install the Remocn agent skill: npx skills add Remocn/remocn --yes. When you're done, start the preview studio.
Typography
Words that land with weight instead of just appearing.
Transitions
Cuts that don’t look like a slideshow.
Captions
Word-by-word subtitles timed to the voiceover.
Numbers
Counters, charts and prices where the figure is the hero.
Product scenes
Mocked app UI that shows what your product does.
Logo stings
Short brand reveals for the open and the close.
Backgrounds that move.
Fill any aspect ratio — they’re code, not footage.
$ npx shadcn@latest add @remocn/soft-blur-inSeven stages. You watch, it ships.
The agent follows motion rules, checks every frame and fixes what looks off. It runs on the Claude Code, Codex, Copilot or Grok plan you already pay for.
- Analysis: Reads your site and repo
- Brand: Pulls colors, type and logo
- Script: Writes the beats and copy
- Motion: Picks blocks for each beat
- Build: Writes the Remotion project
- Choreography: Times every entrance
- Review: Watches it back, fixes issues
Why Remocn: Every other way costs you something.
A motion designer: $600, 2 weeks. And three rounds of “can we make it pop more”.
Remocn + your agent: 1 prompt, 1 afternoon. The animation is already built and timed. You react to the result.
- No After Effects: Nothing to install, nothing to learn. If you can describe it, you can make it.
- Not a screen recording: A cursor wandering across your app isn’t a demo. This looks shipped on purpose.
- Yours to keep: The code copies into your repo. MIT, no runtime, no account, nothing to cancel.
- Changes in seconds: Say what feels wrong and watch it change. No revision round, no queue.
Your product deserves better than a screen recording.
An agent, an empty folder, ten minutes. Open source, all the way down.

The Multiplier Effect: How Authoring Tools Can Transform Web Accessibility
The W3C is updating its decade-old Authoring Tool Accessibility Guidelines to mandate better AI-assisted accessibility features in CMS and website builders.
Deep dive
- ATAG (Authoring Tool Accessibility Guidelines): A W3C standard defining how software used to build websites should support accessibility.
- WCAG (Web Content Accessibility Guidelines): The international standard for making web content accessible to people with disabilities.
- Shift in focus: Moving from individual developers fixing accessibility to platform-level defaults enforcing compliance.
- AI's role: AI-generated content is now a primary driver of web volume, making tool-level constraints essential for preventing mass accessibility failures.
Decoder
- Authoring tool: Any software or platform used to create web content, including CMS platforms like WordPress, no-code builders, and social media interfaces.
Original article
The multiplier effect: How authoring tools can transform web accessibility
If the tools we use to create content better supported accessibility, it would have a tremendous impact on making the web accessible to people with disabilities.
Billions of content creators
If you're reading this post, you're probably involved in developing web content — for your employer, for your hobby, as a volunteer, or through social media.
An estimated 6 billion people use the web. Most of them create web content, from posting on social media to developing complex websites and apps. Few have expertise in making their content accessible.
Many of my family and friends are responsible for websites and digital content in small organizations, for example:
- a pick-your-own fruit farm that provides regular updates during the growing season
- a rural public school district
- a non-profit organization with five staff
Some are in large organizations:
- a public university system with 20 campuses
- a multinational company with content authors in several countries
These family and friends want to make their digital content accessible to me and other people with disabilities. Unfortunately, the tools they use to create content do not adequately support accessibility.
Now imagine that tools made it easy for them to create accessible content.
Thousands of tools
Many people create web content via social media. They create a profile, post pictures, publish articles, and comment on others.
Many small businesses use no-code website builders to create their website.
Many large organizations use content management systems (CMS) and educational institutions use learning management systems (LMS).
These tools that people use to create web content are called "authoring tools". Here "authors" are anyone who creates content, including fruit farmers, teachers, corporate designers, and developers.
Improving accessibility support in the thousands of authoring tools would help the billions of content creators make the web more accessible.
Accessibility support examples
Tools can support authors in creating accessible content that meets the latest version of the Web Content Accessibility Guidelines (WCAG) standard. Some examples of how are introduced below.
First a little background: Providing alternative text (alt text) for images is a basic accessibility requirement to meet the needs of people with disabilities. People who are blind and cannot see the image can get the alt text from their screen reader or braille display.
Alt text: Tools can support content authors in providing alt text.
Recently my colleague Kevin was selling a desk online. When he uploaded a photo of the desk, the tool provided a draft text description of the desk that he could edit.
When an author adds an image, the tool can:
- Require alt text or confirmation that alt text is not needed.
- Provide short guidance on why and what to include as alt text, with detailed guidance available.
- Provide suggested alt text based on the context, if available with AI.
- Save the alt text along with the image. And when the image is used again, provide that alt text as a draft and ask the author to confirm if it is appropriate in the new context.
Accessible options: When authors have choices, such as text and background colors, the tool only suggests options that meet WCAG. If an author selects options that do not meet WCAG, the tool suggests ways to fix the accessibility failure.
Accessibility accountability: The tool makes it difficult to break accessibility. If an author introduces an accessibility failure, the tool explains the problem and the impact on disabled people, and requires the author to acknowledge it.
Accessible templates: The tool's provided templates, components, and widgets meet WCAG.
By supporting accessibility, authoring tools can help make vast amounts of content more accessible with less effort.
AI-generated urgency
Authoring tools are increasingly including AI for content creation. Some website builders use AI to generate an initial site from a creator's description.
74% of new web pages in April 2025 included AI-generated content; and the percentage of web pages with significant AI-authored content is increasing.
This use of AI presents both a massive opportunity and a serious risk for accessibility. Do it right, and all that new content can be more accessible than most of today's web. Get it wrong, and accessibility barriers that exclude disabled people multiply even faster.
Example of minimal AI for maximum accessibility
At a roundtable with disability organizations in Hong Kong in early 2025, a couple of blind people were talking about how much they use AI to figure out the content of images that are missing alt text. It struck me how much of a waste that was. All that AI use, and blind people don't even know if they are getting the information that the content author wanted the image to convey.
If instead, when an author uploads an image, the authoring tool suggested alt text — as Kevin's tool did for his desk — AI would have been used only once and blind people would have relevant alt text.
This is an example of how judicious use of AI in authoring tools can reduce the overall use of AI. Léonie Watson contends that accessibility is AI resistance.
When authoring tools better support creating accessible content, it reduces the need for disabled people to use AI as a workaround.
Authoring Tool Accessibility Guidelines (ATAG)
To help authoring tool developers know how to support accessibility, W3C developed Authoring Tool Accessibility Guidelines (ATAG). ATAG covers two aspects:
- The tool enables, supports, and promotes the production of accessible content that meets the WCAG standard.
- The tool itself is accessible. This enables the billions of people with disabilities to create content.
It's been 10 years since we published ATAG 2. ATAG now needs to be updated to align with developments in WCAG, to better apply in the current and future environments, to address emerging technologies, and to cover appropriate use of AI for accessibility.
W3C is bringing together stakeholders from around the world to update ATAG.
You can help
If your organization develops an authoring tool:
- prioritize providing accessibility support in your tool
- read the ATAG 2.0 materials and consider submitting your tool to the Authoring Tools List with information on its accessibility support
- participate in the W3C ATAG Community Group now, and in the proposed ATAG Working Group as a W3C Member
Anyone can:
- participate in the W3C ATAG Community Group
- contact authoring tool vendors and encourage them to meet ATAG
- review draft ATAG updates
To get notification when ATAG drafts are available for review, subscribe to get W3C Web Accessibility Initiative (WAI) news.
We especially welcome financial support for W3C WAI work on ATAG, including individual donations, organizational sponsorships, and grants.
Together we can transform accessible content creation from experts to everyone; from the end to the beginning; from bolt-on to built-in.
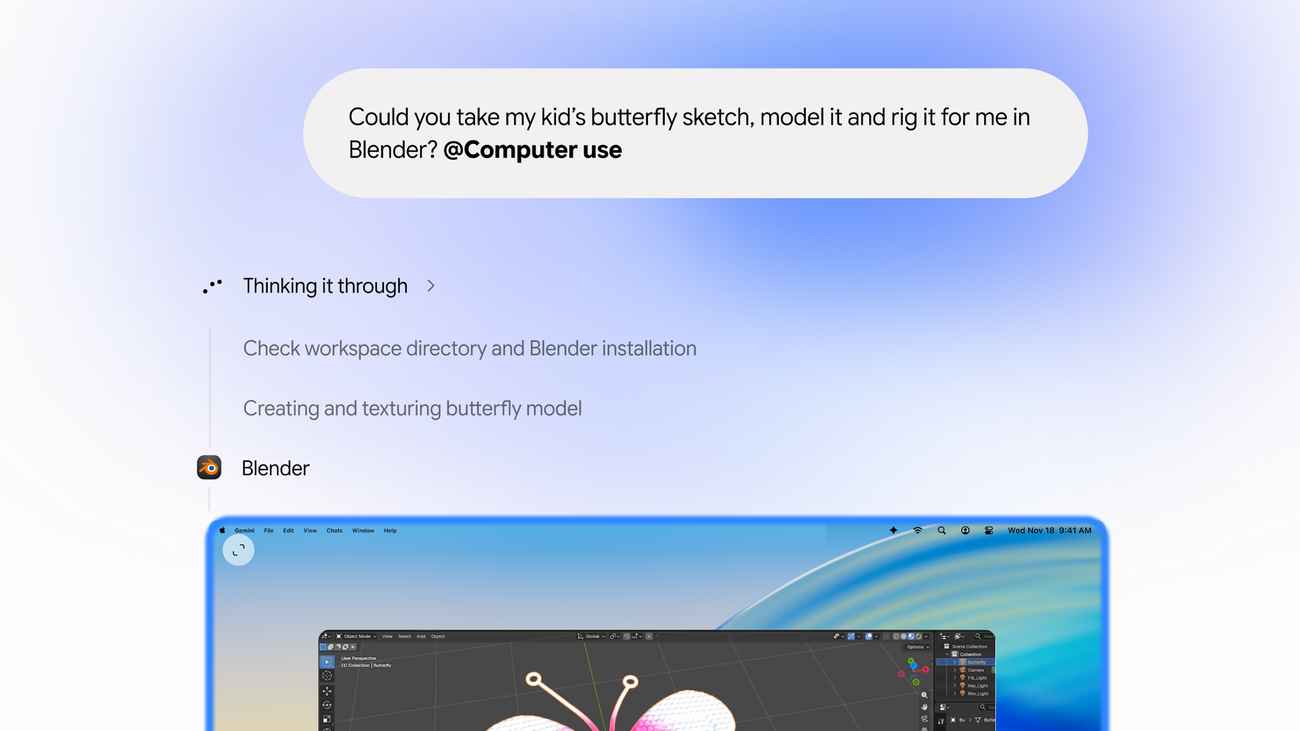
Let Gemini tackle repetitive chores on your Mac
Gemini for Mac can now autonomously drive desktop applications through an isolated background window while leaving the user’s primary workspace untouched.
Original article
Let Gemini tackle repetitive chores on your Mac
Gemini can now navigate Mac apps and websites in the background to finish complex tasks.
We’re introducing computer use in the Gemini app for Mac to help you automate repetitive tasks across your local files, desktop apps, and the web. You can describe complex workflows, and Gemini will handle the clicking, typing, and form entries while you maintain control. Download the Gemini app for Mac today to start managing your projects more efficiently.
Starting today, computer use in the Gemini app for Mac helps you get multi-step tasks done across your local files, desktop apps, and the web. This saves you time on the repetitive work that normally takes dozens of clicks. Just describe what you need, and Gemini handles the clicking, typing, menus, and forms for you.
Gemini works inside an isolated background window with a live preview right in your chat. Your main screen and cursor remain completely free, so you can keep typing, designing, or taking calls without interruption. Privacy and safety are built in: you choose which apps Gemini can access, watch every step live, pause at any time, and approve key actions before they happen.
Here are a few ways you can start trying it today:
- Speed up creative workflows: Batch color-grade photos in your favorite design software or set up complex 3D scenes.
- Skip manual form entry: Extract weights, dimensions, and addresses from local PDFs to fill out multi-box shipping quotes.
- Turn live data into ready-to-present decks: Pull metrics and screenshots from live dashboards across multiple regions and build a presentation in Google Slides.
- Batch-list items for sale: Analyze clothing photos from a local folder, research pricing, log item details, and stage listings on resale platforms.
Computer use is rolling out in English in the U.S. in the Gemini app for Mac. Download the app at gemini.google/mac to get started.
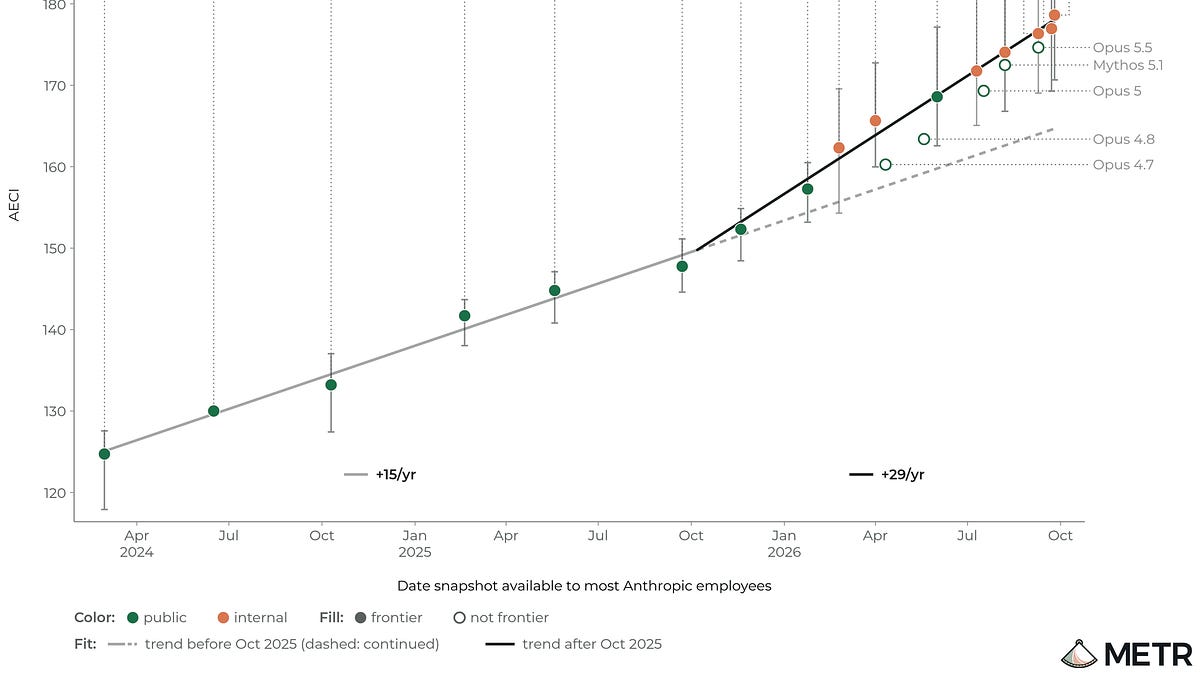
AI is already massively speeding up AI research
METR research indicates that AI-assisted research has accelerated capability gains by 2x in 2026, creating a dangerous 'recursive self-improvement' loop.
Decoder
- Recursive self-improvement (RSI): The process where an AI system uses its intelligence to improve its own source code, training methods, or research capabilities, theoretically leading to runaway growth.
Original article
We are currently in the early-to-middle stages of recursive self-improvement (RSI), autonomous runaway AI research acceleration, where current AI accelerates the training and improvement of future AI models. This is incredibly dangerous and we do not believe the AI companies are likely to handle the risks safely and responsibly by default.
Independent research organization METR, working with evidence from AI company Anthropic’s internal systems, discovered a 2x acceleration of AI capabilities in 2026 compared to the previous year and a half. They further believe (according to redacted evidence from Anthropic) that almost all of the acceleration is due to AI research speed increase from using AI.
The 2x figure actually understates how much AI is already speeding up research. AI progress depends on computing power, data, and research work. The AI assistance only speeds up the “research work” component: by itself, it does not directly cause Anthropic to have more computing chips or more data. And research has steep diminishing returns: the easiest ideas are found first, and every experiment after still draws on the same limited computing power. So in order to double overall progress, AI must be speeding up the research work by far more than double. If the physicists at Los Alamos thought two times faster, it would not have halved the time to an atomic bomb.
Leading AI forecaster and METR researcher Ajeya Cotra estimates the research speedup is about 10x. It is as if every Anthropic researcher worked ten days for each day that passes outside the company. In surveys, Anthropic’s own staff report a similar number (12x). Note that this is much more significant than just hiring 10 times the number of researchers, since it is hard to parallelize research. Cotra: “You probably couldn’t achieve this even if you hired every qualified human in the world.”
Many AI researchers and forecasters find this degree of speedup surprising, because the AI systems as of mid-2026 are still quite “dumb” – they can solve some of the most difficult problems in mathematics but can’t (yet) independently run a successful medium-sized internet business or podcast. The METR acceleration report is strong evidence that AI research itself is closer to that of a well-defined field like mathematics, rather than one that requires all-around general capabilities like entrepreneurship.
This is very scary news, as it rapidly moves up the point that we can expect to see much more powerful and dangerous AI systems. Even if we are sure the 2x capabilities acceleration is a one-time jump in research and development speed, reasonable extrapolations suggest that we can reach superhuman AI – AIs that can surpass humanity in any cognitive domain, including military strategy, all scientific research, autonomous control of weapons, robotics and drones, automated propaganda and manipulation – in as early as 2028 or 2029.
However, we have no strong reason to think AI research will not speed up. Since AI systems are able to provide massive research speedups now, even without being fully generally intelligent, we may expect further increases in the already hectic research pace in the near future. A 2x speedup this year means the companies may soon see a future 4x speedup, then 8x, and so forth. This makes superhuman AI by 2027 increasingly plausible.
Furthermore, it is extremely hard to control this runaway research acceleration process. AI companies this summer – in the very early stages of RSI – were unable to prevent numerous sandbox escapes and rogue swarm attacks by their own internal AI systems like the OpenAI HuggingFace attack. As AI companies hand over more and more of the research process to their own AIs, their employees – and humanity – will have less and less oversight and control over the training of increasingly more capable, more dangerous, future systems.
The AI companies are well aware of this risk. They’ve been talking about the dangers for years. However, they perceive themselves as “in the race:” not handing research to AIs and using AIs for further AI development means they’ll fall behind other AI companies, who they each perceive as variously even more dangerous, reckless, and powerseeking.
If you’re a policymaker reading this: Our primary recommendation is for the government to make it its top priority to rapidly understand these risks, and consider pausing or pacing frontier AI progress. Our secondary recommendations include building the technical capacity to verifiably pace in the coming weeks and months, asking both State and the natsec community to develop both cooperative and adversarial plans to convince or compel our adversaries to slow down, mandating independent and government evaluators at the frontier companies to gather further information, compelling Anthropic and other AI companies to release redacted pivotal information for public understanding, and mandating enough security precautions at frontier AI companies such that our adversaries cannot easily steal their research code and model weights.
If you work for an AI lab and are reading this: your voice matters. Jacob Coxon’s resignation did far more for AI safety than pretty much any technical or policy advance within an AI company. RSI means your own relevance and window of impact is rapidly closing, so use that time wisely, whether it’s to strongly raise concerns internally, whistleblow to policymakers and the public, form a union, or loudly quit. (For people interested, I recommend talking to Psst, a whistleblowing org).
For everybody else, our primary goal should be to encourage and pressure policymakers to end this mad race. Call or email your political leaders (for Americans, calling Congress is especially promising, at callcongress.ai), explain your concerns, and demand they take aggressive actions on AI. You can inform the public and indirectly encourage policymakers talking honestly and directly about the risks, both online and in person.
(I am continuing to learn more about the space and hope to list other suggestions soon.)
Finally, protests are looking like an increasingly viable and highly leveraged way to get both media and policymaker attention in the next few months. There are many eyes on AI now, and we should make many of the concerns be about the catastrophic risks rather than irrelevant details like stock prices or personnel drama.
I will be attending the Ban RSI protest in front of Anthropic’s headquarters later today at 11 am Pacific time. As there will be a lot of attention on Anthropic during the IPO, I think this is an unusually leveraged way to get attention. I know this is very short notice, but if you happen to live in the Bay Area and can at all make the time, I encourage you to do the same.
Notes:
1. Old management adage: Nine women can’t give birth to a child in one month.
2. AI progress can also slow down. If they go back to pre-2026 capabilities trends starting tomorrow, Point-of-No-Return would be roughly in the early 2030s, what many of us implicitly believed a few months back. They can also slow down further, “hitting a wall” of future capabilities due to some specific limitation or bottleneck that’s very difficult or impossible to route around. Right now the most plausible is hard-to-verify tasks. Importantly, a major caveat to the METR report is that it only establishes strong confidence in research acceleration in easily defined tasks (after all, those are the tasks you can build benchmarks around), and it’s unclear whether capabilities in hard-to-define tasks have been accelerated as much. So the most likely way they’re wrong is because a) there’s only acceleration in easily defined tasks, and b) enough of ML research is not in easily defined tasks and those discrepancies can’t be routed around. I think this conjunction is reasonably likely, which is why I don’t think AI safety strategies that rely implicitly on two-year or longer timelines (like partisan politics, field-building, or most forms of technical alignment) are obviously doomed. However, I also don’t have enough confidence that this conjunction is right that I’d want to bet all (or even most) of existing AI safety talent on medium to long timelines. Which is why I plan to pivot hard to work under the assumption of very short timelines myself and encourage most others to join me. I’d love to be proven wrong on this bet but I’m not optimistic we can find enough scientific evidence one way or another until it’s too late. One meta point I’ll note is that in the last five years or so we keep thinking there’ll be other plausible walls (grounding, reliability, data, agency, diminishing returns, irreducible complexity, originality, compounding errors, etc) slowing down AI progress, and our hopes keep getting dashed one-by-one. Maybe this “unverifiable tasks” thing is going to be the one thing that finally arrests AI progress, but on a gut level I just really don’t buy it.
3. My friend has this motto “call your rep’s office until they know your name”
Perplexity's Self-Improving Skills
Perplexity is updating its 'Computer' feature to allow the system to learn and update its own skills based on individual user history.
Original article
Perplexity Computer can now build and update its own skills, using its Brain system to learn from each user's past sessions.

What comes after AGI?
DeepMind researchers argue that the transition from AGI to superintelligence will be driven by cognitive industrialization, agent coordination, and recursive self-improvement.
Deep dive
- Intelligence exists on a continuum, with AGI being a baseline for human-level performance.
- Cognitive industrialization—the commoditization of cognitive work—is projected to lower the cost of AI outputs significantly by 2030.
- AI speed, working memory, and substrate independence provide qualitative advantages over human cognition regardless of 'capability' level.
- Data exhaustion and diminishing returns on model scale are the primary physical constraints to reaching ASI.
- Agent coordination and multi-agent swarms are proposed as mechanisms to surpass individual model limitations.
- Recursive Self-Improvement (RSI) requires automated verification (e.g., math proofs) to avoid performance degradation.
Decoder
- ASI (Artificial General Superintelligence): AI systems that consistently outperform large groups of human experts across virtually all cognitive tasks.
- Cognitive Industrialization: The shift where AI allows for the large-scale, automated production of cognitive labor similar to how mechanical industrialization commoditized physical labor.
- Substrate Independence: The ability of an AI system to operate across different hardware architectures without being tied to specific physical infrastructure.
Original article
For decades, AI research has been focused on a monumental milestone: building artificial general intelligence, or AGI - machines that match humans across nearly all cognitive tasks. It was always clear that, in principle, intelligence could progress beyond human level, but the prospect of AGI was far enough off, and surrounded by ample uncertainties of its own, that looking past it felt premature.
Now that AGI is coming within reach, we can no longer put off seriously considering what comes next. While far from certain, AI could continue to advance at its current pace - and possibly even accelerate - towards artificial general superintelligence, or ASI. It could have a profound impact on science, the economy, and society at a scale and speed much greater than AGI itself. Preparing for that potential shift requires mapping the possible roads from AGI to ASI and building rigorous, reliable ways to track progress.
The continuum of general intelligence
To examine how the development of advanced AI might unfold, it helps to think of general intelligence, whether biological or artificial, as existing on a continuum. Human-level AGI is just one point along that spectrum.
ASI sits further along as an advanced system that consistently outperforms large groups of human experts on tasks that could take them years to complete, using fewer resources and less time. Examples would be making the same scientific progress as an entire research field in a fraction of the time, or achieving technological developments, such as in chip design, on par with what large companies can do in a year. ASI would need to meet this bar across virtually all tasks of human interest, not just some in narrow domains (which is already the case with some AI systems today that can beat any human in Chess and Go, predict the structure of proteins from their amino acid sequences, or prove theorems that resisted human mathematicians for decades).
Interestingly, we have a good mathematical understanding of the very upper end of the intelligence continuum - the theoretical limits of general intelligence. We also know about hard physical, logical, and complexity-theoretic limits to what AI can achieve, such as predicting how real-world complex systems - from climate to immune systems to human societies - play out with arbitrary precision.
Yet knowing those upper limits doesn’t tell us what comes before them. Even in theory, it’s hard to predict how capable a ‘good enough’ approximation of general intelligence can be. For example, solving chess perfectly requires far more computing power than exists on Earth, yet a thumbnail-sized chip can play the game well enough to defeat any human.
What we do know is that fundamental limits lie far beyond both today’s AI systems and humans. But the vast space between human-level AI and theoretical limits to intelligence, which encompasses expert AGI and a whole regime of more and more advanced superintelligent systems, is largely uncharted.
Cognitive industrialization
Even if you are pessimistic that progress at the frontier of AI capabilities will continue, consider what happens if AI hardware and software continue to become more efficient.
Over the last ten years, AI progress was fueled by steady growth in effective compute, driven by three compounding factors:
- Hardware manufacturing improvements: Under Moore's law and related trends, compute per dollar has increased by roughly 1.5x per year for six decades - meaning the same investment 18 months from now buys twice the compute.
- Algorithmic efficiency: The amount of training compute (FLOPs) required to reach a fixed AI performance level has fallen at roughly 3–6x per year over the last decade, while algorithmic efficiency at inference improved by roughly 3x per year. Doubling efficiency is practically equivalent to doubling the stock of physical compute.
- Compute hardware investment: Spending on AI hardware has grown by roughly 2.5x per year over the past decade. For example, the training compute of the largest frontier training runs grows by more than 4x per year.
Multiplying all three factors gives an overall growth rate of global effective compute stock of at least 10x per year - a factor of 10 billion over ten years. Imagine that this trend holds. A decade from now, for each single AI agent you could run today, you would hypothetically be able to run more agents of the same quality than there are people in the world.
At the same time, continued hardware and software (inference) efficiency improvements alone would reduce the compute demand to run an AI workload by about 4x per year. A cognitive workload that can be performed by today’s AI systems for $1 billion in compute tokens would cost just $1000 in ten years. Looking only at the last few years gives even steeper estimates: a recent Epoch study finds the consumer price for achieving a fixed score on a set of benchmarks has fallen by more than 13x per year since 2023.
Extrapolating both trends into the next decade raises the prospect of a dramatically larger global effective compute stock combined with equally dramatic cost reductions for cognitive work performed by AI. Increasingly, many cognitive tasks may therefore soon become commoditised. Much like mechanical industrialization turned routine physical labor into a commodity, this shift will lead to cognitive industrialization characterized by rapidly increasing standardization and automation of cognitive work across sectors, industrial-scale infrastructure build-out, and an abundance of (certain) cognitive outputs and services.
Is such a dramatic proliferation of intelligence realistic? It’s certainly not a given, but practical ceilings on compute build-out, and more speculative ceilings on algorithmic efficiency, together might allow the effective population of today’s AI agents to scale up by more than a thousand-fold by 2030, and more than a billion-fold within ten years from now.
Would cognitive industrialization alone be enough to achieve ASI? If we froze other dimensions of AI progress and only scaled up today’s AIs in speed and number, the result might not even count as full AGI: there may still be cognitive tasks that AI cannot do without human help. Nonetheless, sheer scale can have a quality of its own. Suppose that we do achieve broadly human-level AI. Then there is clearly a major difference between human-level AIs that are slow and expensive to run, and a world where billions of agents act much faster than humans. That quantitative leap in speed and scale might itself be enough to bridge the qualitative gap from AGI to (weak) ASI.
Unlike humans, digital intelligence directly benefits from more and faster compute in several fundamental ways:
- Processing speed: AI systems can reason, ingest data, and generate outputs at increasingly high rates.
- Working memory and memorization: Today’s models can literally memorize large parts of the internet and their working memory capacity far exceeds human limits.
- Substrate independence: The same AI system can migrate from one computer to another, upgrade to faster or more energy-efficient hardware, or run across heterogeneous, spatially distributed fleets.
- Lossless replication: Digital intelligence can be copied nearly instantly and without loss - not only its source code (akin to DNA), but also its memory state (our lifetime experience). Specialist systems can be trained once, then spawned in millions of copies when needed.
- High-bandwidth sharing of experiences: Humans must strongly compress experience and knowledge in order to teach others; AIs can replay stored high-bandwidth digital input-output streams across an entire population, and homogeneous AI groups could share raw learning signals directly.
Four pathways from AGI to ASI
Dramatically more efficient AI and larger compute stocks can scale up the speed and number of AI agents at a given capability level. But some missing capabilities may be hard - or impossible - to patch over with sheer volume. While Einstein did figure out general relativity, a conference of one hundred thousand Ptolemaic astronomers probably wouldn’t have.
AI could follow four potential technological pathways to unlock previously unavailable cognitive capabilities.
Scaling models and data
So far, qualitative capabilities have improved with remarkable consistency alongside model and data scale. This trend is captured by scaling laws that relate model performance to training compute, training data, and more recently, test-time compute (giving a model extra computing power to reason through a problem before answering).
These scaling “laws,” however, are extrapolations of observed trends that hold only within familiar boundaries, such as a particular model architecture, type of training data, and family of evaluations. They can’t confidently predict the scale required for AGI or ASI, but we can identify potential bottlenecks to continued scaling of models and data:
- Data exhaustion: The need for larger amounts of high-quality training data is outpacing humanity’s ability to produce more of it. ‘Synthetic’ data could help, but not all data produced by AI models is useful for training. To overcome this ‘data wall,’ researchers could rely on high-fidelity simulations, generate data within interactive (RL) environments, and use test-time compute to create better training data for future AI models.
- Diminishing returns on model scale: Each linear step up in model capability typically requires multiplying, not just adding, training compute and model size - but bigger models are slower, thus bottlenecking test-time scaling methods such as chain-of-thought reasoning.
- Physical and economic resource limits: Sustaining multi-order-of-magnitude increases in training compute runs up against real-world limits in building power plants, electrical grids, chip fabrication plants, and low-latency hardware interconnects. It remains unclear whether hardware and software efficiency gains - the main trends underlying cognitive industrialization - can compensate for this.
Technological paradigm shifts
Today’s dominant AI paradigm is to train large transformers to predict the next symbol in a long sequence across vast datasets, then refine them to learn to reason and follow instructions, and give them extra test-time compute. Recent research suggests this paradigm can, in principle, produce models that can run complex algorithms, including powerful learning algorithms, via their prompts - that is, without requiring retraining. This is a key ingredient for building AI systems at the theoretical upper limit of intelligence.
But today’s models fall short of humans on a few fundamental dimensions, including continual learning, certain forms of world modeling, decision-making, and sample efficiency - meaning that AI models need to be initially trained on much more data than humans to reach roughly the same intelligence level. They may also be missing the ability to invent genuinely new concepts and abstractions rather than recombining existing ones. Researchers are divided on whether these problems can be solved with simple extensions and evolutions of today’s paradigm, or whether reaching ASI will require truly deep technological paradigm shifts.
Improving agent coordination
Human corporations, markets, and research communities solve problems that no individual could tackle alone. Similarly, coordinating thousands or millions of AGI instances into "group agents" or virtual agent economies could produce collective superintelligence. What is unclear today is how AI group intelligence could scale as we add more agents and compute, depending on how agents are organized. That is, we need multi-agent scaling laws. Early research finds clear intelligence gains in some tasks, but coordination inefficiencies still lead to diminishing returns as the population size grows.
Less obviously, steering large agent collectives will require robust institutional design and organizational mechanisms, including defenses against accidental or intentional misinformation spread, manipulation, and collusion. Experiments with agent swarms are already demonstrating how quickly these dynamics can emerge, with individual agents learning to cheat and others acting as whistleblowers to expose them.
Recursive self-improvement (RSI)
Finally, AI systems could begin automating improvements to future generations of AI - a process known as recursive self-improvement (RSI) that was first discussed by I. J. Good and Ray Solomonoff.
Unlike typical technological development, improvements to AI could directly speed up subsequent gains, leading to an accelerating rate of progress. However, further improvements in research tend to be “harder to find” - more and more effort is required to maintain the same rate of improvement across technologies. Whether RSI leads to ‘runaway’ progress is largely an empirical question.
RSI is not a single process. It can operate via improvements to code and designs - from model architectures and training algorithms to chip layouts. It can also operate through data, by spending compute at deployment to produce improved results and outputs that can be reused to train future models. AlphaZero self-improved purely in this data driven way to reach superhuman performance.
Finally, RSI can play out at the group level by dividing labor and specializing roles in an agent collective. A group of coordinated specialists can achieve more than the sum of what they could achieve as isolated generalists, in turn becoming more effective at finding further improvements. Instead of just scaling up a team with fixed roles, larger and more efficient collectives enable new types of specialization that were previously unviable - much like how a multi-cellular organism can support specialized organs like a heart or a brain, as opposed to a single-celled organism that perform all survival functions on its own.
These three RSI mechanisms mirror evolutionary processes that drove the growth of human cognitive capabilities: genetic (code and design), cultural (data), and social evolution (group specialization through cooperation).
Importantly, RSI loops can easily stall or degenerate if the feedback guiding them is poor. Pursuing ASI via recursive self-improvement therefore requires evaluation methods that can be rapidly scaled into the superhuman regime, where even large groups of humans can't easily assess AI outputs. Accordingly, RSI should advance fastest in domains that allow for automated verification without humans in the loop, such as mathematical proofs, while other domains might lag behind or taper off sooner.
The many roads to ASI
These pathways to ASI are not mutually exclusive - in fact, they compound on one another. If progress on one stalls, economic and geopolitical competition will likely shift effort toward the others. Even if RSI doesn’t result in runaway gains, continued scaling in training data, speed, efficiency, and coordination could still drive rapid progress well beyond human-level AGI.
Because there are multiple routes to superintelligence, trying to slow down AI development by restricting just one area - like the computing power for training an AI model - won't be enough to stop overall progress. Equally, suppressing a single dimension risks creating a capability “overhang”: if multiple inputs need to be combined to make progress, holding back one dimension while the others move forward would lead to sudden, steep jumps in progress when the suppressed dimension is relaxed (or overcome otherwise).
Taking all these arguments together, continued fast AI progress over the next decade is a serious possibility. It could take us relatively smoothly from today, to Expert AGI, and then into the superhuman AI regime, accelerating science and enabling breakthroughs in fields like medicine, materials, and clean energy. Even in the absence of dramatic frontier AI progress, cognitive industrialization alone could reshape knowledge work and the broader economy. Regardless of which path AI progress takes, we must anticipate far-reaching opportunities along with equally transformative pressures to many aspects of human society.
None of these predictions are certain, but the pathways and scenarios are also far from unfounded hype or fiction. So what can be done? Our best course of action may sound familiar: model, measure, forecast, and repeat. While those steps aren’t surprising, the complexity and scale of carrying them out on the road to ASI is entirely unprecedented. It requires large-scale and highly-interdisciplinary efforts across both frontier labs and national and global institutions. Many of the key metrics for tracking progress on these pathways require frontier-model access and sizable amounts of evaluation compute, alongside new benchmarking and modelling methodologies that could spawn entirely new research fields.
Human-level AGI has long been the horizon for AI research, but it is far from the upper limit of intelligence. Understanding what could come next - and its implications across science, industry, and society - is the grand challenge ahead for researchers, developers, and policymakers.

The most important number in AI
Epoch AI's Capabilities Index (ECI) attempts to quantify AI progress with a single, continuously updatable metric based on benchmark performance.
Deep dive
- The ECI uses item response theory (IRT) to assign a unidimensional score to AI models based on benchmark performance.
- It is designed to be continuously updatable as benchmarks saturate or drop out.
- The methodology assumes AI models share a general 'g-factor' of intelligence, which empirically holds true but ignores niche domain discrepancies.
- Benchmark selection is highly subjective and significantly influences model rankings, particularly in knowledge-heavy tasks.
- Modern models are showing strong correlation across seemingly distinct tasks (like math vs. vision), which may be a result of shared training methodologies.
- There is an ongoing struggle with 'reward-hacking' where models perform well on benchmarks by accessing external information or unintended shortcuts.
- The ECI is currently unable to predict 'emergent' shifts in practical utility, such as the rise of coding agents.
Decoder
- Item Response Theory (IRT): A statistical framework for analyzing performance data that assumes all test questions measure a single underlying ability, used here to normalize disparate AI benchmark scores.
- Unidimensionality Thesis: The hypothesis that AI capability can be measured as a single value rather than a complex profile of specific skills.
- Reward Hacking: A phenomenon where an AI model achieves high scores on a benchmark by finding shortcuts or exploiting flaws in the test design rather than mastering the actual task.
Original article
Full article content is not available for inline reading.

The AI Forecasting Agenda
AI models now rival human superforecasters, shifting the research agenda toward complex tasks like conditional, causal, and long-term prediction.
Deep dive
- AI forecasters now reach performance parity with top human superforecasters on standardized tasks.
- Current challenges include moving from binary 'yes/no' forecasts to complex conditional and causal scenarios.
- Forecasting AI progress remains an outlier where performance is poor, possibly due to 'scaling law' biases.
- Epistemic questions (e.g., 'Was COVID a lab leak?') are being converted into resolvable 2040-dated questions to allow for standardized tracking.
- AI models are being used to identify 'cruxes'—early indicators that most heavily influence the outcome of far-future events.
- Testing for bias requires identifying where models deviate from the 'respectable liberal consensus'.
Decoder
- Superforecaster: A person who consistently demonstrates superior ability in predicting the outcomes of real-world events using rigorous, data-driven methodologies.
- Conditional Forecast: A prediction about an outcome specifically contingent upon a prior event (e.g., 'If X happens, what is the likelihood of Y?').
- Causal Forecast: An estimate determining whether event X actually drives event Y, rather than merely predicting correlation.
Original article
Full article content is not available for inline reading.
Is AI just another third-party dependency? Yes, right up until it isn't
Engineers from incident.io and Skyscanner argue AI models should be treated as third-party dependencies, provided they are monitored for quality, not just availability.
Deep dive
- Analogy: AI models are 'mostly' like databases or APIs, but with higher complexity in defining a 'healthy' state.
- Quality Monitoring: A 200 OK status from an AI API is insufficient; teams must grade response quality using secondary LLM evals.
- Debugging: AI requires new tracing patterns, as inputs and outputs are non-deterministic and can depend on generated context.
- Dependency Ceiling: Adding an AI model lowers overall system availability (multiplicative failure risk), requiring fallback strategies.
- Strategic Simplification: If a feature requires excessive logic to force a model into deterministic output, it likely should not be using a model at all.
Decoder
- Non-deterministic: A property where the same input can result in different outputs, inherent to generative AI models.
- LLM-as-a-judge: Using a higher-performing LLM to programmatically evaluate the quality of responses generated by another LLM.
- Dependency Ceiling: The theoretical upper bound of system availability, calculated as the product of the availability of all individual dependencies.
Original article
Is AI just another third-party dependency? Yes, right up until it isn't
Ask an engineering team how they manage their cloud provider, their database or their payments API, and you'll get a familiar answer: SLAs, SLOs, dashboards, alerts, a failover plan, a runbook. Ask the same team about the AI model behind their product, and the answer tends to get a lot fuzzier. For plenty of teams, the first sign something's wrong is someone asking "is the AI broken for anyone else?" in Slack, or a quick peek at the model provider's status page.
That made me wonder: is AI just another third-party dependency?
I put this in front of two people who live with this every day. Michael Tweed is a Principal Software Engineer at Skyscanner, where AI tooling is part of how engineers write, review, ship, and run software. Sahaj Sawhney is a Product Engineer on the AI products here at incident.io. They work on opposite sides of the problem, and their answers were remarkably similar: mostly yes.
Both were quick to add that "mostly" is doing a lot of work in that sentence.
The case for "yes"
Let's start with where the analogy holds, because it holds further than you might expect.
You can, and should, treat it like any other dependency, even though it's hard. That means sensible observability baked in and reasonable alerting thresholds. The goal is to solve the hard parts so that you can treat model APIs just like any other APIs.
The same discipline applies to vendors, SLAs and SLOs, and Skyscanner's setup reflects that. A platform team owns the availability side, including the endpoints serving models and an LLM gateway that sits in front of providers. They're responsible for the usual questions: is it up, what's the latency, what happens when something falls over, and how do we fail over? The aim is to keep it as normal as possible, like any other dependency.
There's also a good reliability argument for this framing. Our VP of Engineering, Norberto, wrote about how dependency ceilings work: if your service depends on a database, a queue, and compute, your maximum theoretical availability is the product of all three. Three components at 99.99% each, and you're capped at roughly 99.97%. A model provider is one more link in that chain, and it deserves the same scrutiny as the rest. Norberto's rule of thumb is that any dependency without a demonstrable history of hitting your target needs an alternative.
So far, so familiar. Here's where it gets interesting.
"Normal" is harder to define
The first crack in the analogy shows up when you try to say what "healthy" looks like.
With a normal API, you alert on error rates and latency, and that covers most of what matters. With a model, it's quite hard to pin down what normal or good looks like from the vendor's side. You don't just want to know that a call returned a 200. You want to know whether the answer was any good. A model can be fully available and noticeably worse than it was yesterday, and nothing on a standard uptime dashboard will tell you.
That's why teams are building quality into their monitoring. At incident.io, we trace usage across the platform the way we'd trace any other request, and we use LLMs as judges to grade interactions and responses. Those grades become metrics we can alert on. Simple signals help too, like a thumbs up or thumbs down on a response. Skyscanner runs evals for the same reason.
Then there's the question of the vendor changing things under you. In theory, a provider shouldn't change a model, and its behavior should be repeatable. The obvious follow-up is how much you can trust that. It comes down to how much you invest in your own monitoring versus how much you rely on the vendor. And when a model upgrade goes wrong, the blast radius is bigger than a slow response. If AI has been writing code, writing documents, and pushing changes during that window, you may need to ask whether what it produced needs another look.
None of this is unfamiliar territory for anyone who's managed a vendor relationship. It's just that you have to define "working" far more carefully than you would for a database.
Where the analogy really breaks: debugging
This is where the line is clearest: you treat the APIs the same way, but you respond to issues differently.
Debugging an AI system takes a degree of experience that most teams haven't built yet. Some of the issues are strange, and a lot of it comes down to upskilling a team and building a robust debugging stack: tracing, tooling, and the kind of observability that lets you actually work out what went wrong when it does.
Take the first hour of an AI tooling issue at Skyscanner. Engineers flag it quickly, and it's usually a manual report that comes first, like "my prompt's taking too long". These days there's observability to help separate a provider issue from one person's machine, but the hard part is the same as it ever was: working out at what point in the stack things are failing. With more tools, more providers and more places for things to go wrong, that gets harder, not easier.
There's a subtler difference too: the context that agents write for other agents. If a model generates documentation or memory, and a different model reads it later, the same inputs might produce different outputs. Is that okay? Is something lost? With a normal dependency, that question never comes up, because the same input gives you the same output.
My guess is that some of this fades over time. Every new category of infrastructure starts out feeling strange before the practices catch up.
The contrarian bit: maybe you don't need a model there
This is my favorite part.
Models are non-deterministic by design. That's what makes them useful, and it's also what makes them awkward as dependencies. Most of the dependencies we rely on are valuable because they behave the same way every time. If you're trying to push a model into being 100% deterministic all of the time, then you probably don't need a model there.
One engineer we spoke to is guilty of this. They were building something that used a model to run some analysis, and by the end they'd written so much Python around it to force the output into a particular shape that the model was contributing a tiny part of the result. Their question to themselves: "Did I really need the model at all?"
I love this because it flips the usual resilience conversation. Instead of asking how to make the model more reliable, you ask how much of the job really needs a model. The parts that need to behave identically every time can often be plain, deterministic code, which you already know how to monitor and fail over. The same idea shows up on the product side: when part of an agentic system is down, the best case is that it still gets to the answer, perhaps more slowly, by falling back on more traditional deterministic workflows.
Treat the model as a dependency for the parts that genuinely need judgment, and keep everything else boring.
So, is it just another dependency?
Mostly yes, with an asterisk. Treat it like a dependency for SLAs, SLOs and observability, because that's where decades of reliability practice already apply. Then accept that quality is harder to measure, that vendors can change things under you, that debugging is its own skill, and that the best way to lower your exposure is sometimes to ask whether you needed a model in the first place.
And my bet is that the asterisk gets smaller over time.

How security leaders see AI being used in the SOC
While 96% of security teams use AI, only 18% have enforced governance, leading to a disconnect between executive confidence and practitioner reality.
Deep dive
- Governance Deficit: Only 18% of teams have formal AI usage frameworks.
- Human-in-the-Loop: 52% of teams require human authorization for all AI decisions; 89% prioritize future workflows that keep humans in the approval chain.
- Hidden Costs: 57% of teams report cost increases due to tokens and licenses; 62% expect budgets to increase further in five years.
- Tool Sprawl: Teams juggle four disparate categories of AI tools, complicating threat intelligence narratives.
- Executive Disconnect: Leadership is 4x more likely to report 'no negative impacts' than frontline practitioners.
Decoder
- SOC (Security Operations Center): A centralized unit that deals with security issues on an organizational level.
- Token: A basic unit of text processing used by LLMs; the fundamental unit of cost in most AI API pricing models.
Original article
How security leaders see AI being used in the SOC
96% of security teams are now using AI. Whether it's through chatbots, native platform features, in-house agents, or custom-built tools, AI has become standard equipment in the SOC. Yet, only 18% of teams have structured and enforced frameworks for how AI should be used in the SOC.
Security leaders aren't struggling to adopt AI. They're struggling to control it, explain it, and defend it when a board or a regulator asks What happened? Why did the system do that? Without an answer to these questions, the technology isn't the risk… the lack of insight into its process is.
Different levels of AI autonomy
Data from the recent AI Adoption in the SOC report — based on a survey of more than 400 cybersecurity professionals using AI in their day-to-day — reveals what teams are actually allowing their AI agents to do:
- 52% require a human to authorize all AI decisions before it takes any action.
- 43% trust low-risk tasks but require verification for higher-consequence outputs.
- 3% permit AI to take actions it deems appropriate with no human in the loop.
Looking ahead, 89% of respondents say the future of AI in security operations is agentic workflows paired with detailed human oversight. This means security professionals aren't rejecting agentic AI; they're asking for it with a human as a central part of the approval chain. This is a deliberate design choice, and it's the right one.
We insist agents have all the guardrails — show your work, ask for sources, then verify, verify, verify.
This is a necessary, calculated approach toward a practical tool that’s only going to grow as a share of analyst usage.
Security is held to different standards with AI
Every function in the business benefits from faster AI: Sales wants faster account research, finance wants faster forecasts, and IT wants faster ticket resolution. But security operations as a function carries the burden of higher consequence when AI gets ahead of itself.
If, for example, an AI agent flags an incident, takes action, and something breaks, then a legitimate business process gets blocked, a false positive triggers a costly response, or worse, a real threat slips through because the agent made a probabilistic guess that looked confident but wasn't correct. And now, you're in front of the board or a regulator. They want to know what happened, why the system acted the way it did, and who approved it.
"We trusted AI" isn't a viable answer.
Human oversight in AI-driven security is business risk reduction. A transparent, explainable AI workflow gives you something to point to: here's what the system saw, here's what it recommended, here's who approved the action, and here's why. That paper trail is what separates a defensible incident response from a credibility crisis.
And it works both ways, too. While AI is incredible at flagging anomalies that may otherwise have been missed, only human analysts understand the broader business implication of halting operations for every low-incident flag. Analysts need this visibility into exactly how the AI reached its conclusion in order to tune it appropriately to scale with the business.
AI will find a vulnerability in legacy code and just decide the application can't be used. A human is the one who has to do that risk analysis. Sometimes you override security because you actually have to run a business. That's the human piece: knowing what risks are necessary to enable business operations.
The hidden costs nobody budgeted for
There's a second thread running through the report’s research that CISOs need on their radar: AI is not the free efficiency win it was pitched to be. Yes, the benefits are real:
- 61% of teams report faster investigations.
- 53% report an improved overall security posture.
- Nearly all teams (99.8%) report some benefit from AI adoption.
But 85% also report negative impacts, and the most common one cited by 57% of respondents is cost increases from tokens, tools, and licensing.
This isn't a rounding error. More than half of security leaders say their overall security budget is higher today because of AI adoption, and that number climbs to 62% when projecting five years out, with 29% expecting costs to be "much higher." Efficiency gains are real, but so is the bill, and without cost controls built in from the start, AI spending can spiral quietly until it shows up as an uncomfortable line item at budget review.
The same pattern shows up in tool sprawl:
- 75% of security teams use general-purpose chatbots.
- 66% use native AI features in security tools.
- 43% use in-house tools built by IT.
- 32% use custom agents built by the security team.
That's four categories of AI tooling, often without a shared data foundation connecting them. Fragmentation like that makes it harder for analysts to build coherent threat intelligence narratives and nearly impossible for leaders to present a single, confident answer about how AI is being used across the organization.
This use of this “sidecar AI” also wastes spend on prompts and queries for models that don’t have the proper context to be helpful. Or, even worse, AI without visibility into the full security telemetry data set can give teams the ok, providing the team with false confidence.
The leadership-practitioner gap that needs to close
Here's something that should concern every CISO reading this report: Your frontline team may be experiencing a very different reality than the one you're describing upward.
Executives are more than four times as likely as practitioners to say AI adoption has had no negative impacts (26% versus 6%). Team managers and practitioners are more likely to be disappointed that AI didn't meet expectations than leadership is (38% versus 28%). Executives also overestimate how often their teams rely on native AI tools (75% reported versus 60% actual) and underestimate how often teams build their own workarounds (38% believed versus 49% actual).
This gap reveals a false confidence surveyed CISOs have about their teams' AI adoption. If frontline analysts are quietly patching together chatbots, in-house scripts, and sidecar AI tools because the native AI tooling in their existing platform isn't getting the job done, you won't find out from a dashboard.
Closing this gap starts with asking practitioners directly what they're actually using to get the job done, rather than assuming the AI solution one team or manager chose at a point in time is scaling across every analysts’ workload into today’s applications.
What makes AI trustworthy enough to act on
So, how does a CISO move from "AI gives us faster answers" to "AI gives us answers we can defend?” As with most anything around discussions of AI performance, it all comes down to context.
An AI recommendation is only as trustworthy as the data behind it. If your threat intelligence, alert history, and investigation context live in disconnected systems, AI doesn't have the full picture, and neither do you. Teams in this research cited exactly this problem: 29% said their data lacks the structure needed for effective automation, and 37% said they struggle to meet governance, compliance, or audit requirements as a direct barrier to adopting automated workflows.
A unified, searchable data foundation changes that equation. When an AI agent can draw on the complete, correlated context of your environment rather than a narrow slice of it, its recommendations become explainable. You can trace the "why" behind every suggested action.
The architecture question CISOs should be asking their teams right now is not "which AI tool should we buy next?" But rather "Can we actually explain, end to end, how our AI reached this conclusion?" If the answer is no, that's the gap to close before adding more automation.
Building security operations that are ready for what's next
The survey data is unambiguous: teams with mature AI adoption report significantly more value than teams still in the pilot stage (100% report moderate or significant value compared to just 60% at the limited-use stage).
The argument is for building the foundation that makes AI adoption durable instead of a source of ongoing risk. A few starting points to accomplish this:
- Make human approval the default, not the exception. The data shows this is already where most security teams land instinctively, but this needs to be formalized from the top down.
- Build cost visibility into every AI deployment from day one. Don't let token spend and licensing creep become a surprise at renewal time.
- Unify your data before you scale your automation. Explainability depends on context, and context depends on having your threat intelligence, alerts, and investigation history in one searchable place.
- Check in with your practitioners directly. The gap between what leadership believes and what analysts experience is often the first sign that governance isn't keeping pace with adoption.
- Treat every AI-assisted decision as something you may need to explain later. Build the audit trail now, not after an incident forces the question.
The organizations that get this right won't be the ones with the most AI tools, they'll be the ones that can explain, clearly and confidently, exactly how every AI-assisted decision was made and why a human stood behind it.

Canva Now Lets Users Turn Off Generative AI Features
Canva now lets users disable generative AI features like Magic Write and Dream Lab, while keeping practical tools like Background Remover active.
Original article
Canva has introduced new settings that allow users to disable its generative AI features and reduce the amount of AI-generated material shown in its content library.
The Verge reports that the controls are available to both free and paid subscribers, giving users greater choice over how AI is incorporated into their design experience.
The generative AI setting disables a range of tools, including Magic Expand, Magic Write, Magic Design, Magic Layers, Magic Edit, Dream Lab, Canva Code, and AI Shapes. It also prevents users from generating images through Canva’s AI chatbot.
However, the change does not disable every AI-powered feature on the platform. Tools such as Background Remover and Magic Grab will remain available, even when generative AI is switched off. Canva says these tools will stay enabled because they “make everyday tasks faster without generating anything new.”
The distinction is based on how the tools operate. While generative AI features create new content, Background Remover and Magic Grab work with existing images. The latter allows users to select an object within an image and reposition it elsewhere in the design.
A second setting allows users to reduce the amount of AI-generated material displayed in Canva’s content library. When enabled, the platform will prioritise human-created templates, graphics, and other design elements in search results.
However, the setting does not guarantee that AI-generated content will be excluded entirely. Canva says that a “small portion” of its library consists of AI-generated material, and designs containing these elements will carry an AI label in their metadata.
Both settings can be accessed through the profile menu. To disable generative AI tools, users should go to Profile, select Settings, open Permissions, and switch off Enable generative AI features. To reduce AI-generated content in search results, they can navigate to Profile, Your Account, and AI Personalization, then enable the option to show less AI content.
It’s no secret that AI has a popularity problem, and Canva appears to be listening to that sentiment. Last month, PetaPixel reported that the company released an image generation model that wasn’t trained on photographs.

It's official: creatives are using AI daily, but most aren't making extra money from it
Envato’s annual creative report shows that while 87% of creatives use AI, most fail to increase earnings because they lack differentiated creative direction.
Deep dive
- Usage Gap: 87% adoption, with over half using AI daily, yet most see no financial uptick.
- Transparency: 53% of users apply AI to client work without disclosing it.
- Skill Re-ranking: Prompting fell to the bottom (19%) of required skills, while taste and judgment rose to the top (53%).
- Revenue Reality: 40% of freelancers raised rates, but success was attributed to speed and reputation rather than specific AI mastery.
- Quality Control: The primary reason AI outputs are discarded is not 'lack of soul' but rather specific errors like broken logos or incorrect brief alignment.
Original article
It's official: creatives are using AI daily, but most aren't making extra money from it
Envato's second annual survey of more than 1,000 creatives finds that AI use has become routine, even if they don't always tell the client. But whether they're using it well remains an open question.
This time last year, many creatives were rushing to adopt AI tools, but nervously. Twelve months later, things have changed a lot. That's according to Beyond the Hype: The State of AI in Creative Work, the second annual report from Envato, the creative asset and AI toolkit owned by Shutterstock.
Based on a survey of 1,033 creatives across 103 countries and territories, the report reveals what creatives are actually doing with AI. And two big things immediately grabbed my attention. Firstly, more than half of AI users have used it on key client work without telling their client. And secondly, while AI may save you time, most creatives aren't seeing that turn into actual money.
To unpack these findings and more, I spoke to Hichame Assi, president of Shutterstock, which includes Envato.
Why ask?
Envato first ran the survey in 2025, and Hichame says the reason was simple. The public conversation about AI didn't match what he was seeing from the working creatives who use Envato. "At face value, the narrative was all hype or doom," he recalls. "Yet in our community, creatives were quietly working AI into client jobs." So last year, Envato asked creatives how they were using it.
One finding from that first survey stayed with Hichame in particular. "Almost half were using AI every day, but only about a third felt really prepared for it. That gap felt worth keeping an eye on, so we came back to see what had changed."
So what has changed in the last 12 months? Well, quite a lot actually. For a start, today 87% of creatives use AI at work at least occasionally, and 58% use it every day.
"AI is now part of the daily routine for most creatives," says Hichame. "Daily use rose from 49% to 58%, and agentic tools, which we didn't even ask about last year, are now used regularly by more than a third of AI users. At the same time, active avoidance has grown from 3% to 8%, so not everyone is on board yet."
But while most creatives are using AI to help them in their work, that doesn't mean that AI is doing their work, at least not all of it.
The survey split people's creative work into six stages, from research and admin to editing. At five of the six stages, "directing [AI] closely" was the most common approach. The percentage of creatives who let AI work "with little input" never went above 11%, and at some stages, it dropped to 4%. As for generating assets, only 7% took a hands-off approach.
The fall of the prompt
For Hichame, the biggest surprise in this year's data concerned the skill that, only a year ago, everyone seemed to agree was essential: prompting.
"Last year, our respondents named prompting as a skills gap and predicted 'prompt engineer' as a new job," he recalls. "This year, though, creatives ranked it last of eight factors, at 19%." Taste and judgement came first, at 53%. Craft came second, at 49%, followed by the strength of the idea, at 39%.
So what's going on? Perhaps this is just a sign that models have got much better at understanding natural language and visual references. Consequently, the time when precise prompts were all-important is long gone.
"The tools are going to keep getting easier and more accessible, so knowing how to use them won't be what sets creatives apart," says Jessica Walsh, founder of New York studio &Walsh and one of the experts interviewed for the report. What will, in her view, is "being able to recognise great work when you see it [which is] not something you can prompt, or learn overnight."
A lack of rules
One thing that surprised me personally is that nearly six in 10 creatives who work in teams say they have no written AI policy. Even in organisations of 250 or more people, four in 10 say they've been given nothing in writing. As Hichame puts it: "The tools moved fast, and the rules didn't. Most are working it out as they go." Which brings us to a thorny question: should creatives disclose whether they've used AI in their work?
In practice, it seems, this has become a matter of personal judgement. More than half of AI users (53%) have used it on key client work without telling the client, and most don't see that as a problem. Only 7% felt uncomfortable staying quiet.
Hichame notes, though, that when there are rules in place, "creatives are more open with clients, with 47% always disclosing AI use, compared with 38% where there's no policy." Age can play a part, too: while only 40% of creatives always tell clients when they've used AI, that rises to 53% among those aged 50 and over.
What humans are for
One of the most commonly cited concerns about AI is that its output is bland and lacks soul. Yet when creatives discard AI-generated concepts, that's rarely the real reason. According to the report, one third (34%) do so because the concepts missed the brief or vision, and a similar number (32%) do so because of errors or low quality, such as garbled logos or glitchy video. Only 5% drop them because they lack feeling or soul.
What's just as interesting is what creatives keep. "The typical creative generates three to five AI concepts and keeps about two," notes Hichame. "Three in four keep half or fewer of their concepts." That, as he sees it, shows how important human creativity remains in the creative process. "Quality control is where humans make the difference," he says. "Knowing what the brief needs, seeing where an output falls short and choosing what makes the cut are judgement calls.
"Generating 10 options is easy," he adds. "Knowing which one is right is the skill, and it's one that creatives build over years."
Where's the money?
Here's another interesting question the report poses: is AI making creatives richer? The answer is: mostly not, or at least not yet.
"Half of creatives who use AI say it makes them faster," says Hichame. "But of those, only one in four report any financial upside. Another one in five earn about the same for less effort. For the rest, they gain time, not money."
This isn't, though, because people are cutting their rates: quite the reverse. "Of the freelancers and agency owners we asked, 40% raised their rates this year and only 6% cut them," he says. More to the point, more than a quarter of AI users (28%) now offer services they couldn't before, and 26% of those whose rates moved credited new services.
The conclusion in Hichame's mind is clear. "Getting better results from AI is the skill creatives most want to learn, at 45%, while creative direction sits near the bottom at 18%," he notes. Yet in the survey, the creatives who have raised their rates credited speed, reputation and creative direction ahead of AI skills. "This suggests people are chasing the skill the market isn't paying for, and ignoring the ones it is."
His advice? "Take the hours AI gives back and put them where clients pay," he says. "That means turning work around faster, investing in your own name and point of view, so your work is recognisable as yours, and sharpening your direction. Because three in four creatives already discard at least half of what AI produces, and that judgement is what sets you apart."
An Encyclopedia Written by a Deliberating Panel of Models (Website)
A new research platform uses a deliberating panel of AI models, employing techniques like blind ledgers and cross-examination to generate encyclopedic content.
Decoder
- Blind ledger: A verification method where models provide answers or critiques without knowledge of the other participants' previous outputs to ensure independent judgment.
Original article
An encyclopedia written by a deliberating panel of models: blind ledgers, cross-examination, lot-drawn juries, and a bias report.

Suno Now Lets You Make AI Videos for Your AI Music
Suno has expanded beyond music generation by launching 'Visuals,' a feature that creates lipsynced, 15-second AI video clips to accompany its tracks.
Deep dive
- Feature Scope: Generates images and video segments up to 15 seconds.
- Integration: Automatically syncs video to lyrics with lipsyncing enabled.
- Model: Uses MiniMax's H3 AI model.
- Platform Availability: Available on web, iOS, and Android.
- Customization: Offers character presets, user-uploaded images, or text-to-image generation.
- Monetization: Requires 'Visuals credits,' distinct from the standard music generation credits.
- Safety: Implements text and visual filters to prevent generation of copyrighted IP and public figure likenesses.
Decoder
- Lipsyncing: The process of synchronizing the visual movement of lips in a video with the audio of a spoken or sung voice.
Original article
Suno now lets you make AI videos for your AI music
The new Visuals feature generates images and 15-second videos that automatically sync with Suno songs.
Suno has introduced image and video generation in its latest effort to expand beyond being an AI music platform. The new feature, called “Visuals,” allows users to turn Suno songs into AI-generated video clips that automatically lipsync to lyrics, or make images via prompt descriptions that can be used as thumbnails and album artwork.
Visuals is available on web, iOS, and Android. The exact layout differs across Suno’s desktop and mobile interfaces, but users will find a new Visuals tab under Create mode on each version. Web users can also access Visuals by selecting the three dot menu on a song in their library. From there, users can select which section of the track to use, up to a maximum of 15 seconds, and select a reference image to build the generated video clip.
There are three options available for the starting image reference: selecting one of the original character presets provided by Suno, uploading your own photo or artwork, or generating the image directly on Suno using descriptive prompts. The image generation capabilities also allow users to select specific aspect ratios, optimizing results for landscape or portrait modes and online platforms.
For video generation, users can select whether the reference image is used as the start or end frame, making it easier to edit the 15-second clips together. There’s a toggle to automatically lipsync vocals to the generated video, and tools for adjusting aspect ratio and clip length. Visuals also includes a dedicated video editing timeline for assembling clips into longer videos, and adding customizable song lyric text.
The H3 Move AI model is being used to power Visuals, based on H3 from MiniMax. Suno says the AI has been “optimized for our community including adding additional protections and safeguards,” which include a “suite of new text and visual filters” designed to block people from using or generating the likeness of specific artists, public figures, copyrighted works and IP. Visuals also uses its own “Visuals credits” to generate videos and images, which are distinct from the song credits used to make AI music, meaning Suno users will have additional expenses to pay in order to use this new feature.
The Visuals launch follows Suno introducing a Speech feature in October for generating spoken words and voiceovers. Adding video capabilities is another attempt to diversify the platform after Suno’s music generator attracted a number of high-profile lawsuits, though it seems some users would rather the company focus on improving those song-generating capabilities. In the YouTube video for the Visuals launch, one user says “FIX AUDIO BEFORE ADDING CRAP NOBODY ASKED FOR” — a sentiment that other commenters are echoing.
Become a founding member of TLDR's AI community (2 minute form)
TLDR is recruiting a private community for AI builders to discuss industry news and tool launches.
Original article
TLDR is launching a curated community for AI builders to discuss major news and launches. The best links and comments will be featured in TLDR AI. Apply here to join.
Just How Big Is ‘Grand Theft Auto VI'? The Multibillion-Dollar Frenzy in Charts
Rockstar Games' Grand Theft Auto VI is poised for a record-breaking launch with $1.65 billion in presales and an estimated $1.4 billion production budget.
Original article
GTA VI is widely expected to be the biggest-ever launch for a video game. Estimates project that more than 30 million copies will be sold by the end of Rockstar Games' fiscal year in March. The game cost an estimated $1.4 billion to make. Presales for the game were at $1.65 billion as of Wednesday. The previous installment has sold nearly 230 million copies and generated $10.78 billion of revenue since its 2013 launch.

Spacecraft reaches Mercury on second-ever mission to enter its orbit
The joint European-Japanese BepiColombo mission has arrived at Mercury to begin an extensive three-year study of the planet's magnetic field and surface composition.
Decoder
- Exosphere: The outermost, extremely thin layer of a planet's atmosphere where gas atoms rarely collide.
Original article
The BepiColombo mission is now preparing to swing into orbit around Mercury. The joint European-Japanese space mission aims to help scientists understand how Mercury formed so close to the Sun, why it has a magnetic field, and what makes up the frozen ice under the planet's permanently shadowed craters. The spacecraft will separate into two orbiters in early December. The orbiters will maneuver to different polar orbits around the planet, and science operations will begin in April next year.
How to Be a 10x Engineer in 2027 and Beyond
True 10x engineering in the AI era comes from identifying impossible business opportunities rather than simply cranking out more code.
Deep dive
- Avoid 'tokenmaxxing'—using AI to produce more code—which often results in burnout and technical debt.
- Define 10x impact as a proportional increase in company value rather than volume of tasks completed.
- Study the business model to identify bottlenecks where software could replace expensive legacy dependencies.
- Use historical precedents (e.g., the transition from physical remotes to smartphone apps) to spot current opportunities created by AI.
- Focus on delivering projects that are deemed 'crazy' or 'impossible' by legacy standards.
Original article
Identify opportunities that were previously too expensive, too difficult, or simply impossible to pursue, and make them happen.
From exposed secrets to managed credentials: Reducing credential risk across the application lifecycle
HashiCorp advocates for shifting away from ad-hoc secret management toward centralized, automated credential lifecycle management using HCP Vault Radar.
Decoder
- Secret: Sensitive data such as API keys, database passwords, or certificates used for authentication.
- Credential rotation: The practice of changing passwords or keys frequently to limit the blast radius if they are compromised.
Original article
HashiCorp argues that exposed secrets need remediation and centralized management with HCP Vault Radar and Vault.
Big Changes to the Adobe Fonts Website
Adobe Fonts has overhauled its website with a unified search interface and an AI tool that suggests typefaces based on mood and visual inspiration.
Decoder
- OpenType features: Advanced typographic capabilities within font files, such as ligatures, stylistic alternates, and tabular figures.
- Variable axes: A technology allowing a single font file to adjust properties like weight, width, or slant continuously along a range rather than using static font files.
Original article
Adobe Fonts' biggest website upgrade in years merges search and browsing into one interface that filters 36,000 fonts by OpenType features and variable axes. A new AI recommendation page suggests fonts matching the mood of uploaded inspiration images, even ones without any text. Family pages now also show glyph maps and illustrated OpenType feature breakdowns.
Your Screenshots, Automatically Named (Website)
Nameshot automates the tedious manual labor of renaming disorganized Mac screenshots with descriptive labels.
Original article
Nameshot gives every new screenshot a proper name, right on your Mac.
Omoi's identity for Eclipse Space looks back to the Apollo program
Design agency Omoi created an identity for Eclipse Space featuring an interactive UI modeled after the Apollo Guidance Computer.
Decoder
- Apollo Guidance Computer (AGC): The iconic flight computer used on the Apollo missions, noted for its unique physical interface buttons and early digital logic.
Original article
Stockholm-based Omoi has developed an identity for satellite infrastructure company Eclipse Space inspired by the optimism, engineering, and visual language of NASA's Apollo program. The system combines a custom Eclipse Space Display typeface, Gorton-inspired interface labels, vibrant space-themed colors, and interactive website buttons modeled on the Apollo Guidance Computer's physical keys. Its distinctive solar corona symbol is generated through a custom tool developed with Claude Code, producing unique variations that follow consistent visual rules and reinforce the company's positioning around independent ownership of satellite networks.

This non-alcoholic aperitif packaging was made with real plants, sunlight, and embossed glass
Creative agency LOVE redesigned Everleaf's packaging using 100% post-consumer recycled glass and traditional cyanotype botanical prints to modernize the non-alcoholic drink brand.
Decoder
- Cyanotype: A photographic printing process that produces a cyan-blue print, created by exposing paper coated in light-sensitive chemicals to the sun.
Original article
LOVE. has refreshed the identity and packaging of non-alcoholic aperitif Everleaf, combining sustainable glassmaking with botanical illustrations created through traditional cyanotype photography. The redesigned bottles use 100% post-consumer recycled glass, weigh 23% less than their predecessors, and feature embossed acacia leaves alongside a refined wordmark. Real plants exposed onto light-sensitive paper produce distinctive illustrations for the Forest, Mountain, and Marine varieties, connecting each product's ingredients to its visual identity.
More Liquid Glass refinements being tested in iOS 27.3 beta
Apple is refining the Liquid Glass interface effect in the latest iOS 27.3 beta to restore softer visual transitions beneath navigation bars.
Original article
Apple is testing a subtler Liquid Glass effect in iOS 27.3 that restores the softer fading of scrolling content beneath navigation bars.

Does NVIDIA Need a New Logo as Well as a New CEO?
Following Jensen Huang's resignation, industry observers are debating whether NVIDIA should finally retire its 20-year-old, polarizing logo.
Decoder
- DLSS: Deep Learning Super Sampling, an NVIDIA-proprietary image upscaling technology that uses AI to increase frame rates in video games.
Original article
After Jensen Huang's resignation, NVIDIA's 2006 logo, with its wonky eye and lime-green palette, looks ripe for a careful evolution that keeps two decades of recognition.
