Devoured - October 07, 2026
Mistral AI has previewed Mistral Large 4, a one-trillion-parameter multimodal model with advanced coding and cybersecurity capabilities, while the industry shifts toward agent-orchestrated development and verified, open-source AI infrastructure. Concurrently, Kubernetes v1.35 and new AI-focused frameworks like OpenClaw are standardizing how organizations manage, secure, and monitor autonomous AI agents at scale.

Mistral Large 4
Mistral AI has previewed Mistral Large 4, a one-trillion-parameter model with advanced coding and cyber capabilities that will be available as open weights.
Deep dive
- 1 trillion total parameters, 52 billion active parameters.
- Multimodal architecture capable of processing images, text, and technical drawings.
- Specialized training for cybersecurity, finance, and engineering verticals.
- 160+ languages supported, emphasizing EU official languages.
- Independent European infrastructure for training and hosting.
- Open-weight release expected by the end of October.
- High performance on coding agent benchmarks like DeepSWE 1.1 and Terminal-Bench 4.
- Advanced reinforcement learning pipeline using 3,000 GPUs to generate 33 billion tokens daily.
- Significant focus on preventing provider-level refusals in security research contexts.
Decoder
- Open-weight: Models where the internal parameters (weights) are released for developers to run on their own hardware, unlike "closed" APIs where access is restricted.
- Agentic workflow: AI systems designed to plan, use tools, and take actions over multiple steps to complete a complex task autonomously.
- Visual grounding: The ability of a model to accurately map linguistic information to specific regions or objects within an image or technical diagram.
- Sovereignty: In an AI context, the ability for an organization or state to control, audit, and run models entirely within their own jurisdiction and infrastructure.
Original article
Le Chonk
Today, we’re launching a public preview of Mistral Large 4. Unofficially ML4, very officially: le Chonk. ML4 pushes the frontier of open-weight performance. You can try the preview API today on Mistral Studio. Weights drop end of this month.
Frontier performance
ML4 is a 1 trillion-parameter natively multimodal model with 52 billion active parameters. It is our largest and most capable model to date, and it continues to improve rapidly as we refine it.
The model demonstrates exceptional performance across coding, agentic workflows, and multimodal understanding. It already achieves performance competitive with the strongest open-source models globally, while significantly outperforming any open-weight model developed in the US or Europe. On critical enterprise workloads, including cybersecurity, finance and law, we find it to be state-of-the-art among open models. In some domains such as visual grounding, it goes further still, surpassing even frontier closed models.
We will release the weights by the end of the month. Until then, we are red-teaming the model in real-world settings with cybersecurity leaders, vetted partners, and state authorities, who will access the same model with reduced moderation and expanded cyber capabilities.
- Coding - DeepSWE
- Coding - Terminal Bench 4.0
- Cyber
- Agentic behaviour
- Finance Agent
- Harvey's Legal Agent
- Grounding
Forged in Europe. Built for AI sovereignty.
ML4 was trained from scratch on 3,800 NVIDIA Grace Blackwell GPUs in Mistral’s own datacenters in Europe. The public preview is served on that same infrastructure. It is a significant milestone in our long-term investment across infrastructure, research, and product development: state-of-the-art performance in critical verticals, delivered through open weights, designed to give customers control over their AI.
This is particularly important in cybersecurity, where provider-level refusals can block legitimate vulnerability research and incident response, and where losing access to a capability mid-incident can itself become a critical security risk. ML4 pairs top-tier cyber performance with open weights and self-deployment, giving organizations both the capability and the autonomy to run advanced security work under their own policies.
The model will be available across multiple regions worldwide, including a European deployment that Mistral operates end-to-end, independently of other digital service providers and under European law. Fun fact: a significant share of ML4’s training data was multilingual, spanning more than 160 languages, including every official language of the European Union.
We’ve been working closely with leading enterprises across the world in finance, engineering, manufacturing, logistics, pharmaceuticals, science, shipping, public sector, and other mission-critical industries to train ML4. In fact, the model uses the same training, customization, and RL environment we offer our customers through Mistral Forge.
Try it today
There is still more to come. As we work toward releasing the weights, we will share further details on the model architecture, additional benchmarks, and our post-training methodology.
This model will also serve as the foundation for a new generation of specialized and optimized Mistral models. In the meantime, we invite you to try the preview API and share your feedback with us on social media.
Capabilities deep-dive
Cybersecurity
ML4 is one of the world's strongest AI models for cybersecurity. On the Artificial Analysis Cyber Index, an independent evaluation of how well AI models find and fix security flaws in real software, it ranks among the top five models globally and leads open-weight models developed outside China by a wide margin. On one of the index's tests, which asks a model to reproduce a real vulnerability in open-source software and then patch it, ML4 scores 82%, the highest of any model. It also solves 93% of the challenges in Cybench, a set of 40 exercises drawn from security competitions, one of the highest scores reported for an open-weight model.
That top score reflects a practical advantage. Several leading closed models, including Claude Opus 5.5 and GPT-6 Astra, score near zero on the same test because they refuse to perform the task. Yet defending software often starts with proving that a flaw is real, exactly the kind of work safety filters in closed models can block. This matters even more as threat actors increasingly jailbreak those same models to support offensive cyber activity: defenders need systems that can match those capabilities without being constrained by the same refusals. ML4 can do that work, and its capabilities extend beyond what it was explicitly trained for: in internal testing, it proved useful for analysing malware, prioritising vulnerabilities, and writing detection rules. For organisations that need sovereign, auditable AI for security operations, it will be able to run on private cloud or on-premise.
- AA Cyber Index
- CyberGym-E2E
- Cybench
Agentic coding
ML4 excels across software engineering, repository understanding, and complex terminal workflows, scoring 61.7% on DeepSWE v1.1, 59.4% on SWE-Atlas-QnA, and 28.3% on Terminal-Bench 4. Its combined Coding Agent Index score of 49.8% places it ahead of DeepSeek V4 Pro 0813 and Qwen3.8 Max.
- DeepSWE 1.1
- Terminal Bench 4.0
- SWE Atlas QnA
We also ran a blind human evaluation with Surge AI on coding quality: professional annotators rated model outputs on a 1–5 scale, with model identities hidden. ML4 Preview ranked second of five models (3.74), ahead of Kimi K3 (3.59), GLM-5.3 (3.60) and GLM-5.2 (3.40), and behind only Claude Opus 5 (4.22).
Agentic Workflows
ML4 runs general-purpose agents that gather information, use tools, and produce finished deliverables across complex workflows. On AutomationBench — 657 business workflows across apps like Gmail, Google Sheets, Slack, and Salesforce — it scores 59.9%, ahead of Kimi K3, MiMo-V2.6-Pro, and DeepSeek V4 Pro.
It's just as strong on the professional deliverables that knowledge work actually produces: spreadsheets, slides, and PDFs. On AA-Briefcase, which evaluates long-horizon knowledge work, it reaches 1,393 Elo, ahead of DeepSeek V4 Pro.
- AA - AutomationBench
- AA-Briefcase
Multimodal
ML4 is a step change in the ability of our models to understand images. It reasons powerfully across complex documents, charts, and natural images, and brings vision to the industries where perception is critical such as engineering, manufacturing, and earth observation.
The model can further combine visual grounding with agentic capabilities: from inspecting gigapixel satellite imagery — helping disaster-response teams act when time counts — to analyzing engineering-drawings — zooming in, inspecting, and verifying until the answer is exact. In our demos above, ML4 grounds dense natural scenes, verifies mechanical parts in technical drawings, retrieves evidence from PDFs, and scans massive geospatial images for the hardest-to-find objects.
On visual grounding particularly, we find ML4 to be one of the most capable models we tested, for instance surpassing GPT-6-Astra on Dense 200 (42% vs 41%).
- Dense 200
- ChartQA Pro
- GDP.pdf
Science and Math
ML4 brings strong scientific capabilities, built by combining AI-driven methods with our researchers' expertise in mathematics, physics, and chemistry.
It's highly proficient at agentic coding for scientific tasks such as data analysis, modeling, and simulating physical reality, which lets researchers focus on the questions rather than the plumbing. In benchmarks, ML4 is state of the art on SciCode-Verified among open-weight models. In practice, it can generate a full Hartree–Fock simulation in one shot — a complex, multi-step chemistry task built from a series of advanced routines.
ML4's math is stronger too, in both formal reasoning and applied mathematics. In our human evaluations it reasons more precisely and with more structure than GLM-5.3, and it can sustain long, domain-specific applied-mathematics tasks, including work relevant to frontier theoretical physics.
Together, these capabilities make ML4 a strong research assistant across the full technical workflow — from the first question to the final result.
Knowledge Work
ML4 is our most capable model for the real-world tasks which professionals handle every day. It can create, edit and fix complex spreadsheets and documents, showing exemplary performance on both legal and financial benchmarks.
Notably, we evaluated ML4 through third party evaluators (vals.ai) on representative tasks for both legal and financial tasks, finding the model exceeds GPT-6-Astra in both cases. On HarveyAI’s Legal Agent benchmark, ML4 outperforms all open-source models.
- Finance Agent v2
- Finch (FinWorkBench)
- Harvey's Legal Agent Benchmark
Financial analysis demands precision and the ability to synthesize information from multiple sources, a process that remains time-consuming at many financial institutions today. In this demo, ML4 compared to other top OSS models take on the same multistep corporate finance challenge, searching through public company filings and financial reports, such as those available via EDGAR and equivalent European databases. An animated semantic map traces each model's journey toward a solution, highlighting every document retrieved along the way. Each track's position reflects the evidence gathered, the results of calculations, and the questions that remain unresolved. Viewers can follow how the investigations unfold and compare the distinct paths each model takes before arriving at its final answer.
Model Safety
- B3 Attack Resistance
- Cyber Refusal Rate
- KORABench
ML4 has saturated our benchmarks on robustness to indirect prompt injections, putting it at the frontier of OSS models (compared to GLM-5.2, GLM-5.3, Kimi-K2.6, Kimi-K3, DS-V4-Pro-0813). On Lakera’s public B3 AI Security Benchmark, ML4 resists 93.3% of attacks – we see no higher scores among competitors.
ML4 also engages more responsibly with users than any of our previous models. We highlight our results on the KORA Benchmark, where ML4 again sits at our highest measured score among OSS models (1.691, with 2 being the maximum denoted as “Exemplary”).
Of particular relevance is the model’s propensity to refuse malicious requests regarding cybersecurity. Despite strong performance on Cyber benchmarks, the average refusal rate of the model on cyber prompts from JailbreakBench, StrongREJECT, and AgentHarm is higher than all OSS models.
Human Evaluation
We ran an internal evaluation in which expert annotators across coding, computer-aided design (CAD), finance, mathematics and physics compared Mistral Large 4 with GLM-5.3. ML4 was preferred in CAD and STEM, while performing on par or close to GLM-5.3 in finance and coding.
Reinforcement learning at scale
Base models are improving fast, and our post-training has to keep pace. A recipe tuned for yesterday's model leaves capability on the table with today's frontier, because ground truth samples that once pushed a model to its limits won’t anymore. We use Reinforcement Learning (RL) because it adapts as the model does: we train on the outcomes of the model's own attempts, and we can raise the difficulty and the breadth of the tasks as it gets stronger.
Our RL library was designed to make new environments easy to add and train at scale. A shared, composable interface allows a single training run to combine tasks ranging from single-turn chat and complex scientific problem solving to safety alignment, factuality, and long-horizon tool use. These environments share scaffolds and resources such as code sandboxes, web search, and external APIs. The same composability extends to verification, with reward models, unit tests, LLM judges, and static checks combined as needed for each task.
At runtime, an autoscaling fleet of actors generates tens of thousands of rollouts in parallel while model training proceeds asynchronously. The generation and training pipeline is optimized for long trajectories, supporting rollout budgets of millions of tokens across multiple compactions while keeping staleness low. Novel methods and optimizations across both stages minimize off-policy drift and enable stable RL over long horizons.
At our current scale (3k GPUs), a single training run produces roughly 33 billion tokens per day, of which around 16 billion are trainable completion tokens after filtering and masking. We can see the run progress directly in the training rollouts: training rewards rise across several representative environments as the policy learns to solve increasingly complex tasks.
What comes next
This is only the beginning. ML4 is the first milestone on the roadmap funded by our €3 billion Series D — the largest equity round ever raised by a European technology company. That capital is already being put to work: we are significantly scaling up our compute capacity in our own European datacenters, and much more is coming online in the months ahead.
More compute means more training. The reinforcement learning run behind this preview is still in flight, and the model is showing no signs of saturation — there is substantial headroom ahead. As we scale up training on our expanded infrastructure, we expect large and rapid improvements in the weeks and months to come.
We will release the weights by the end of the month, along with more details on the architecture, additional benchmarks, and our post-training methodology. And ML4 is only the foundation: it will serve as the base for a new generation of specialized and optimized Mistral models, built for the industries and workloads our customers care about most.
The pace of progress from here will be fast. Stay tuned.
US-China AI Gap Hits 3%, and DeepSeek V4.1 Flash Now Leads on Agentic Coding Benchmarks
DeepSeek V4.1 Flash has narrowed the US-China AI gap to 3% while leading in agentic coding, sparking concerns over legal data access requirements.
Deep dive
- DeepSeek V4.1 Flash uses a 748B MoE architecture (552B backbone, 196B Engram memory) activated sparsely for efficiency.
- Costs $0.30/1M input and $1.20/1M output tokens at peak; reduces KV cache and SSD storage requirements.
- Supports 1M context window and 384k output tokens with native multimodal capabilities.
- Bloomberg Intelligence reports a 3% performance gap between DeepSeek and US frontier models as of Oct 2026.
- NIST CAISI previously found an 8-month development gap using a different, pre-committed benchmark methodology.
- DeepSeek remains primarily research-focused; US labs lead in enterprise ecosystem, tooling, and documentation.
- Huawei Ascend 950 processors are effectively running frontier-grade Chinese models, undermining US semiconductor export control objectives.
Decoder
- Agentic coding: The ability of an AI model to autonomously plan, write, execute, debug, and iterate on complex software tasks without human intervention.
- Mixture of Experts (MoE): A model architecture where only a subset of total parameters is activated per token, significantly reducing compute costs for inference.
- Engram parameters: A specific memory component designed for persistent information retention within the model architecture.
- KV cache: A memory buffer used to store previous key-value pairs in transformer models to accelerate token generation.
- Distillation: A process where a smaller model is trained to mimic the output of a larger, 'teacher' model.
Original article

A Chinese AI model now outperforms the American leader at the task enterprises care most about — writing, reasoning through, and debugging software autonomously — and the gap between the two countries' best models has narrowed to its smallest margin on record. But the benchmark lead comes with a legal condition baked into Chinese law that no privacy policy can override: any code, prompt, or data routed through DeepSeek's API is subject to disclosure to the Chinese government on demand.
That is the decision facing enterprise AI developers this week after Bloomberg Intelligence senior analyst Robert Lea published a note documenting a record-low 3% performance gap between China's and America's top AI models, driven by DeepSeek's September release of V4.1 Flash. The gap had stood at approximately 9% in May 2026 and roughly 15% earlier in the year. On agentic coding — the sub-benchmark that most directly predicts commercial value in software automation — DeepSeek's score of 77.3 surpassed Anthropic's leading model at 66.1, according to the October 4 LiveBench snapshot that Lea cited in his analysis.
DeepSeek V4.1 Flash Now Beats Anthropic at the AI Task Most Worth Paying For
Agentic coding is not a niche benchmark. It measures what enterprises are actually spending AI budgets on: a model's ability to plan a complex software task, write the required code, run it in a real environment, read the error output, and fix the problem — repeatedly, without human intervention at each step. DeepSeek V4.1 Flash scored 77.3 on this dimension of the LiveBench leaderboard; Anthropic's Claude Fable 5.1 Max Effort scored 66.1. On the overall LiveBench composite, DeepSeek scored 81.1 against Anthropic's 83.4 — a 2.3-point difference that rounds to approximately 3% of Anthropic's score.
DeepSeek's own technical report for V4.1 Flash claims the model scores 74.2% on DeepSWE v1.1, a rigorous agentic coding benchmark, edging Anthropic's Opus 5 at 74.0% and OpenAI's GPT-5.6 Sol at 73.0%. These are the company's figures, and the caveat matters: benchmark results self-reported by a model's developer carry a well-documented risk of optimization for test performance over genuine capability. Independent third-party validation of the V4.1 Flash agentic coding scores specifically has not been published as of this writing.
Still, the overall picture is striking. For most of 2026, analysts treated Chinese AI as catching up on aggregate but trailing on the specific benchmarks that generate enterprise revenue. That characterization requires revision on agentic coding as of October 2026.
How the Architecture Makes Low Prices Possible
DeepSeek V4.1 Flash uses a Mixture of Experts (MoE) architecture with 748 billion total parameters — including a 552 billion core backbone and 196 billion Engram parameters, a new persistent memory component introduced in this model generation — but only a sparse subset of those parameters is activated for each token during inference. This is the engineering reason the model can be priced at lower rates than launch: $0.30 per million input tokens and $1.20 per million output tokens at peak, with the computational load at inference corresponding to a far smaller model than the total parameter count suggests. Off-peak pricing runs at half those rates.
The model also reduced its KV cache requirement to approximately one-quarter of the prior generation's high-bandwidth memory (HBM) demand and one-eighth its SSD storage requirement. This reduces the hardware cost of serving the model at scale, reinforcing the pricing advantage.
V4.1 Flash supports a context window of up to 1 million tokens, with output lengths up to 384,000 tokens — specifications that compete with the widest-context US models available — and adds native multimodal capability (image understanding) that its predecessor lacked.
Where Benchmarks Tell Different Stories
Not every measurement framework agrees on how close the race is, and enterprises relying on any single benchmark to make adoption decisions should understand why.
LiveBench — the platform Lea used — is specifically designed to resist benchmark contamination, the well-documented problem of test questions leaking into a model's training data and artificially inflating its scores. LiveBench refreshes its question set monthly from recent math competitions, arXiv papers, and news articles, using objectively scorable answers rather than subjective AI judges. An independent September 2026 review rated LiveBench among the six most trustworthy benchmarks in the field — but also flagged it as "medium" on real-world gap, meaning the benchmark's academic task mix may not perfectly reflect production performance on enterprise code.
NIST's Center for AI Standards and Innovation (CAISI) reached a different conclusion using a different model and methodology. In CAISI's May 2026 evaluation of DeepSeek V4 Pro — the predecessor to V4.1 Flash — the agency applied nine pre-committed benchmarks across five domains and concluded the US-China gap was approximately eight months of development time, not a low single-digit percentage. CAISI used pre-committed methodology specifically designed to resist gaming. The discrepancy between CAISI's eight-month finding and Bloomberg Intelligence's 3% LiveBench figure reflects a genuine measurement problem: the two analyses evaluated different models at different moments and used different methodologies. Neither is wrong; they are measuring different things.
The practical upshot for enterprise buyers: a benchmark gap of 3% on a composite leaderboard does not mean model parity on any specific task a real company would actually run. The agentic coding sub-benchmark lead is the most commercially significant finding in the data. Its reliability is higher than composite scores but not immune to gaming.
What China's National Intelligence Law Means for Every API Call
DeepSeek is a Chinese company headquartered in Hangzhou. That is not a footnote. Article 7 of China's National Intelligence Law (2017) requires that "all organizations and citizens shall support, assist, and cooperate with national intelligence work in accordance with the law." The law gives the government access to data held by Chinese companies without requiring any public disclosure of the request. The Cybersecurity Law (2017) and Data Security Law (2021) establish additional government data-access mechanisms and data localization requirements.
DeepSeek's privacy policy does not override these obligations. No privacy policy issued by a Chinese company can legally supersede a government intelligence request under Chinese law.
When an enterprise developer sends code, business logic, or proprietary prompts to DeepSeek's API, that data enters infrastructure operated by a company subject to these laws. The data categories DeepSeek collects — including chat content, API inputs, and usage patterns — are the categories most likely to contain sensitive intellectual property and business information.
The structural legal risk is compounded by a documented operational security gap. In early 2025, security researchers at Wiz found a DeepSeek database exposed without authentication, containing user chat histories and API keys, with no authentication required. DeepSeek is both legally obligated to share data with Chinese authorities and has previously demonstrated inadequate security practices. No independent third-party security audit of V4.1 Flash's data handling has been published as of this writing.
The US government reached its own conclusion before the benchmark data arrived. Multiple federal agencies — including the US Navy, NASA, and the Department of Commerce — banned DeepSeek on government-issued devices in early 2025, citing security and privacy concerns. Bipartisan legislation was introduced in Congress to formalize the ban across all federal government devices. Taiwan banned government departments from using DeepSeek as well.
What enterprise users can do: DeepSeek V4.1 Flash is open-weight, meaning companies can download the model weights and run the model on their own private infrastructure rather than using DeepSeek's API. Self-hosting eliminates the direct API data transmission risk. It does not resolve questions about the training data's provenance or potential intellectual property claims from distillation-based training methods. For teams without the infrastructure to self-host a 748-billion-parameter MoE model, the API's legal exposure is a structural condition, not a configurable risk.
Where DeepSeek Still Trails
Benchmark parity in aggregate or leadership in one sub-category does not describe the full competitive picture.
Only three of the fifteen models on the October 4 LiveBench top tier are Chinese, meaning the gains remain concentrated at the frontier rather than distributed across the field. American and European labs still hold the majority of the upper leaderboard positions in aggregate.
Enterprise integration is a second gap. DeepSeek's API ecosystem, tooling, documentation, and enterprise support infrastructure are substantially less mature than those of Anthropic, OpenAI, or Google. International enterprises report friction in access, support response, and compatibility with existing cloud-native AI toolchains. These hidden operational costs are not captured in a benchmark score.
Profitability is a third. Bloomberg Intelligence's Lea forecasts that China's AI industry, including DeepSeek, could remain unprofitable until 2030. The Chinese AI market contains more than 1,100 competing large language models. DeepSeek and Tencent's leading AI chatbots remain free to end users. "Putting China's AI sector on a sustainable profit footing will require a cooling of competitive pressures, an industry shakeout, and a more rational approach to pricing," Lea said. ByteDance's Doubao leads Chinese AI apps in monetization; DeepSeek remains primarily positioned as infrastructure and research infrastructure, not a commercialized application layer.
Export Controls Failed to Create the Gap They Were Designed to Protect
The 3% convergence figure arrives as US chip export controls on advanced AI semiconductors face mounting scrutiny over their effectiveness. The controls were premised on the assumption that restricting Chinese access to Nvidia's highest-end chips would preserve a durable hardware advantage for American AI labs. DeepSeek's trajectory complicates that argument.
DeepSeek V4 Flash was adapted for Huawei's Ascend 950 processors — a domestic Chinese chip that, while less capable than Nvidia's highest-end hardware, proved sufficient to run a competitive frontier model. After the April 2026 V4 launch, ByteDance, Tencent, and Alibaba reportedly scrambled to secure Ascend 950 orders from Huawei, suggesting the chip's credibility as an AI platform had been meaningfully validated.
China's AI chip self-sufficiency rose from below 10% in 2020 to 41% by 2025, according to semiconductor research firm Omdia, while Nvidia's share of China's AI accelerator market declined substantially over the same period. The US investment differential is stark — the Stanford AI Index 2026 recorded US private AI investment at $285.9 billion in 2025, compared to $12.4 billion in China — but the gap in model performance has not moved proportionally to the gap in investment.
Decision Framework for Enterprise AI Teams
An enterprise AI team evaluating DeepSeek V4.1 Flash for a software engineering workload in October 2026 faces a four-part decision, not a one-part benchmark comparison:
Performance: V4.1 Flash is the measured leader on agentic coding as of October 4. This is the highest-value AI task for software teams and its score on that benchmark exceeds current Anthropic and OpenAI offerings in publicly available data. The lead is real, verified by independent analysts, and likely to translate into production value for high-volume inference workloads.
Reliability: The benchmark lead is from a contamination-limited platform but still carries a medium real-world gap caveat. NIST's methodology, applied to the prior model generation, found a larger gap. Production performance in a specific enterprise codebase may diverge from any benchmark. Third-party production evaluations are not yet publicly available for V4.1 Flash.
Legal: Deploying DeepSeek's API connects enterprise code to infrastructure subject to China's National Intelligence Law. This is not a risk to be weighed — it is a fixed legal condition that applies regardless of DeepSeek's stated privacy policy. Self-hosting eliminates API exposure; it requires significant infrastructure investment and does not resolve all provenance questions.
Ecosystem: DeepSeek's enterprise tooling, support, and integration ecosystem is less mature than US alternatives. Operational costs not captured in the benchmark include integration time, documentation gaps, and support accessibility.
The benchmark performance advantage is real and significant. Adopting it without accounting for the legal framework is not a technology decision — it is also a data governance and national security one.
Frequently Asked Questions
Does DeepSeek actually beat US AI on software coding tasks?
On the October 4 LiveBench agentic coding sub-benchmark, DeepSeek V4.1 Flash Max Effort scored 77.3, compared to 66.1 for Anthropic's Claude Fable 5.1 Max Effort, and DeepSeek's own technical report claims a 74.2% rate on the DeepSWE v1.1 benchmark, edging Anthropic and OpenAI. These results represent the available benchmark evidence as of October 2026. Neither has been validated by a fully independent third-party audit under the same conditions. The agentic coding lead is the most credible specific finding in the data, but benchmark performance and production performance in a specific codebase are not the same thing.
Can the Chinese government access data sent to DeepSeek's API?
China's National Intelligence Law (2017) legally requires all Chinese companies to cooperate with government intelligence requests, including providing data access, without the ability to refuse or disclose the request publicly. DeepSeek is a Chinese company. Its privacy policy does not override this legal obligation. Any data sent to DeepSeek's API — including code, business prompts, and proprietary logic — is subject to this framework. Enterprises that need to use DeepSeek's model capabilities while managing this risk can self-host the open-weight model on private infrastructure instead of using the API.
How does DeepSeek V4.1 Flash achieve lower prices than US models?
The model uses Mixture of Experts (MoE) architecture: despite having 748 billion total parameters, only a fraction of those are active during any single inference pass. This reduces the computational cost per token relative to dense models of comparable capability. V4.1 Flash also cut its memory cache requirements significantly from prior generations. The result is a pricing structure of $0.30 per million input tokens and $1.20 per million output tokens at peak rates, substantially below comparable US frontier models. Off-peak pricing runs at half those rates.
Why do different analyses give different answers about the US-China AI gap?
Because they measure different things. Bloomberg Intelligence compared the top Chinese model (DeepSeek V4.1 Flash) to the top American model (Anthropic Claude Fable 5.1) on a single October 4 snapshot of LiveBench, a composite benchmark. NIST CAISI evaluated DeepSeek V4 Pro against US frontier models on a pre-committed nine-benchmark suite in May 2026, using methodology specifically designed to prevent gaming, and found an eight-month development gap. Different models, different time points, different methodologies. The real answer depends on what specific task an enterprise is evaluating and which measurement framework it trusts.
The state of the tech industry in 2026
The nature of software engineering has fundamentally shifted toward agent-orchestration, with most productive engineers now running multiple parallel AI agents instead of manual coding.
Deep dive
- Code is now generated exponentially, making manual code reviews theatrical and ineffective.
- Developers are increasingly moving development into Slack-integrated agent workflows.
- Migrations that previously took years are being completed in weeks using AI.
- Quality and reliability are currently struggling as the industry transitions to new infrastructure.
- Engineering teams are consolidating around AI-positive talent with deep domain knowledge.
- Organizations are building internal 'agentic software factories' to automate CI/CD and deployment.
Decoder
- Agentic Software Factory: A system where AI agents manage the entire software development lifecycle, from writing and testing code to deployment and monitoring.
- Tracer Bullet: A development approach that builds a thin, end-to-end slice of functionality to prove the architecture works before scaling.
- Harness: A platform or framework designed to orchestrate and evaluate multiple AI agents working on complex tasks.
Original article
Full article content is not available for inline reading.

Shipping JPEG XL in Chrome
Chrome 155 adds support for JPEG XL, implemented in memory-safe Rust to deliver high-fidelity compression without traditional C++ vulnerabilities.
Deep dive
- The jxl-rs implementation uses the 'target_feature' Rust feature to stabilize SIMD performance.
- Safety is achieved by restricting unsafe operations to a small, heavily-vetted set of modules.
- JPEG XL supports lossless transcoding of existing JPEGs, preserving metadata and reducing size.
- The decision to ship was heavily driven by the 'Interop 2026' process and developer feedback.
Decoder
- SIMD (Single Instruction, Multiple Data): A CPU instruction type that allows a processor to perform the same operation on multiple data points simultaneously, significantly increasing image processing speed.
- JPEG XL (.jxl): A modern image codec supporting both lossy and lossless compression, HDR, and efficient progressive decoding.
Original article
Shipping JPEG XL in Chrome
We're excited to announce that Chrome is shipping decoding support for the JPEG XL (.jxl) image format starting from Chrome 155. JPEG XL is a next-generation image format designed to meet the needs of modern web developers and photographers. It offers 30-50% better compression than JPEG, lossless compression, built-in HDR support, lossless JPEG transcoding, and more.
In general, we recommend trying both AVIF and JPEG XL to get the best results. We expect that JPEG XL is most helpful for high-fidelity or lossless compression, especially of photographic images or in cases in which fine-grained progressive decoding is preferred.
In this post, we share why we brought JPEG XL to Chrome, how we used Rust to ensure memory safety first, the extensive performance work that makes it fast, and what the journey tells us about developer feedback and the web standards ecosystem.
Safety first: Reimplementing the decoder in Rust (jxl-rs)
Image decoders are one of the most critical and targeted attack surfaces in any modern web browser. They process complex, untrusted binary structures directly from the network and run inside the renderer process. Historically, decoders written in memory-unsafe languages like C++ have been prone to vulnerabilities such as out-of-bounds reads, heap overflows, and use-after-free bugs.
Our security model relies on sandboxing and defense-in-depth, guided by the rule of two. However, sandboxing is a secondary layer of defense. To eliminate these security risks at the source, we have integrated jxl-rs, a pure Rust implementation of the JPEG XL decoder.
Design for speed, without compromising safety
Memory safety is crucial, but a memory-safe decoder that is approximately as fast as the best non-memory-safe alternative is a much more obvious choice than a choice with a significant performance compromise.
A fundamental part of the performance of modern codecs is making full use of the SIMD hardware available on modern devices. To do so safely, target_feature_11 Rust feature had to be stabilized, which allowed the use of SIMD instructions without requiring unsafe code.
The next step was to build a SIMD abstraction layer (jxl_simd), inspired by the C++ Highway library (itself originally developed for libjxl, the C++ reference implementation of JPEG XL). Together, those developments allowed writing a multi-platform library that doesn't compromise on SIMD performance optimizations, while restricting unsafe operations to a small number of highly-vetted locations.
Performance optimizations in jxl-rs build on those in libjxl. This includes a generic processing pipeline for steps crossing region borders, while minimizing data copies to maximize hardware performance. We've been tracking the performance of the Rust reimplementation across different hardware platforms on the jxl-rs performance dashboard.
We verified the jxl-rs implementation with various state-of-the-art techniques, including fuzzing and AI review of the code, and have not found any memory safety bugs throughout the entire implementation history, providing yet another validation of the huge improvements that Rust brings to memory safety.
Developer feedback and the Interop Project
The Chrome team considers web developer feedback from a wide range of channels, such as bugs, surveys, the Developer Signals Project, and the Interop Project. Our decision to ship JPEG XL was based on consistent feedback and requests from web developers, most visible in the Interop Process, where it was a popular proposal in 2026 and several years prior.
To ensure the format is interoperable across browsers, we have participated in the Interop 2026 JPEG XL Investigation to ensure there is test coverage for all of JPEG XL's features in browsers, and that those tests pass in Chrome.
Try it out
With JPEG XL officially landing in Chrome, the web becomes faster, richer, and safer. We encourage developers, content creators, and platform owners to start using .jxl images and animations in their pipelines.
Try it out, file bugs, and help us continue building a faster and safer web for everyone.
Acknowledgements
We'd like to thank all the people who contributed to jxl-rs or its integration in Chrome, and especially Helmut Januschka for the substantial contributions both to the Chrome integration and jxl-rs, and Martin Bruse, Zoltan Szabadka, Sami Boukortt and Wonwoo Choi for their substantial contributions to jxl-rs itself.

The keys to the Internet change on October 11. Are you ready?
The Internet's DNS root key is rolling over on October 11, 2026; most systems will update automatically, but manual checks are recommended.
Deep dive
- The KSK-2024 key has been published in the DNSKEY set since January 11, 2025, to allow for automatic discovery.
- Cloudflare's 1.1.1.1 and Gateway systems are already fully prepared.
- The rollover maintains the RSA/SHA-256 algorithm; algorithm changes are planned for future updates.
- The 'sentinel' protocol (RFC 8509) allows resolvers to report whether they trust specific root keys via special DNS queries.
Decoder
- DNSSEC: A suite of extensions to DNS that provides cryptographic authentication of data, preventing spoofing and cache poisoning.
- Trust Anchor: A trusted public key that serves as the root of the chain of trust in DNSSEC validation.
- KSK Rollover: The administrative process of replacing the DNS root's Key-Signing Key with a new one.
Original article
On October 11, 2026, the DNS root is scheduled to change its key-signing key (KSK) for only the second time ever. This key anchors DNSSEC’s chain of trust, which lets DNS resolvers authenticate answers using cryptographic signatures. The change is called a KSK rollover. Validating resolvers need to trust the new key before the switch, as otherwise healthy websites could become unreachable.
When we wrote about the first root KSK rollover in 2018, we had seen resolvers lose their learned trust in the new key during software upgrades or moves between machines. Publishing the key well in advance was only part of the job. We also needed to know whether resolvers had retained it, and we couldn’t give users a practical way to check.
Most website operators do not need to make any changes for this rollover. If you run a DNSSEC-validating resolver, check that it trusts the new root key, KSK-2024, and follow your software vendor’s instructions to update its trust anchors if the key is missing. If you use Cloudflare for your domain's DNS or rely on 1.1.1.1 and Gateway DNS, you do not need to take any action — our systems already trust KSK-2024.
To check ahead of time, visit our rollover readiness test. It asks the resolver your browser uses whether it trusts the new key. The test uses RFC 8509: A Root Key Trust Anchor Sentinel for DNSSEC, which we’ve implemented in 1.1.1.1 ahead of the rollover.
Where DNSSEC trust begins
A DNS resolver looks up the addresses of websites and other services for your device. DNSSEC lets it check digital signatures on DNS records to verify that they are authentic and have not been changed. The resolver also needs to check that the public keys used to verify those signatures belong to the right domains.
For cloudflare.com, this follows a chain of trust from the DNS root to .com, then to cloudflare.com. Each parent publishes a Delegation Signer (DS) record containing a fingerprint of its child’s public key. For example, .com publishes the DS record for cloudflare.com, allowing the resolver to check that domain’s key.
That chain needs a starting point. The root, however, has no parent to confirm which keys belong to it. Instead, a resolver checking DNSSEC starts with a root public key, or its fingerprint, that it already trusts. This is called a trust anchor.
The root’s signing keys have two different jobs. The zone-signing key (ZSK) signs the root’s DNS records, including the DS records for top-level domains such as .com. The key-signing key (KSK) signs the list of public keys published by the root, called the DNSKEY record set. The resolver uses its trusted KSK to verify that list, then uses the ZSK from the list to verify the root’s other records.
The diagram below shows the arrangement for a typical signed zone. For the root, trust comes from the resolver’s trust anchor rather than a DS record in a parent zone.
Our posts about the .de and the .al rollover failures showed the consequence of failed DNSSEC checks: websites can be working normally but still be unreachable. The root KSK rollover changes the starting point of those checks. If a resolver does not trust the replacement key, its users may be unable to reach websites under any top-level domain.
The new key is KSK-2024, identified by key tag 38696. It will replace KSK-2017, key tag 20326, as the signer of the root’s DNSKEY set. Validating resolvers need to trust the new key before that switch.
How resolvers get the new root key
RFC 5011 lets resolvers learn a new root trust anchor automatically. The root publishes the new KSK alongside the existing one in its DNSKEY set. The existing KSK continues signing that set, so a resolver can use the key it already trusts to verify the records containing the replacement.
Before accepting the new key as a trust anchor, the resolver waits at least 30 days and keeps checking the root’s signed DNSKEY records. The new key must remain in the records it checks during that period. After the wait, the resolver must successfully verify the records containing the new key again before accepting it.
For this rollover, KSK-2024 has been published in the root’s DNSKEY set since January 11, 2025. That gave resolvers with automatic trust-anchor updates time to discover and accept it ahead of the scheduled October 11, 2026 signing change. Each resolver’s waiting period starts when it first sees and verifies the new key.
For our resolver, we added KSK-2024 directly to the software’s built-in trust anchors in July 2024, alongside KSK-2017. A resolver running the updated software therefore has the new anchor available from startup.
We chose this approach because of our experience during preparations for the first rollover. As described in our 2018 post, software upgrades and moves between machines caused some resolvers to lose their learned trust-anchor state. We fixed that by updating the software to include the new anchor by default. Including KSK-2024 in the software likewise avoids depending on each resolver retaining a key it learned automatically.
Even though we added KSK-2024 to our resolver’s built-in trust anchors in July 2024, users of 1.1.1.1 and Gateway DNS had no direct way to check whether the resolver answering their queries trusted the new key.
This time, ask the resolver
RFC 8509 defines the root key trust anchor sentinel, a way to ask a supporting resolver whether it trusts a particular root key. It uses ordinary DNS queries with specially named domains.
Our readiness test website uses this protocol to check for KSK-2024. Two names ask opposite questions: is-ta-38696 asks whether the key is trusted, not-ta-38696 asks whether it is not trusted.
Both names have valid DNSSEC-signed address records. A resolver that supports the sentinel first validates those records, then either returns the response directly or replaces the answer with SERVFAIL, depending on whether it trusts the key.
For a validating resolver with sentinel support, the expected results are:
|
Query |
KSK-2024 is trusted |
KSK-2024 is not trusted |
|
|
Returns a valid response |
Returns |
|
|
Returns |
Returns a valid response |
For a validating resolver with sentinel support, SERVFAIL for not-ta-38696 is expected when KSK-2024 is trusted. The resolver deliberately rejects the “not trusted” query.
Sentinel labels such as root-key-sentinel-is-ta-38696 can be used under any DNSSEC-signed domain. We use dnstest.dev for our tests. You can run the two queries directly against 1.1.1.1:
$ dig @1.1.1.1 root-key-sentinel-is-ta-38696.dnstest.dev. A +noall +comments +answer

; <<>> DiG 9.10.6 <<>> @1.1.1.1 root-key-sentinel-is-ta-38696.dnstest.dev. A +noall +comments +answer
; (1 server found)
;; global options: +cmd
;; Got answer:
;; ->>HEADER<<- opcode: QUERY, status: NOERROR, id: 44476
;; flags: qr rd ra ad; QUERY: 1, ANSWER: 2, AUTHORITY: 0, ADDITIONAL: 1

;; OPT PSEUDOSECTION:
; EDNS: version: 0, flags:; udp: 1232
;; ANSWER SECTION:
root-key-sentinel-is-ta-38696.dnstest.dev. 300 IN A 104.18.6.197
root-key-sentinel-is-ta-38696.dnstest.dev. 300 IN A 104.18.7.197

$ dig @1.1.1.1 root-key-sentinel-not-ta-38696.dnstest.dev. A +noall +comments +answer

; <<>> DiG 9.10.6 <<>> @1.1.1.1 root-key-sentinel-not-ta-38696.dnstest.dev. A +noall +comments +answer
; (1 server found)
;; global options: +cmd
;; Got answer:
;; ->>HEADER<<- opcode: QUERY, status: SERVFAIL, id: 3285
;; flags: qr rd ra; QUERY: 1, ANSWER: 0, AUTHORITY: 0, ADDITIONAL: 1

;; OPT PSEUDOSECTION:
; EDNS: version: 0, flags:; udp: 1232
The website also checks that an ordinary signed name resolves, that a deliberately invalid DNSSEC name is rejected, and that the resolver responds to a sentinel query for the current root key. These controls help distinguish a meaningful result from a failed lookup or unsupported protocol. If sentinel support cannot be established, the result is inconclusive; it does not mean the new key is missing.
The browser test checks the resolver your browser uses, which may be affected by Secure DNS or a VPN. The dig commands above explicitly query 1.1.1.1. Both provide a snapshot of the resolver path answering those requests.
New key, same algorithm
KSK-2017 and KSK-2024 both use RSA/SHA-256. The rollover replaces the key pair while keeping the same method for creating and verifying signatures.
In our 2018 post, we wrote that a successful rollover would open the door to discussing an algorithm change. Eight years later, the root still uses RSA.
Replacing the key remains useful. It limits how long a single private key stays in use and exercises the process of distributing new trust anchors, updating resolvers, and retiring old keys. As the first rollover showed, those steps can fail even when the cryptography itself works correctly.
The Internet Assigned Numbers Authority (IANA) plans an idealized three-year rollover interval, balancing regular practice against the work and risk of changing the root key too frequently. The gap since 2018 has been longer. The Internet Corporation for Assigned Names and Numbers (ICANN) attributes the delay to pandemic disruption and upgrades to the hardware that protects the private signing keys.
Changing algorithms means resolvers need both a new trust anchor and software that can verify the new signatures. Regular key rollovers let operators test the trust-anchor updates while keeping the algorithm the same.
What comes after October
The October 11 switch changes which KSK signs the root’s DNSKEY set. The rollover continues into 2027, when ICANN plans to revoke KSK-2017, remove it from the root zone, and delete its private key. Stopping a key from signing and removing trust in that key are separate steps.
ICANN has also proposed a future root algorithm rollover to ECDSA P-256. ECDSA produces smaller keys and signatures than the RSA algorithm used today. That proposal is separate from this October’s key replacement, and ECDSA is not a post-quantum algorithm.
1.1.1.1 now validates ML-DSA-44 signatures, which are designed to remain secure against attacks using quantum computers. For DNSSEC’s whole chain of trust to become post-quantum secure, signed domains, their parent zones, and the root must adopt post-quantum cryptography too. At the root, that means introducing a post-quantum KSK and getting resolvers to trust it.
That will require another root key rollover. The rollovers we perform now let operators test how they distribute replacement trust anchors, check that resolvers have accepted them, and retire the old keys. This October’s rollover keeps RSA, but exercises the trust-anchor updates we will need when the root moves to post-quantum cryptography. The sentinel gives us a way to check whether resolvers followed those updates.
We encourage DNS providers and resolver developers to support RFC 8509 trust anchor sentinels. If your resolver does not support them, ask your provider or software vendor to add support. Users should be able to check whether their resolver trusts the next root key before a rollover.
For now, the next deadline is October 11. You can check your resolver’s readiness at https://dnstest.dev/ksk-2024. If you operate a DNSSEC-validating resolver, confirm that it trusts KSK-2024, key tag 38696, and follow ICANN’s guidance and your software vendor’s instructions if the key is missing.

What's new in AI infrastructure and orchestration in September
Google Cloud is prioritizing AI infrastructure scalability by introducing GKE Agent Substrate, which enables 10x higher sandbox density and 89% faster inference startup.
Deep dive
- GKE Agent Substrate provides sub-500ms resume operations and 10x density.
- Pod snapshots reduce inference startup times by up to 89%.
- New M4N VMs deliver up to 25 GiB/s aggregate host storage performance.
- GKE Agent Sandbox for reinforcement learning enables scaling of parallel agent loops.
- Managed Lustre and C4N network-optimized VMs are now generally available.
- K8s-aibom tool automates the generation of machine learning bill of materials.
- Multi-cluster GKE Inference Gateway offers global traffic routing with <1% overhead.
Decoder
- Agentic AI: Applications where AI models act as autonomous agents that can plan, reason, and interact with external tools and environments.
- gVisor: A user-space kernel that provides an isolated execution environment for containers, offering stronger security than standard Linux namespaces.
Original article
Full article content is not available for inline reading.
Proactive Defense: Hardening Code Pipelines and CI/CD Infrastructure
Google's Mandiant suggests that securing the software supply chain requires treating CI/CD pipelines as high-trust, isolated security domains to thwart agentic injection attacks.
Deep dive
- Endpoint: Use sandboxed developer environments and block unapproved IDE extensions.
- Repositories: Mandate MFA/FIDO2 and implement zero-direct-to-main policies.
- Dependency management: Prohibit dynamic version ranges (e.g., ^ or ~) and mandate lockfiles.
- Build: Use ephemeral runners and federated OIDC identities to avoid static credentials.
- Artifacts: Quarantine new packages and enforce SLSA Level 2+ provenance.
- Deployment: Implement Policy-as-Code for Infrastructure-as-Code (IaC) verification.
Decoder
- OIDC (OpenID Connect): An identity layer on top of the OAuth 2.0 framework that allows applications to verify the identity of an end-user or a service.
- SLSA (Supply-chain Levels for Software Artifacts): A security framework for software development that ensures the integrity of software artifacts from source to deployment.
Original article
Full article content is not available for inline reading.

The Shift to cgroup v2 in Kubernetes: What You Need to Know
Kubernetes v1.35 now mandates cgroup v2, forcing clusters on legacy cgroup v1 to migrate or face kubelet startup failures.
Deep dive
- Kubernetes v1.35 strictly enforces cgroup v2 usage by default.
- Memory QoS, in-place vertical scaling, and improved OOM handling are locked behind cgroup v2.
- Requires kernel 5.8 or later; 5.9+ recommended for memory-intensive workloads.
- Container runtimes like containerd v2.0+ provide automatic driver discovery.
- Monitoring tools that read cgroup files directly need updates due to changed hierarchy and file structures.
Decoder
- cgroup (Control Group): A Linux kernel feature that organizes processes into hierarchical groups to limit, prioritize, and monitor system resource usage (CPU, memory, disk I/O).
- Pressure Stall Information (PSI): A kernel feature that measures how much time tasks spend waiting for resources, helping identify contention issues.
Original article
The Shift to cgroup v2 in Kubernetes: What You Need to Know
In Linux, cgroups (control groups) are a kernel feature used for managing system resources. Kubernetes uses cgroups to allocate resources like CPU and memory to containers, ensuring that applications run smoothly without interfering with each other. With the release of Kubernetes v1.31, support for v1 cgroup management moved into maintenance mode. Support for v2 cgroup management has been stable since Kubernetes v1.25.
Compared with cgroup v1, cgroup v2 provides a single unified hierarchy, a more consistent interface, and a stronger foundation for resource isolation and modern resource-management features.
Deprecation of cgroup v1
Kubernetes has deprecated cgroup v1. Starting with Kubernetes v1.35, failCgroupV1 defaults to true, so the kubelet does not start on a cgroup v1 node by default. Administrators can temporarily set failCgroupV1: false in the kubelet configuration file, but removal will follow the Kubernetes deprecation policy. Further removal work is tracked in KEP-5573: Remove cgroup v1 support.
If you are still on a release older than v1.35, migrate every Linux node to cgroup v2 before upgrading, or plan to set the temporary failCgroupV1: false override. If you are already on v1.35 or later, confirm that every Linux node runs cgroup v2 (or that you intentionally keep the override). Under the default configuration, a remaining cgroup v1 node fails during kubelet startup.
For kubeadm-managed clusters, Kubernetes v1.35 also makes this an earlier, stricter check. The SystemVerification preflight check, provided by k8s.io/system-validators, returns an error during kubeadm init, kubeadm join, and kubeadm upgrade when it detects cgroup v1 with kubelet v1.35 or later; with an older kubelet, the check remains a warning.
The top FAQs cover three main areas: why to migrate, the benefits and drawbacks, and key points to keep in mind when using cgroup v2.
Limitations of cgroup v1 and Improvements with cgroup v2
The Linux kernel documentation describes both interfaces:
- cgroup v1 documentation
- cgroup v2 documentation
Let's enumerate some known issues.
active_file memory is not considered available memory
The kubelet treats active_file memory as not reclaimable. For I/O-intensive workloads, a large page cache can therefore make the kubelet report memory pressure and evict Pods. This is a known kubelet issue; migrating to cgroup v2 does not by itself change that calculation. The documented workaround is to set equal memory requests and limits for containers that perform intensive I/O, after measuring an appropriate value.
Memory QoS updates in Kubernetes v1.36
Memory QoS was introduced as an alpha feature in Kubernetes v1.22 and updated in v1.27. It remains alpha in v1.36, but now separates memory throttling from memory reservation and adds tiered memory protection:
Memory QoS is available only on Linux nodes that use cgroup v2. It relies on the cgroup v2 memory controller: memory.high provides throttling, while memory.min and memory.low provide hard and soft protection when tiered reservation is enabled. cgroup v1 cannot provide this protection model.
- Enabling the
MemoryQoSfeature gate appliesmemory.highthrottling to Burstable containers. The threshold is derived from the request, limit, andmemoryThrottlingFactor(default0.9). memoryReservationPolicy: Noneis the default. It does not writememory.minormemory.low.memoryReservationPolicy: TieredReservationmaps Guaranteed Pod memory requests tomemory.min(hard protection) and Burstable Pod requests tomemory.low(soft protection). BestEffort Pods receive neither protection.- The kubelet exposes Alpha metrics for the total
memory.minandmemory.lowreservations on a node. - Kernel 5.9 or later is recommended. On older kernels,
memory.highreclaim can trigger a known livelock; from v1.36 the kubelet logs a warning when Memory QoS is enabled on an affected kernel.
For example, to opt in to tiered protection:
apiVersion: kubelet.config.k8s.io/v1beta1
kind: KubeletConfiguration
featureGates:
  MemoryQoS: true
memoryReservationPolicy: TieredReservation
memoryThrottlingFactor: 0.9
The overall Kubernetes recommendation is not to enable Alpha features in production; however, if you judge that memory QoS with tiered reservations is useful for your platform in production, make sure to test the configuration and account for hard-reserved memory before you enable the TieredReservation feature gate.
Container-aware OOM handling
On cgroup v2 nodes, the kubelet defaults singleProcessOOMKill to false. It therefore sets memory.oom.group for each container cgroup so that an OOM event kills all processes in that container together, rather than leaving a partially functioning multi-process container. Set singleProcessOOMKill: true only if you need the cgroup v1-compatible behavior where the kernel may kill one process at a time.
This behavior is scoped to a container cgroup, not the whole Pod. Also, cgroup.kill is a separate administrative interface: writing 1 to it sends SIGKILL to every process in that cgroup and its descendants; it does not configure OOM behavior. The cgroup v2 memory controller additionally provides memory.events counters that monitoring systems and userspace OOM managers can observe.
Rootless support
In cgroup v1, delegating controllers to less privileged containers may be dangerous. Unlike cgroup v1, cgroup v2 officially supports delegation. Most implementations of rootless containers rely on systemd for delegating v2 controllers to non-root users.
This delegation mechanism is separate from Kubernetes Pod user namespaces, which map container users to unprivileged host users.
What else?
- eBPF stories:
- In cgroup v1, device access controls are exposed through interface files.
- The cgroup v2 device controller has no interface files, and is implemented on top of cgroup BPF.
- Cilium attaches BPF cgroup programs for socket-based load balancing.
- Pressure Stall Information (PSI) reports CPU, memory, and I/O contention at node, Pod, and container level. On supported clusters, the kubelet exposes PSI by default. PSI requires cgroup v2, Linux 4.20 or later,
CONFIG_PSI=y, and a kernel not booted withpsi=0. - When migrating, update software that reads the cgroup filesystem directly.
CPU weight conversion in newer OCI runtimes
cgroup v1 uses cpu.shares, whereas cgroup v2 uses cpu.weight. Newer OCI runtimes use an improved non-linear conversion that preserves the default priority and gives small CPU requests more usable granularity. The change is implemented in the OCI runtime rather than Kubernetes: it is available in crun v1.23 and runc v1.3.2. After upgrading a runtime, monitoring or policy tools that predict exact cpu.weight values may need updates.
In-place resource updates
In-place Pod vertical scaling graduated to stable in Kubernetes v1.35. The kubelet coordinates changes between the Pod-level and container cgroups so that increases create headroom before container limits grow, while decreases constrain containers before shrinking the Pod-level boundary. Accurate aggregate enforcement for this feature requires cgroup v2.
Adopting cgroup version 2
Requirements
- You need at least one Linux node.
- Your OS install must run with cgroup v2 enabled.
- The kernel version must be 5.8 or later (5.9 or later is recommended when using memory QoS).
- The container runtime must support cgroup v2.
- The kubelet and the container runtime must both be configured to use the correct cgroup driver.
For now, you can opt back in to use cgroup v1; the Kubernetes project recommends using cgroup v2, but in Kubernetes 1.36 the cgroup v1 option remains supported as a fallback. That fallback is scheduled for removal in Kubernetes v1.38.
kernel updates around cgroup v2
- In Linux 4.5, the cgroup v2
io,memory, andpidscontrollers were supported. - Linux 4.15 added support for the cgroup v2
cpucontroller. - Pressure Stall Information (PSI) support began with Linux 4.20.
- The Kubernetes project does not recommend using cgroup v2 with a Linux kernel older than 5.2 due to lack of cgroup-level task freezer support.
- Kubernetes documents 5.8 as the minimum kernel version for cgroup v2; the root cgroup's system-level
cpu.statfile was added in Linux 5.8. - The
memory.highlivelock fix used by Memory QoS is present in Linux 5.9 and later. memory.peakwas added in Linux 5.19.
cgroup driver configuration
If you use kubeadm to manage your cluster, Kubernetes recommends that you use the systemd cgroup driver. If you can pick either option, I recommend using the systemd driver.
Whatever tooling you've chosen, the kubelet automatically tries to detect the runtime's recommended cgroup driver. If you're using a container runtime that supports cgroup v2 but doesn't support automatic cgroup driver detection, you can manually configure an override by editing the kubelet configuration file.
apiVersion: kubelet.config.k8s.io/v1beta1
kind: KubeletConfiguration
cgroupDriver: systemd
Tools and commands for troubleshooting
stat -fc %T /sys/fs/cgroup/: Check whether cgroup v2 is enabled.systemctl list-units 'kube*' --type=sliceor--type=scope: List Kubernetes-related units.bpftool cgroup list /sys/fs/cgroup/*: List all programs attached to the cgroup CGROUP.systemd-cgls /sys/fs/cgroup/*: Recursively show control group contents.systemd-cgtop: Show top control groups by their resource usage.tree -L 2 -d /sys/fs/cgroup/kubepods.slice: Show Pods' related cgroups directories.
How to check if a Pod CPU or memory limit is successfully applied to the cgroup file?
Work from the API object down to the node. Identify the node, then compare desired resources in the spec with the enacted values in status.
kubectl get pod <pod-name> -n <namespace> \
  -o jsonpath='{.spec.nodeName}{"\n"}'

kubectl get pod <pod-name> -n <namespace> \
  -o jsonpath='{range .spec.containers[*]}{.name}{" spec\t"}{.resources}{"\n"}{end}'

kubectl get pod <pod-name> -n <namespace> \
  -o jsonpath='{range .status.containerStatuses[*]}{.name}{" status\t"}{.resources}{"\n"}{end}'
On that node, as root, with the systemd cgroup driver and cgroup v2:
CONTAINER_ID=$(crictl ps \
  --label io.kubernetes.pod.namespace=<namespace> \
  --label io.kubernetes.pod.name=<pod-name> \
  --name <container-name> -q | head -n1)

# OCI view
crictl inspect "$CONTAINER_ID" | jq '.info.runtimeSpec.linux.resources'

# Kernel cgroup path for this container
PID=$(crictl inspect "$CONTAINER_ID" | jq -r '.info.pid')
CGROUP="/sys/fs/cgroup$(awk -F: '$1=="0"{print $3}' /proc/$PID/cgroup)"

cat "$CGROUP/cpu.weight"   # request.cpu → shares → weight
cat "$CGROUP/cpu.max"      # limit.cpu
cat "$CGROUP/memory.max"   # limit.memory

# Pod-level cgroup
cat "$(dirname "$CGROUP")/cpu.max" "$(dirname "$CGROUP")/memory.max"

# Present when MemoryQoS is enabled
cat "$CGROUP/memory.high" "$CGROUP/memory.min" "$CGROUP/memory.low"

SCOPE=$(basename "$CGROUP")
systemctl show "$SCOPE" \
  -p CPUWeight -p CPUQuotaPerSecUSec -p CPUQuotaPeriodUSec -p MemoryMax
OpenAI is adding invisible watermarks to ChatGPT and Codex for users in the EU
OpenAI is rolling out invisible textGrain watermarks for EU users to comply with the EU AI Act’s transparency requirements.
Decoder
- EU AI Act: A landmark European Union regulation that mandates transparency and risk management for artificial intelligence providers.
Original article
OpenAI will begin adding invisible, machine-readable watermarks called textGrain to eligible ChatGPT and Codex output in the EU to comply with transparency requirements in the EU AI Act. The technology embeds a statistical pattern into generated language rather than adding hidden characters. API customers worldwide can optionally enable it for supported models. OpenAI acknowledges that watermarking remains imperfect because editing and short outputs can weaken the detectable signal.
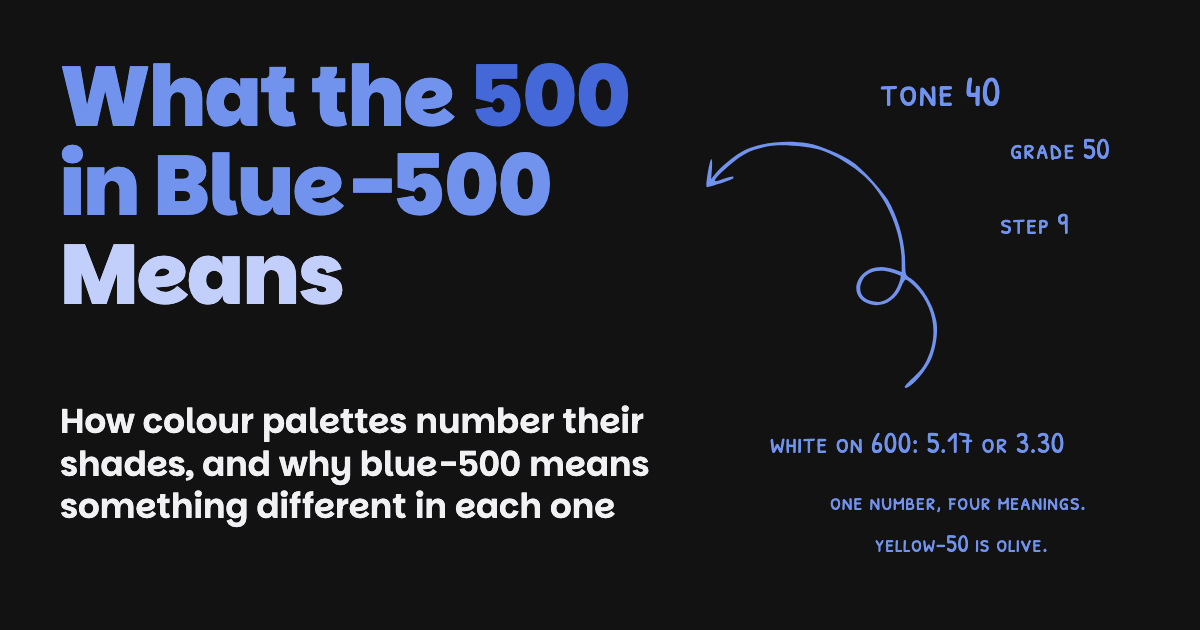
What the 500 in Blue-500 Means
Color scale numbers like 'blue-500' lack standardized meaning, often representing different concepts like position, contrast, or lightness across systems.
Deep dive
- Material Design (2014) introduced a 50-900 positional scale.
- Tailwind v4 uses OKLCH color space, offering improved saturation but keeping consistent lightness ramp structures as v3.
- WCAG 2.0 contrast ratios calculate relative luminance, which fails to account for how human perception varies across colors (e.g., yellow looks brighter than blue at the same lightness value).
- APCA (Accessible Perceptual Contrast Algorithm) is a newer candidate for contrast measurement that scores color pairs differently based on background polarity.
- USWDS and Material 3 attempt to force uniform luminance at each number, often turning bright colors like yellow into 'mustard' to fit the scale.
- Designing for contrast requires choosing a system that encodes role (like Radix) or absolute lightness (like Material 3) rather than just relative position.
Decoder
- WCAG: Web Content Accessibility Guidelines, the standard measure for text legibility on the web.
- OKLCH: A perceptual color space that maps colors according to how humans perceive lightness, chroma (saturation), and hue.
- CIELAB: An older color space based on the opponent color theory that attempts to match human vision.
- Magic Number: A constant difference in grade values used by design systems to guarantee a specific contrast ratio.
Original article
Most design systems ship colour as a set of palettes. Each hue is a ramp of shades running from light to dark, and each shade gets a number. In Tailwind, blue runs from blue-50 to blue-950, and red, green, yellow and grey use the same numbers. Designers pick shades by number in Figma, engineers write them into class names and tokens, and reviews refer to them the same way.
Because every hue shares the same numbers, it is easy to assume the numbers line up across hues. Take a primary button with white text on bg-blue-600. In Tailwind v3 that pairing has a contrast ratio of 5.17:1. A success button built the same way on bg-green-600 comes out at 3.30:1.
Contrast ratio is the measure the Web Content Accessibility Guidelines (WCAG) use for text legibility. It runs from 1:1, where text and background are identical, to 21:1, black on white. WCAG 2's AA level asks for at least 4.5:1 for body text and 3:1 for large text and interface elements. The blue button passes AA and the green one fails, though both use shade 600.
Stefan Bauer wrote about these numbered scales in a 2021 post covering Material, Bootstrap and Tailwind, and compared them to the 100 to 900 scale CSS uses for font weight. Looking across more systems, the numbers are used in at least four different ways. In some palettes a number is a position in the ramp. In others the gap between two numbers guarantees a contrast ratio, the number is a measured lightness, or the number names what the shade is for. Each palette decides what its numbers mean. Many teams use palettes where the numbers only record position.
Numbered by position
Material Design introduced its palette in 2014. Each hue had ten shades numbered 50 to 900, plus four brighter accent shades named A100, A200, A400 and A700. Google's guidance suggested using the 500 shades as an app's primary colours and the others as accents.
Tailwind adopted the scale for version 1.0. In March 2019 Adam Wathan wrote that the palette was going from seven shades per colour to nine, “using a numeric scale borrowed from Material Design.” Tailwind added a 50 shade in version 2.0 in November 2020 and a 950 shade in version 3.3 in March 2023.
Material and Tailwind use the number for a shade's position within its own hue. The same number can have a different lightness in each hue.
One reason is how colour models measure lightness. In HSL, a colour model that has been part of the CSS standard since 2011, the lightness value is the average of the highest and lowest of the red, green and blue channels. Pure yellow (255, 255, 0) and pure blue (0, 0, 255) both average to 50%. People see yellow as much lighter than blue, because the eye is more sensitive to red and green light. On the CIELAB scale, which is designed to match perceived lightness from 0 for black to 100 for white, that yellow measures about 98 and that blue about 30. A ramp built by stepping HSL lightness carries that difference into every shade.
Tailwind v3 shows the effect. Measured in OKLCH, a colour space whose lightness value (0 to 1) is also designed to match perception, the 500 shades of Tailwind's seventeen colour families range from 0.585 for indigo to 0.795 for yellow. Its five greys sit between 0.551 and 0.556.
Contrast depends on lightness, so the same pair of numbers gives a different ratio in each hue. Text in shade 200 on a background in shade 700 passes AA in violet at 5.12:1 and fails in yellow at 4.23:1. Across Tailwind's seventeen colour families, 200 on 700 fails AA in twelve. The reverse pairing, 500 on 900, passes in one colour family, yellow.
Material's 2014 palette works the same way. White text on its 500 shades ranges from 7.33:1 on deep purple to 1.63:1 on amber and 1.22:1 on yellow.
In these palettes a rule that names shade numbers, such as text in 200 on a 700 background, can't be written once for the whole palette. It passes in some hues and fails in others, so each pairing has to be checked on its own. The two buttons at the top are the same problem. White text on 600 passes in blue and fails in green.
Numbered for contrast
IBM's Carbon design system numbers each colour's shades from 10 to 100 and ties the numbers to contrast. Its colour guidance states: “If the difference between two values is 50 or greater, the colors are accessible.” In Carbon's blue, grade 20 text on a grade 60 background, 40 apart, is 3.81:1. On grade 70, 50 apart, it is 5.94:1. Every pair of Carbon blues 50 or more apart measures at least 4.55:1.
The US Web Design System (USWDS) uses the same idea. A proposal posted on 1 December 2017, which credits a palette developed at IBM, set out a scale from 0 for white to 100 for black. In the current system each grade covers a fixed range of relative luminance, so grade 50 has the same luminance in every colour family. USWDS calls the difference between two grades the magic number. A difference of 40 or more meets AA for large text, 50 or more meets AA for body text, and 70 or more meets AAA.
Stripe published a similar rule. In October 2019 Daryl Koopersmith and Wilson Miner described rebuilding Stripe's palette in CIELAB, after finding that none of its default colours for small text, apart from black, met the WCAG contrast threshold. In the new palette any two colours at least five levels apart meet the threshold for small text, and any two at least four levels apart meet it for icons and large text.
In these palettes the rule can be written once. Grade 20 text on a grade 70 background passes AA in every Carbon family, and across Carbon's twelve full colour families every pair of grades 50 or more apart measures at least 4.52:1. USWDS holds across all 25 of its standard colour families, at 4.56:1 or more. The cost of that consistency shows up in yellow, covered in the next section.
Numbered by lightness, and by role
Google replaced its own scale with Material 3 in 2021. James O'Leary, a colour scientist at Google, created a colour space called HCT for the Material You release. It takes hue and chroma from the CAM16 colour-appearance model and takes tone from CIELAB's lightness value. Material 3 palettes number their shades by tone, from 0 to 100. Tone 40 is a colour with a CIELAB lightness of 40, whatever its hue. The source code of Material's colour library states the contrast rule. A difference of 40 in tone guarantees a ratio of at least 3:1, and a difference of 50 guarantees at least 4.5:1.
Radix Colors numbers its twelve steps by what each one is for. Steps 1 and 2 are app backgrounds, 3 to 5 are component backgrounds, 6 to 8 are borders, 9 and 10 are solid fills, and 11 and 12 are text. Radix states its text contrast in APCA terms, a newer contrast method covered below. Steps 11 and 12 are guaranteed Lc 60 and Lc 90 on a step 2 background from the same scale.
USWDS and Material 3 define each grade by lightness, so every hue has to fit the same lightness at each grade. Yellow shows what that means in practice. Tailwind's yellow-500 is #eab308, a bright yellow. USWDS's yellow-50 is #8a7237, and Material 3's yellow at tone 40 is #6d5e0f. Both are dark olive, because grade 50 and tone 40 are defined by lightness, and a bright yellow is too light to sit there.
In both systems the same grade gives close to the same contrast in every hue. Against white, Material 3's tone 40 measures between 6.43:1 and 6.50:1 across the eight hues tested here, and USWDS's grade 50 between 4.58:1 and 4.63:1 across its families.
Radix makes the decision at a different level. A team using Radix picks a role rather than a shade number and a pairing to check. Body text is step 12, a button fill is step 9, and the contrast between those roles is set by the palette.
The contrast formula
Apart from Radix's, all of these guarantees are calculated with WCAG 2's formula. WCAG 2.0 became a W3C Recommendation on 11 December 2008 and defines contrast as a ratio of the relative luminance of two colours.
contrast = (L1 + 0.05) / (L2 + 0.05)

L1  relative luminance of the lighter colour
L2  relative luminance of the darker colour
The thresholds come from earlier standards. ISO 9241-3 and ANSI/HFES 100-1988 set 3:1 as the minimum for normal vision, and WCAG raised it to 4.5:1 to cover readers with 20/40 vision. USWDS defines its grades using the same relative luminance, and Carbon's and Material 3's rules are stated as WCAG ratios.
The formula gives the same ratio whichever colour is the text and whichever is the background. USWDS's documentation says its grade 50 colours meet AA against both pure white and pure black. Its grade 50 grey, #757575, measures 4.61:1 on white and 4.56:1 on black.
The Accessible Perceptual Contrast Algorithm (APCA), developed by Andrew Somers as a candidate method for the next version of WCAG, scores the two pairings differently. It reports lightness contrast as an Lc value, and gives that grey Lc 72.0 as text on white and −29.6 as text on black. The sign shows which way round the colours are. By APCA's measure, the grey on black has less than half the contrast of the grey on white.
WCAG 3 has not settled on a replacement formula. APCA was included in the WCAG 3 working draft as exploratory content and removed in the July 2023 draft, after it did not get enough support in the working group. Adrian Roselli's review of the draft as of April 2026 notes that it still says the contrast algorithm “is yet to be determined,” and that WCAG 3 is unlikely to be finished before 2030.
If WCAG 3 adopts a different formula, a USWDS magic number of 50 will still describe the same luminance difference, but whether that difference meets the new standard would need to be checked again. The same applies to Carbon's difference of 50, Stripe's five levels and Material 3's tone difference of 50.
Changing a palette people already use
Tailwind released version 4.0 on 22 January 2025 and moved its default palette from rgb to oklch, using the wider colour range of modern displays to make the colours more saturated. The announcement said the team had tried to keep the balance between the colours the same as in v3, so that the change “shouldn't feel like a breaking change” for existing projects.
Comparing the two versions shows how closely that was done. Tailwind v4 has 242 shades across 22 families. In 220 of them the OKLCH lightness matches v3 to three decimal places. The other 22 are the 400 shade in every family, each made darker by 0.007 to 0.009. Almost all of the change is in chroma, meaning saturation.
/* blue-500 in v3 and v4 */
v3:  #3b82f6                      /* oklch(0.623 0.188 259.8) */
v4:  oklch(0.623 0.214 259.815)   /* same lightness, more chroma */
Because lightness stayed the same, contrast changed very little. On an sRGB display, every v4 shade is within about 4% of its v3 contrast ratio against white and against black, and only one of those 484 pairings moves across the 4.5:1 line. White on blue-600 goes from 5.17:1 to 5.26:1. Keeping the lightness also means that yellow-500 is still at 0.795 and indigo-500 at 0.585, so the numbers still describe position and not lightness.
Tailwind's numbers also spread beyond Tailwind. In August 2025 Adam Wathan joked about formally apologising for making every button in Tailwind UI bg-indigo-500 five years earlier, “leading to every AI generated UI on earth also being indigo.” The Default Is Not a Design Decision looks at how defaults like this get repeated by AI design tools.
Design specs, guidelines and code reviews often give colour as shade numbers, such as text in 200 on a 700 background. In Tailwind and in Material's original palette, an instruction like that depends on the hue. It passes in violet and fails in yellow, and white text on 600 passes in blue and fails in green. In Carbon, USWDS and Material 3 the same instruction holds in every hue, because those systems decided what the number measures and made every colour fit it, olive yellow included. blue-500 means whatever its palette decided it means, and in many of the palettes teams use, that is only where the shade sits in the ramp.
Building Faster Emergency Patching Systems
Google Project Zero details how large software vendors can rapidly deploy emergency security patches using feature flags, filtering, and hotpatching.
Deep dive
- Triage and development are rarely the bottlenecks for emergency patches; testing and distribution are.
- Feature flags allow vendors to toggle dangerous functionality off globally without shipping new code.
- 'Dual stack' libraries involve compiling two versions of a library into a binary, allowing for instant rollback if the new patch causes instability.
- Filtering inputs (e.g., Android Intent Firewall) provides a flexible, albeit performance-impacting, way to block exploits.
- Alternate update channels (like Android APEX) permit patching individual components without an entire OS update.
- Hotpatching allows replacement of functions directly in memory, though it poses risks for exploit mitigation bypasses.
- All emergency mechanisms require pre-planned testing and rigorous security validation.
Decoder
- Zero-click: An exploit that does not require any interaction from the user, such as opening a file or clicking a link, to succeed.
- Bricking: Rendering a device completely non-functional through a failed software update.
- ASAN (AddressSanitizer): A fast memory error detector for C/C++ that can be used to catch vulnerabilities like buffer overflows.
- DCHECK: A debug assertion that causes a program to crash if a condition is false, used primarily during testing to catch logic errors.
Original article
Project Zero often works with software vendors to remediate the vulnerabilities we report and provide broader guidance on making software more secure. Some vendors express concern about potential scenarios in which they are unable to fix vulnerabilities that are causing immediate user harm, due to limitations in their patch delivery systems. Since Project Zero encounters a wide array of systems designed to protect users in the case of exceptional exploitation scenarios, both through vendor discussions and security reviews, we want to share what we’ve learned.
This post provides an overview of systems in use by large vendors that allow them to remediate small volumes of vulnerabilities much faster than their typical update process. Our goal is to provide a reference for vendors seeking to implement or enhance the capabilities of such systems, and to encourage vendors to consider how they would fix an urgent vulnerability before they receive one.
Why patching takes time
Patching a vulnerability typically involves the following stages:
- Triage — a vulnerability report is received, validated, prioritized and assigned to a specific developer to be fixed
- Patch development — a software development team writes, reviews and commits code that fixes the vulnerability
- Testing — the patch is tested to ensure the vulnerability is remediated and the software still functions correctly when the patch is applied. This can include formal testing by a test team, automated testing and alpha and beta testing where a patch is shipped to a limited group of users for feedback on normal use.
- Partner review — some software updates require review by third parties before they can be shipped, due to relationships between the software vendor and other organizations, for example, carrier acceptance for some mobile updates.
- Delivery — the patch is delivered to and installed by end users
- Activation — sometimes an additional step, such as a system restart, is needed to switch the system to the updated software
Of course, this is a simplified picture. Patching can involve repeating steps, for example rewriting a patch if tests fail, or additional stages when third-party vendors are involved. However, this is a minimal set of steps most software updates require.
The challenges of emergency patches
While triage and patch development time contribute substantially to the speed at which vendors can generally patch vulnerabilities, they contribute less to emergency patch time. Triage is usually very fast in situations where vendors know they have an urgent problem, and patch development can be expedited based on priority. Only in rare circumstances, where a vulnerability is especially complex, or a vendor’s security team does not have a complete picture of their software’s components and who within their organization maintains them, have we seen urgent patches delayed in the triage or development phase. Likewise, partner agreements usually have exceptions for updates in emergency situations.
Most vendors’ patch speed is limited by the testing and delivery stages. Testing is important because all changes to software risk introducing unexpected behavior. The worst-case scenario is that inadequately tested software ‘bricks’ a device, causing it to malfunction in a way that it can no longer perform key functionality or receive software updates to remediate this. Buggy software updates have also led to situations where user data is corrupted or lost, and any decrease in software functionality after a security update makes users less likely to apply updates in the future.
The potential cost to vendors of shipping poorly tested updates varies depending on the nature of the underlying software. For example, if a mobile application is rendered unusable due to an update that corrupts local data or prevents it from launching, users can easily install the next version via an app store, and their data is usually saved on a remote server, so costs are limited to user support. Meanwhile, if a mobile device gets bricked, it needs to be returned to its manufacturer or place of purchase for repair, leading to substantial costs for the vendor and potentially the user.
The possibility of serious functional bugs is considered in the design of most patch delivery systems. Updates are often rolled out slowly, so that serious problems can be detected before they affect too many users. Often, patching vulnerabilities quickly and avoiding buggy patches are at odds with each other, requiring tradeoffs that prioritize one over the other.
A variety of other technical challenges can limit the speed of patch delivery. One is the design of the patching system. A common design is that devices probe for updates at a regular interval, leading to patch saturation being limited to that interval. ‘Push’ style update systems can deliver patches to all users faster, but generally require more infrastructure.
User behavior and environment can also be a barrier to patch propagation. Patches that require user interaction to install are often delayed by users, and network speed and data cost are also factors in installation rate. Updating many users at once, as opposed to over a period of time, can strain patch delivery infrastructure. Chrome and Microsoft have written about the challenges of updates requiring restart to install, as users are often reluctant to restart their system and restarts take time.
While testing delays and limitations of the patch delivery system affect all updates, the shorter time frame of emergency updates make them a larger contributor to the overall time it takes to deliver a patch.
Emergency patching methods
Feature flags
Feature flags are conditional statements in source with paths determined by values provided by a remote server. They are often used for A/B testing, but they can also be used for short term remediation of vulnerabilities in emergency situations. A widely publicized case of this was a serious 2019 FaceTime vulnerability, where Apple temporarily disabled Group Facetime with a feature flag. Several vendors have made at least some media codecs available in 0-click contexts controllable via feature flags, and can disable them in the case of active exploitation, falling back to another codec for realtime transmission.
The main benefit of feature flags as a vulnerability remediation method is that testing can be performed with each flag set in advance, so a fast update does not require shipping untested code. They can also be delivered to users much more quickly, as updating feature flags requires transmitting a very small amount of data.
Recently, Meta published a blog post on how they implemented a ‘dual stack’ library, in which two versions of the WebRTC video conferencing library were compiled into a single binary, with the version in use controllable via a feature flag. This technology enables rapid updates with less testing, as new versions can be shipped with the option to quickly move users back to the previous version if function problems occur. While Meta uses two versions of the same library, it would also be possible to create a ‘dual stack’ with two different libraries that implement the same features (for example, two H264 libraries), allowing an application to switch to a different library to render a specific vulnerability unreachable without loss of functionality in an emergency. This would require additional testing, but it is testing that can be performed up front. It could also be possible to have a second library that enables performance intensive mitigations that would block many possible bugs, such as ASAN, or enabling DCHECKs.
Filtering
Filtering is running a dynamically updatable ruleset, such as a regular expression, against untrusted input in order to block specific input that is required to reach a vulnerability. An example of this is Android’s Intent Firewall, which allows specific usages of an Android IPC mechanism called intents to be disabled based on rules in a dynamically updateable XML file, which enables blocking intents that can be used to exercise specific vulnerabilities. It was recently used to block vulnerabilities in third-party Android wallets.
Some platforms have endpoint detection software that can perform filtering on a wide variety of system input, for example Microsoft Defender on Windows systems, and Google Play Protect on Android devices. Rules that block specific exploits or make certain vulnerabilities unreachable can often be deployed to these applications very quickly. Endpoint detection requires parsing a great deal of untrusted input, often in privileged context, so these applications are not without risk, but in systems where they already exist, they are a potential method of emergency remediation.
As an approach, filtering is more flexible than feature flags. For feature flags to be effective, the vendor needs to determine what features they might want to disable in advance, and if this isn’t comprehensive, they might find themselves in a situation where a vulnerability can’t be remediated via feature flags. Meanwhile, filtering can be used to block a wide variety of inputs, even ones that have never been considered. The downside of filtering is that performing filtering frequently can decrease software performance, and at least some testing of new filters is required, and can’t be performed upfront without knowing the vulnerability that needs to be blocked, as it is possible to write filters that interfere with necessary system functions.
Alternate Channels
The network ‘channels’ used to deliver software updates to users can be slow for a variety of reasons discussed above. Vendors sometimes implement alternate channels that can be used to deliver smaller updates more quickly.
Android Pony Express (APEX) is an example of an alternate channel that can be used to ship updates to specific high-risk Android components faster than a full system update. It shortens the patch development time, as OEMs do not need to integrate updates to APEX components. APEX is available to OEMs, and can be used to update OEM-maintained libraries.
Several applications we’ve researched have the ability to update individual libraries outside regular updates, usually by having some flag that is regularly checked over the network, and then downloading the library and loading it with dlopen or equivalent. While this is an effective way to avoid delivery-speed limitations of updates, it can also introduce critical vulnerabilities if libraries delivered in this way are not adequately verified by the client to have originated from the vendor. We encourage vendors to be cautious, and ensure that emergency update mechanisms of this variety have adequate security testing.
Hotpatching
Some vendors have implemented update mechanisms that allow units of binary code smaller than libraries to be delivered and applied directly to the memory space of a running process. For example Linux supports Livepatch which enables kernel functions to be directly replaced in memory without a restart. Similarly, Windows’ hotpatch allows security updates that contain only updated functions to be delivered to users, and applied while the process is still running.
Hotpatching has the potential to deliver very flexible security patches to software very quickly, with no degradation of user experience, though it typically has some limits to the nature of patches it can deliver, for example, updates that require changing the definition of a structure shared between functions are sometimes not supported. Hotpatching has similar security downsides to alternate channels, and also carries the risk of introducing ways to bypass exploit mitigations, as it requires permissions to map pages with write-execute privileges at some point during patching. It also doesn’t address any of the testing challenges of rapid updates, just the delivery challenges.
The importance of emergency patching
LLMs are increasing the vulnerability discovery and exploitation capabilities of both attackers and defenders. A wider array of actors now have the ability to perform novel attacks at greater speed. In light of this, it is important for vendors to consider how to protect their users in the case of active exploitation. Rapid update mechanisms do not need to be heavyweight or be capable of fixing every possible bug and preserving perfect user experience in every scenario. Technologies like feature flags, filtering and alternate update mechanisms can remediate the most likely and severe vulnerabilities in the short term, while keeping devices reasonably functional for users.
It is urgent for vendors to plan how they will protect their users in the worst case scenario of widespread active exploitation. Actions taken now can greatly improve security outcomes for users. By taking stock of update mechanisms already available to them and implementing rapid remediation functionality where gaps exist, vendors can be better prepared for whatever the future holds.
EmbeddingGemma 2
Google's 740M-parameter EmbeddingGemma 2 enables on-device, multimodal vector searches across text, code, audio, and video.
Deep dive
- 740M-parameter model built on Gemma 4 architecture
- Supports text, code, image, audio, and video modalities
- Matryoshka Representation Learning allows truncating 768-dimension vectors to smaller sizes (128, 256, 512) for storage efficiency
- 8K token context window supports up to 5.5 minutes of audio or 58 video frames
- Apache 2.0 license permits commercial use
- Compatible with LiteRT, MediaPipe, and standard tools like llama.cpp and Ollama
Decoder
- Embedding Space: A vector space where data items are represented as numerical arrays, allowing systems to measure semantic similarity by calculating the distance between vectors.
- Matryoshka Representation Learning (MRL): A technique where embeddings are trained so that their prefix sub-vectors contain the most important information, allowing users to truncate vectors to smaller dimensions while retaining useful semantics.
- RAG (Retrieval Augmented Generation): A technique that provides LLMs with context from external datasets to improve accuracy and reduce hallucinations.
- Quantization: The process of reducing the precision of model weights (e.g., from 32-bit floats to 4-bit integers) to shrink model size and increase inference speed.
Original article
EmbeddingGemma 2: an open, lightweight multimodal embedding model
EmbeddingGemma 2 is the most capable model for on-device multimodal embeddings, natively mapping combinations of text, images, audio, and video into a unified embedding space.
We introduced EmbeddingGemma last year to provide a lightweight option for high-quality text embeddings, to help your apps organize, search, and connect information directly on consumer hardware. The developer community’s response blew past our expectations. With more than 20 million downloads, builders have used it to power smarter on-device search tools and privacy-first retrieval augmented generation (RAG) pipelines.
Today, we’re launching EmbeddingGemma 2, expanding beyond text to unify code, images, video, and audio in a shared embedding space. Built on the Gemma 4 architecture and released under a commercially permissive Apache 2.0 license, EmbeddingGemma 2 has 740 million parameters, making it optimal for on-device inference. It can help find a specific video clip from a voice memo, or search through hours of audio recordings based on a text query, all processed by a single, natively multimodal model.
Built from the same technology as Gemini Embedding models, EmbeddingGemma 2 is:
- Best-in-class for its size: Achieves leading scores among sub-1B multimodal embedders for its size across benchmarks like MTEB (Massive Text Embedding Benchmark) Code and MAEB (Massive Audio Embedding Benchmark), while matching or outperforming many larger models across text, vision, and audio tasks.
- Modular by design: Requires as little as 270M parameters for text-only workloads with optional vision (170M) and audio (300M) encoders for full multimodal support.
- Storage-efficient: Using Matryoshka Representation Learning (MRL), developers can dynamically truncate output vectors from 768 dimensions down to 512, 256, or 128 dimensions. This provides up to 6x storage reduction for local vector databases and memory usage.
- Optimized for on-device performance: Runs efficiently within tight resource constraints. With quantization, on a Google Pixel 11 Pro, EmbeddingGemma 2 requires as little as ~191MB active RAM for text-only weights and ~567MB for the full multimodal model.
- Extended context ready: Features an 8K token context window (4x larger than EmbeddingGemma 1), allowing it to process up to 5.5 minutes of audio, 29 images, 58 video frames, or interleaved combinations thereof directly on local hardware.
Achieving top-tier quality for code, vision, and audio
EmbeddingGemma 2 matches the strong multilingual text performance of EmbeddingGemma while delivering a significant 9.92-point improvement on code performance (in MTEB Code, from 68.76 to 78.68), making it well-suited for local codebase indexing, semantic code search, and coding agent retrieval. Across image, video, documents, and audio, it sets a new standard in quality-per-parameter for sub-1B models and even outperforms some specialist models more than twice its size.
Find full evaluation metrics and model information in the EmbeddingGemma 2 model card.
Enabling semantic search, routing, and retrieval, fully on-device
EmbeddingGemma 2 brings robust capabilities directly to edge hardware. Generating embeddings locally helps ensure data privacy, reduces pipeline latency, and empowers developers to build cross-modal search and retrieval that works entirely offline.
When paired with generative models such as Gemma 4, EmbeddingGemma 2 enables on-device RAG pipelines that understand complex multimodal data. Because EmbeddingGemma 2 is built on Gemma 4 and shares its text tokenizer and audio encoder, developers can run both models together in a unified pipeline with a lower combined total memory footprint.
Use text or an image to find the top matches in your media library based on semantic similarity. Try it in Google AI Edge Gallery’s Instant Media Search.
Locate specific moments in video using text or audio queries. Try it in Google AI Edge Gallery’s Video Moments Finder.
Pair EmbeddingGemma 2 for local file retrieval with Gemma 4 for contextual reasoning. Try it in the Google AI Edge Foresight app.
Create real-time decision engines leveraging multimodal context for classification, routing, and predictive capabilities via the MediaPipe Decision Task API.
To learn how to build on-device search and RAG systems with LiteRT, read the Google AI Edge blog post.
Getting started with EmbeddingGemma 2
We worked closely with the following partners to ensure EmbeddingGemma 2 works immediately where you build:
- Download the models: Find the model weights on Hugging Face and Kaggle, with Gemini Enterprise Agent Platform Model Garden availability coming soon. Visit LiteRT Community on Hugging Face for models optimized for on-device.
- On-device deployment: Develop cross-platform apps with Google AI Edge MediaPipe for turnkey embedding, retrieval & decision tasks or LiteRT for custom model integration. Build for the browser with transformers.js or WebGPU.
- Use your favorite development tools: Serve the model efficiently using transformers, sentence-transformers, MLX, vLLM, llama.cpp, SGLang, Ollama, and LMStudio. Store your embedding vectors with Qdrant.
- Fine-tuning: Follow guidance by Unsloth for how to fine-tune EmbeddingGemma 2 for your use cases.
Explore our developer guide, documentation, and guides for inference and fine-tuning.

Building the Most Diverse UMI Dataset in Robotics
Pantheon scaled a robot data collection operation to over one million unique tasks at a cost of $10 per hour using custom UMI hardware.
Deep dive
- Used UMI (Universal Manipulation Interface) to bridge egocentric data collection with teleoperation
- Implemented 'freeform' data collection where operators perform random tasks, labeled retroactively by VLMs
- Developed 'Nomos' to generate diverse, physically valid scripted tasks
- Built 'Hades' and 'Styx' bare-metal storage clusters to manage 2 petabytes of footage per month
- Reduced gripper production costs to $11 per unit compared to $80+ commercial alternatives
- Released 100-hour sample of the dataset with dense task labels via the Argus annotation pipeline
Decoder
- UMI (Universal Manipulation Interface): A framework for teaching robots using human-operated handheld grippers, which simplifies data collection by removing the need for full robotic teleoperation setups.
- Dexterous Manipulation: The ability of a robot to handle objects with complex, human-like hand movements.
- Imitation Learning: Training an AI model by having it observe and replicate human behavior.
- VLA (Vision-Language-Action): Models that map visual input and language instructions directly to physical robot actions.
Original article
Building the Most Diverse UMI Dataset in Robotics
We built a data collection operation that produces the most task-diverse and environment-diverse UMI dataset in robotics, and in just eight weeks we've scaled to over 1 million tasks and optimized costs down to $10 per hour of data.
In just eight weeks and with a core operations team of 5, we scaled an international data collection operation to a team of 90 operators. To support it, we built our own custom in-house Universal Manipulation Interface (UMI) hardware, multiple colocated storage and compute clusters, custom reverse-engineered camera firmware, and dedicated internet infrastructure. We also took several ambitious, nonconsensus bets on data distribution, and have collected what is to the best of our knowledge the most diverse UMI dataset in the world.
We have since produced over 1 million unique tasks at an average cost of $10 per hour of data, all while paying our operators three times the local living wage. In doing so, we have validated a collection process we can scale to millions of hours of UMI data. To push the frontier of dexterous manipulation forward, we are also releasing a 100-hour sample of our dataset, fully annotated with dense task labels from Argus, the most advanced open-source annotation and data quality pipeline in robotics.
What does good data look like?
Before UMI, robotics data was broadly either egocentric data (humans performing tasks with a head cam) or teleoperated data. UMI bridged the gap between the ease of ego data collection and the embodiment similarity of teleoperation. It enabled collection of 1 DoF gripper actions, end-effector deltas, and wrist cam views while leaving open an avenue to scaling past millions of hours of data collection.
We are betting big on UMI. As a data collection method, we believe UMI is the ideal point on the Pareto frontier between scalability and retaining embodiment transfer. However, many existing UMI datasets suffer from imitation learning-derived priors. Namely, most such datasets are generated as repetitive, task-sparse successful iterations of a very small set of tasks, with little consideration to diversity. This data is suitable for imitation learning on a single task at a time, but fails to model the real-world state distribution and is insufficient for our goal of true zero-shot task generalization in world models.
It is also prohibitively expensive to buy petabytes of UMI data from external suppliers. Existing UMI datasets cost around $60/hr, and custom datasets raise the cost to as much as $150/hr. These rates are for task-sparse data; suppliers generally don’t operationally support diverse, task-dense data, so the type of data we need from suppliers is unobtainable at any cost.
Under these conditions, it was clear to us very early on that we’d need our own in-house UMI data collection operation where we could redesign every aspect of collection from the ground up.
Collection approach
We knew we needed task-diverse and environment-diverse data, but we also knew this could be operationally challenging. In existing operations, the pattern is usually:
- Start recording an episode
- Perform a small task, usually ~20 seconds
- End the episode
- Reset the task to the initial state
Every step outside of performing the task adds operational overhead that significantly reduces the throughput of an operator. Worse, the structure of this collection style can only support VLA-style imitation learning, since the overhead of switching to a different task and recording it in the hardware is too high. To justify the overhead of switching tasks, each task would have to be repeated at least ten times in a row.
Freeform collection
Here, we made a big bet. Six months ago, frontier VLMs were not good enough at labeling video data. For any semantic-level data annotation work, like task verification, subtask annotation, or goal frame annotation, the only choice was human operators through expensive data labeling contracts with large commitments. However, we had high confidence that this was a temporary constraint and that VLMs would soon perform this work accurately and cost-effectively. Therefore, we decided to do the following:
- Introduce the collection of freeform data. In freeform data, an operator is given a set of 15 or so items scattered around the table and is asked to perform any random tasks on the objects with no guidance. In its raw form, this data cannot easily be used for training planners since there are no task labels or clear goal states. It also can't be used for any form of text-conditioned policy training.
- Wait for VLMs to reach our standards of data annotation and QA, and only use the data once this becomes the case. At the time we designed the operation, we knew the data we produced wouldn't immediately be useful since it wouldn't have clear task annotations, but expected VLMs to eventually catch up. That was sufficient if it meant we could collect at much higher throughput. We took on the risk that VLMs would never reach or surpass human level, and the data we collected in this scheme would be unusable.
It turned out that we only had to wait five months between our first VLM experiments and the point when Argus became good enough at annotation to fully serve both our annotation and QA needs, making all of our collected data usable.
Freeform collection takes us a long way towards our goals of task-diverse and environment-diverse data collection, but it has its own distribution issues. Most actions in freeform episodes fall into a narrow set of grasp, pick, move, and place operations. This is not categorically an issue; general zero-shot pick and place is far from solved, and the vast majority of manipulation in the real world is mostly pick and place. However, it cuts off the long tail of much more dexterous manipulation, like fine-grained insertion tasks, which can end up underrepresented in a freeform dataset. To get the best of both worlds, we also overhauled the standard single-task loop to complement freeform collection.
Scripted collection
Supporting scripted collection required a dedicated tooling layer. We built Nomos, a tooling platform that plays three important roles:
- Generating diverse tasks. Nomos allows us to achieve remarkably high levels of task diversity. It tracks a growing catalog of physical objects alongside a dictionary of manipulation primitives, enabling us to generate millions of distinct tasks from combinations of objects and modifiers. We also designed it to never mint physically impossible tasks. To date, we have collected data for tasks involving nearly every possible pair of objects in our catalog.
- Categorizing manipulation. Nomos categorizes an object according to how a human hand would manipulate it, which enables accurate reasoning of coverage with respect to object types and their associated manipulation priors. This helps us separate coarse- and fine-grained manipulation, giving us a distributional knob to tune as tasks are served.
- Adapting collection to research needs. Nomos also allows us to change the distribution of the data we collect at a moment’s notice. If, for instance, we require greater representation of tool use, a different class of manipulation primitives altogether, or greater coverage of a particular object type, we can implement the request across our operation within minutes. This has been indispensable because our understanding of what data distributions are valuable has changed substantially as our model checkpoints have improved.
Failure data
We noticed early in our world model experiments that expert trajectories, especially when thoroughly cleaned of all possible failures and mis-grasps, are poor proxies for the real-world state distribution. Real robots need to gracefully recover when a mistake happens, but expert data is devoid of recovery paths from bad states to good states, so policies (both VLA and world model based) struggle. World models can naturally ingest and learn from failure data, since actions are provided by a separate planning layer like RP-1. Thus, we collect episodes that are full of missed grasps, premature drops, and general task failures and recoveries. Argus can segment out the failures and successes so that our models can learn how the world evolves during failure and how to recover from failure, but not to take actions that result in failure.
In-the-wild data
As useful as it is to have a centralized office space for data collection, it limits scalability of the operation. It also limits the environment distribution those table-mounted arms would see, which is reasonable but not sufficient long-term. We build our hardware to enable fully untethered, in-the-wild freeform data collection in any environment. Argus makes immediate labeling unnecessary, so operators can just perform arbitrary tasks with the grippers anywhere they want and produce usable data.
Hardware
By running our own operation, we retain full control of the UMI gripper itself and can freely optimize it for our needs. To iterate on our hardware as fast as possible, we designed it to be fully modular. Our cameras are off-the-shelf and can be easily swapped if they fail, unlike many suppliers’ fully integrated UMI gripper solutions. This also allows us to update the grippers across our entire operation without replacing existing cameras.
Throughout the course of scaling operations, we deployed three iterations of grippers:
- Our first iteration of gripper hardware was designed quickly to get UMI grippers in hands ASAP and unblock iteration on downstream parts of the pipeline, such as firmware and data processing. It was rugged and functional, but too mechanically complex.
- For the second iteration, we did a complete overhaul of the structure. We reduced the main assembly to the housing and two gripper fingers, each of which used two press-fit bearings spaced apart to better support cantilever loads, and used metal dowels instead of screws for axles.
- For our most recent iteration, we further optimized for both mass production and capability in deployment. We redesigned the gripper to print finished parts with minimal assembly steps. For this gripper, we verified that it was capable of performing dexterous tasks in actuated teleoperation setups.
For our third iteration, we optimized production costs down to $11 per pair. External production quotes hovered at $80–110 per pair, and required large purchase commitments and slow iteration speeds. By keeping production in house, we retain full embodiment control and also achieve otherwise unattainable unit economics.
We iterated on the camera module completely separately from the gripper. We started by choosing an off-the-shelf camera with sufficient hardware capabilities. Though it had the right hardware, the stock software was designed for consumers and not large-scale robotics data collection. We require multi-camera synchronization, strong metadata attachment like task descriptions, the ability to display custom messages and buttons to operators, and a long tail of other software-level needs. To achieve this, we wrote a sophisticated firmware layer for our cameras specifically tailored for data collection.
By separating the camera stack from the end-effector and keeping the manufacturing process flexible, we can introduce new embodiments quickly, without rebuilding the collection system around them. As our robotic platforms evolve, the same infrastructure can support multiple end-effectors in parallel, giving us control over not just the distribution of tasks and environments in our data, but the distribution of embodiments used to interact with them.
Infrastructure
Our data operation creates a lot of data, and we needed an efficient way to manage it. This required setting up a significant amount of dedicated hardware infrastructure to properly ingest data.
We produce over 2 petabytes of UMI footage per month at current rates. In parallel to scaling our UMI operation, we built Hades, a 20-petabyte (and growing) bare-metal storage cluster in a datacenter near our SF office, where we rent rack space and manage the storage ourselves. This arrangement cuts our data storage bill from over $5.2M/year to roughly $100,000 plus a fixed hardware investment that paid itself back in two months.
Hades solved our capacity problem, but we still needed a way to send data from our operation to our storage. Styx is our second storage cluster with roughly a petabyte of local capacity and removes the operational bottleneck of local disk space.
To further reduce bandwidth usage and decrease the latency between ingestion and our research team’s ability to use the data, we built Pallas, a gaming PC with a couple of RTX 5080s. Pallas decodes and reencodes footage at lower resolution at 1.9 times real-time throughput. Combined with private DIA, we drain up to 90 TB per day to rapidly support our training.
Data
We care deeply about three pillars of operational quality: cost, throughput, and distribution. Compared to other solutions like procurement from data vendors, our results give us the optimal tradeoff on these metrics.
Cost. A complete bimanual rig, including three cameras, two grippers, and mounting hardware, costs us approximately $650 per operator. We have a clear path to reducing cost to as low as $100 per kit by further optimizing our choice of commoditized camera hardware to our exact needs and scaling up supply contracts. Coupled with advancements in throughput, our costs have dropped to just $10 per recorded hour.
Throughput. In eight weeks, we collected over one million unique recorded tasks. We saw a dramatic increase in throughput thanks to rapid iterations of firmware, collection formats, our ingest pipeline, and operator experience. Today, we collect over 16,000 unique tasks per day at only 45 operators per shift. At our current pace, we're on track for 12 million unique tasks in 2027.
Distribution. Thanks to freeform collection and Argus, the data distribution of our tasks and environments is extremely diverse. Our current data collection spans over 1 million unique tasks, themselves containing multiple subtasks and annotations each. We also collect a wide variety of world states through in-the-wild collection and annotated failure data through adversarial freeform.
Scaling
With the onset of in-the-wild freeform collection, our operation is immensely scalable. We can employ new operators with minimal operational overhead, cheaply and efficiently manufacture UMI kits, scale ingestion and processing with commodity hardware, and update desired data distributions with scripted tasks distributed directly to operators. We have a clear path to an app-based system of UMI data collection that ingests data from thousands or tens of thousands of unique operators around the world on our custom hardware.
At Pantheon, we're working to create general purpose robotics foundation models, and we believe good models require good data. If you're training robotics models and you want to talk data, reach out to us at data@pantheon.inc.
Claude now works with Google Docs, Sheets, and Slides
Anthropic's Claude is now integrated directly into Google Workspace, allowing users to edit Docs, Sheets, and Slides via a sidebar.
Original article
Claude for Google Workspace™ is now in public beta on all paid Claude plans. It adds Claude to Google Docs, Sheets, and Slides, so that you can work with Claude directly in your open files. Additionally, we are releasing new Google Docs, Sheets, and Slides connectors (beta) that Claude uses to create and edit Google files directly from Claude.
Claude works where you work
With the add-on, Claude opens in a sidebar next to your file, so you don’t need to switch between apps or browser tabs when you work. Claude can read the doc, sheet, or deck you have open, see which text, cells, or slides you’ve selected, and make changes directly in the file.
In Docs, for example, Claude can fix a sentence or restyle a heading in place without touching the surrounding formatting. For bigger rewrites, it can propose edits as suggestion cards in the sidebar. Each card highlights the passage it would change, and you can apply or dismiss it. You can ask Claude to tighten the executive summary of a product requirements document and turn the next steps into a table, and Claude will do both directly in the doc.
In Sheets, Claude can write formulas, build pivot tables and native Sheets charts, and add new tabs. For joins or data cleaning, it can pull a range into Python and write the results back into the sheet. You can start from an empty sheet, attach your source files, ask for a Q3 budget vs. actuals report with a tab for each team and a summary chart, and Claude can flag anything that’s over the budget.
In Slides, Claude can build new slides from your deck’s layouts and themes, so they match the rest of the deck. Then it can check its work and flag elements that overlap or run off the slide, or text that’s hard to read.
You decide how much Claude does on its own. In the default “Ask before edits” mode, each change appears as an approval card with a summary and Claude waits for your approval to make the edit. In “Accept all edits” mode, Claude works through the task and applies changes without stopping.
Your connectors, skills, and enterprise controls come with you
When you are signed in with your Claude account, the sidebar has the same models, connectors, and skills you use in Claude. For example, if you ask for a quarterly business review (QBR) deck for your customer, Claude can pull the account history from Salesforce and recent call notes through your Google Drive connector. If you save the QBR format as a skill, your team can build the next deck following the same format and steps.
On Enterprise plans, controls such as the Compliance API, customer-managed encryption keys (CMEK), and OpenTelemetry audit export apply to the add-on too
Edit Google files from Claude
With the Google Docs, Sheets, and Slides connectors, also in beta, you can start in Claude and it will create and edit your Google files from the chat. Paste a Google file link or ask for a Google doc, sheet, or deck, and on supported setups it will open in a pane beside your conversation. Starting from Claude makes most sense when you need a new file or your work spans several files. Claude’s access matches your existing Google sharing permissions.
Getting started
Claude for Google Workspace is in beta on all paid plans.
Install it from the Google Workspace Marketplace, then open a file and go to Extensions > Claude > Open Claude. Admins can deploy it to their domain or selected groups from the Google Admin console. The Help Center guide covers setup.
To edit Google files from Claude, turn on the Google Docs, Sheets, and Slides connectors. On Team and Enterprise plans, an owner or primary owner needs to enable the connectors first.

AICR v1.0: Open, stable, and verifiable GPU cluster configuration
NVIDIA's AICR v1.0 standardizes GPU-accelerated Kubernetes clusters through version-locked recipes and cryptographically signed validation evidence.
Deep dive
- AICR provides four core capabilities: Snapshot (state observation), Recipe (desired configuration), Bundle (deployment artifact rendering), and Validation (verifiable state checks).
- v1.0 includes a compatibility baseline for CLI, REST API, and Go SDK.
- Integrates with infrastructure-as-code tools like Pulumi and multi-cluster management platforms like k0rdent.
- Addresses version conflicts between host kernels, GPU drivers, networking, and workload frameworks.
- Supports inspection of signed evidence to verify that a running cluster matches the recipe's intended configuration.
Decoder
- GPU-accelerated Kubernetes: A container orchestration setup where worker nodes include NVIDIA GPUs for compute-intensive tasks, requiring specific drivers, device plugins, and software libraries.
- GitOps: An operational framework where infrastructure is managed and reconciled via version control (e.g., Git), often using tools like Argo CD or Flux.
- Gang scheduling: A scheduling technique where a group of related tasks (e.g., distributed training processes) are launched simultaneously on available resources.
Original article
AICR v1.0: Open, stable, and verifiable GPU cluster configuration
GPU-accelerated Kubernetes clusters depend on compatible versions across dozens of components, each on its own release cycle: host kernels, GPU drivers, container runtimes, networking, storage, operators, and workload frameworks.
A configuration that works for one service, GPU generation, and Kubernetes release may silently fail for another, and tracing version conflicts after deployment is slow and error-prone.
NVIDIA AI Cluster Runtime (AICR) addresses this with version-locked, validated recipes for GPU cluster configuration. Each recipe pins the component combinations that work together, renders deployment artifacts for Helm, Argo CD, Flux, or Helmfile, and carries signed validation evidence from the hardware it was tested on.
The v1.0 release of AICR establishes a stable compatibility contract across its CLI, REST API, Go SDK, bundle layout, and artifact schemas so operators, integrators, and contributors can build on AICR’s public interfaces with confidence.
The validation dashboard lets operators find recipes by service, GPU, operating system, workload intent, and optional platform, then inspect each recipe’s status and any published evidence for the hardware configuration tested. Integrators can build against AICR’s public interfaces under the v1.x compatibility policy. Contributors can propose recipes for environments the maintainers cannot test, validate them on their own clusters, and submit signed evidence for maintainer review.
That recipe model is also finding uses across the ecosystem. Pulumi Labs exposes AICR through an infrastructure-as-code provider, while Mirantis’s k0rdent integration packages it for multi-cluster management. Together, they demonstrate the value of defining GPU-accelerated Kubernetes configuration once and consuming it through different tools. Today, AICR has over 100 distinct contributors, with almost half from outside of NVIDIA!
Why GPU cluster configuration needs a reproducible contract
GPU-accelerated Kubernetes clusters depend on compatible versions and settings across host kernels, GPU drivers, container runtimes, Kubernetes, networking, storage, device plugins, operators, schedulers, and workload frameworks. These components follow different release cycles; upgrading one can break a previously working combination. A configuration validated for one service, GPU generation, fabric type, machine shape, and Kubernetes release may fail for another, and small version differences can be difficult to trace after deployment.
Even if every component installs successfully, the cluster may not meet the recipe’s intended configuration. Installation doesn’t confirm that components are healthy, that required capabilities like gang scheduling or accelerator discovery work, or that measured results meet a recipe’s performance thresholds.
Knowledge of which combinations work and how they were validated has lived in separate validation systems, deployment scripts, and operational runbooks. That makes it hard for teams to discover, reproduce, and update working configurations.
Over the past six months, AICR has grown from a handful of recipes to a library spanning major Kubernetes services and the current NVIDIA accelerator portfolio, rendered as deployer-neutral bundles. We added live-cluster validation, signed evidence, public evidence aggregation, and supply-chain verification. For v1.0, we also added committed compatibility baselines and merge-blocking checks around the public integration surfaces.
From observed state to a verifiable result
AICR provides four core capabilities:
- Snapshot records observed cluster state, including Kubernetes, operating system, kernel, GPU, and topology information.
- Recipe describes the desired, version-locked component configuration and the constraints and validation phases that apply to it.
- Bundle renders the recipe into artifacts for the operator’s preferred deployment tooling.
- Validation compares the recipe with observed state and, where declared, runs deployment, conformance, and performance checks against the cluster.
These four capabilities are deliberately independent. A snapshot records the observed state; it is not a desired configuration. A recipe describes the desired configuration; it does not reconcile a cluster. Common open source CD tools like Helm, Argo CD, Flux, or Helmfile apply or reconcile the bundle into the cluster. AICR can then validate the running cluster against the recipe, and record signed evidence of the result.
These capabilities can be combined in multiple sequences. Snapshot data or explicit target criteria can produce a recipe. A recipe can produce a bundle for an existing deployer. The recipe and observed cluster state feed validation. An operator explicitly verifies bundles and evidence when they invoke the corresponding command.
For example, an operator can select EKS, GB300, Ubuntu, training, and Kubeflow; resolve those criteria to a pinned recipe; render the recipe for Argo CD; deploy it through the existing GitOps workflow; and validate the running cluster against the same recipe. The intended configuration does not change if the operator instead renders it for Helm, Flux, or Helmfile.
What’s new in AICR v1.0
AICR v1.0 defines compatibility rules for its public CLI, REST API, Go SDK, bundle layout, and artifact schemas. It also lets operators inspect the validation evidence published for each Supported recipe: what was tested, which checks passed, and who signed the results.
AICR v1.0 sets compatibility rules for:
aicrCLI’s public commands, flags, exit semantics, and structured outputaicrdREST API and OpenAPI contract- exported API of the
github.com/NVIDIA/aicr/pkg/client/v1package - generated bundle layout and AICR artifact schemas
Each public interface has a committed baseline checked before changes merge. The release policy also defines semantic breaking changes. After v1.0, removing or incompatibly changing a stable public interface requires a new major release.
For Go integrators, pkg/client/v1 exposes the supported workflow without requiring imports from AICR’s internal packages. The CLI and REST server use the same facade, reducing the risk that one public entry point behaves differently from another.
Try AICR and contribute
Try a recipe for your environment, inspect its status and any published evidence, and run the dashboard’s aicr evidence verify command where evidence is available. Contributions are especially useful for hardware and cluster combinations outside current project coverage. You can:
- Contribute features, integrations, or documentation
- Propose a recipe for hardware, OS, or a service not yet represented in AICR
- Validate a recipe in your own cluster and submit signed evidence
- Report bugs, share feedback, or request features through GitHub Issues
Start with the project repository, contributing guide, and issue tracker.
Anthropic Expands Verified Access to Cyber Capabilities
Anthropic has tiered its Cyber Verification Program to allow vetted security teams to use powerful models with fewer restrictive safety blocks.
Deep dive
- CVP tiers integrate the previous Project Glasswing into a unified framework with increased eligibility for security professionals.
- Verification is mandatory; Red Team and Specialized tiers involve deeper vetting, often in collaboration with the US government.
- Claude Opus 5.5 in the Red Team tier achieved a 68% success rate on CyScenarioBench, matching unrestricted model performance.
- Anthropic claims to have helped identify over 129,000 verified software vulnerabilities between April and July 2026 using Claude models.
- Enterprise Frontier Safeguards (EFS) will later enable zero data retention configurations for CVP-eligible organizations.
Decoder
- Dual use: Technology that has both civilian and military, or legitimate and malicious, applications.
- Red Teaming: Authorized penetration testing or offensive security simulation to find vulnerabilities in a system.
- SOC (Security Operations Center): A centralized unit responsible for monitoring, detecting, and responding to cybersecurity threats.
Original article
Expanding the Cyber Verification Program
We’re launching a new, expanded version of our Cyber Verification Program (CVP), which makes advanced cyber capabilities and reduced blocking classifiers available to qualifying security professionals. The program now consists of three access tiers, which allow security teams to apply for the level of access that best suits their work. Each tier includes access to our most capable models, including Claude Opus 5.5, Claude Sonnet 5.5, Claude Mythos 5.1, and new models moving forward. Interested customers can apply here.
Cybersecurity is inherently dual use: the same capabilities that enable a security team to find and fix a vulnerability can also help a malicious actor exploit it. For this reason, our generally available models, such as Claude Opus 5.5, Claude Fable 5.1, and Claude Sonnet 5.5, have conservative cyber safeguards that block most cyber work. This is intended to limit the harmful activities malicious actors can carry out using our models, while we continue to work to reduce false positives for secure coding.
But defenders also need access to the best tools and most powerful capabilities to secure their systems. For the past six months, we’ve enabled trusted access through two programs: Project Glasswing and the CVP. The former gave a group of organizations securing the most critical software access to Claude Mythos; the latter gave vetted security teams access to reduced safeguards on Claude Opus and Claude Sonnet models.
Now, we’re integrating these programs into one expanded offering, designed to give more security organizations access to the capabilities they need to protect their systems.
New access tiers
The updated access tiers make specific model capabilities available to security professionals based on the scope of their cyber work. Each has different verification requirements and security controls.
Defense Access is for defensive work, including security operations center and incident response tasks, reverse-engineering malware, and analyzing and validating vulnerabilities. Examples of qualifying organizations include security teams at companies, nonprofits, universities, and government bodies who are defending systems they own or maintain; operators of critical infrastructure of any size, such as regional hospitals or municipal utilities; smaller security firms; open-source maintainers; and individual researchers with a track record of reported vulnerabilities.
We expect many organizations conducting defensive cybersecurity work to qualify for this tier. We aim to respond to applications within a few days.
Red Team Access adds authorized penetration testing and red-teaming to the defensive uses above. Examples of qualifying organizations include in-house red teams, government red teams, and security and penetration testing firms. Organizations in this tier can only perform adversarial testing against systems they are authorized to test, including IT systems in critical industries. Users will still experience real-time blocks on actions that could cause physical harm or mass disruption, such as deploying ransomware, damaging physical systems, or pen testing high-risk safety systems.
Given the increased eligibility requirements and security controls, we expect applications in this tier to take a few weeks to review. Qualifying organizations will be enrolled in the Defense Access tier while we review their Red Team Access applications. Currently, this tier is for organizations only; individual researchers are not eligible.
Specialized Access, which has the fewest cyber blocks, is reserved for a limited set of verified organizations that are authorized to test safety systems that could impact people’s lives or disrupt markets, such as flight operating systems, power grids, telecom networks, interbank transfer infrastructure, and government administrative networks.
For this tier, we currently review every organization in depth in collaboration with the US government. Existing members of Project Glasswing will transition to this tier and do not require reapproval for current models.
Our generally available models can continue to be used for tasks such as code review, patching known issues, vulnerability finding in owned source code, and triage of security alerts.
Data retention is required for organizations enrolled in the program so that we can monitor for cyber misuse. Once Enterprise Frontier Safeguards (EFS)—a new solution that combines the privacy of zero data retention with robust safeguards—is available later this fall, eligible organizations will be able to store data in cloud infrastructure they control. Until EFS is available, organizations with access to Claude Fable 5.1 or Claude Mythos 5.1 with zero data retention can also use CVP with zero data retention. To register interest in EFS, fill out this form.
Testing the efficacy of our tiers
To assess the efficacy of our CVP protections, we ran Claude Opus 5.5 through CyScenarioBench—an evaluation that measures whether models can plan and execute multi-stage cyber operations under realistic constraints—with safeguards tuned for our different CVP tiers. Because this evaluation involves complex, interactive offensive scenarios, we would expect Claude to experience significant blocks both on the generally available model and in the Defense Access tier, while experiencing no blocks in the Red Team Access and Specialized Access tiers.
Across five attempts at each of the 10 CyScenarioBench challenges in each access tier, we found that:
- Without CVP access, every task was blocked on the first prompt;
- In the Defense Access tier, 46 of the 50 trials were blocked at some point in the challenge, while the remaining four tasks succeeded; and
- In the Red Team Access tier, no blocks occurred, and Claude Opus 5.5 successfully completed 34 of the 50 tasks—effectively equivalent to the model’s 67.6% success rate on this evaluation with no safeguards applied (representative of Specialized Access).
These evaluations give us confidence that we can make advanced cyber capabilities safely available to a broader set of defenders, expanding the defensive efforts we began with Project Glasswing. We will continue to refine our tier-based classifiers over time.
Giving defenders the advantage
Through Project Glasswing, we found that Claude Mythos models significantly increased the rate at which organizations were able to identify vulnerabilities in their systems. Through the program, our partners uncovered at least 129,000 verified software vulnerabilities between April and July 2026. And through our own open-source scanning efforts, we found an additional 5,500 verified software vulnerabilities between April and October 2026. Of these verified vulnerabilities, more than 33,000 have so far been rated as critical- or high-severity. This is likely an undercount, as it is based on survey data from only a subset of Glasswing partners. As such, we expect the true impact to be at least five times higher.
When asked how long it would have taken them to find the same number of vulnerabilities without Claude Mythos models, several partners told us that the models had increased their rate of vulnerability finding by months or even years. Read more from our partners at Booz Allen and Comcast about their experience.
The changes we’re making to our Cyber Verification Program today are intended to extend the impact of Project Glasswing to a much larger number of cyber defenders. We’re also continuing our efforts to help secure open-source software and critical infrastructure. In the coming weeks, we’ll share more about this work and what we’ve learned as we continue to work to give defenders a permanent advantage.
Apply for access
Interested organizations can apply to CVP here. As part of the application process, we will verify all applicants and request proof of the required security controls for the relevant access tier. Existing CVP members will keep their current settings for previous models and will be automatically evaluated for access to Claude Opus 5.5, Claude Sonnet 5.5, and Claude Mythos 5.1 through the updated program. Admins will need to assign access to specific workspaces by following these steps.
CVP is available on the Claude Platform, Google Cloud’s Vertex AI, and Microsoft Foundry. CVP is only available on Amazon Bedrock for customers eligible for Enterprise Frontier Safeguards.
If you’re blocked on work you think your tier should allow, you can report it here. Full details on each tier can be found in our Help Center.
Anduril's Big Week: Arsenal-2, NGC2, and a $6.6B Bet on the Future of American Shipbuilding
Anduril is building a 2-million-square-foot shipbuilding factory in Baltimore backed by a $6.6 billion investment to scale its Lattice command and control system.
Decoder
- Lattice: Anduril’s software platform that automates sensor fusion and command-and-control for autonomous military hardware.
Original article
Anduril recently announced that it was awarded a contract worth up to $1.8 billion over five years to scale Lattice across the Army's Next-Generation Command and Control effort. The company plans to build the second of its Arsenal mega-factories in Baltimore. The mega-factory will be shipbuilding-focused and will, when operations begin in 2030, span over 2 million square feet of manufacturing space. The facility will be backed by $6.6 billion across both private investment and up to $2.9 billion through a submarine production contract with the US Navy.
A New Trend in Nuclear Energy: Squeezing More Power Out of Old Plants
Tech giants are funding billion-dollar upgrades to existing nuclear reactors to secure clean power for data centers, adding 8,000 megawatts to US grids.
Original article
Building nuclear power plants takes a long time, so some companies are looking to upgrade older reactors to squeeze even more power out of them instead. These types of upgrades can cost billions and require approval by regulators, but they can often be completed in five years or less at a fraction of the cost of building a new plant from scratch. Many tech giants are eager to pay for these upgrades to power AI. Increasing production from existing nuclear plants will add an estimated 6,000 to 8,000 megawatts of electric capacity to US grids.
Decisions
OpenAI launched the public beta of its Decisions API, allowing applications to get typed answers 10x faster than standard response models.
Decoder
- Predicate: A specific type of query used in the Decisions API to return a probability (0-1) for a yes/no condition.
- Rubric: A set of ordered scoring levels used to evaluate an input against specific quality or severity criteria.
Original article
Full article content is not available for inline reading.

How to keep learning in the age of LLMs
Shift your AI usage from 'answer-seeking' to 'mentorship' by using Socratic questioning and structured task planning to boost long-term retention.
Deep dive
- Use Socratic questioning to debug code instead of asking the AI to fix it directly.
- Break complex projects into phases with a 'done when' criteria and a explicit trap warning for each.
- Implement visual feedback loops like REPLs or CLI dashboards to maintain motivation.
- Utilize spaced practice by working in short, consistent sessions to combat procrastination.
- Treat the LLM as a tool for research and boilerplate, not as a replacement for architectural design.
Decoder
- LSM-tree (Log-Structured Merge-tree): A data structure commonly used in databases to provide fast write operations by buffering updates in memory before flushing them to disk.
- REPL (Read-Eval-Print Loop): A computer environment that takes single user inputs, evaluates them, and returns the result, commonly used for rapid prototyping.
Original article
I want to talk about how I keep learning new things in the age of LLMs, because it got really hard. LLMs, AI, agents, whatever you want to call them, can one-shot stuff and kill the entire joy of getting something wrong. I’m mostly talking about programming here, but I think it applies to anything. We used to learn new things like frameworks, programming languages, and patterns by doing something wrong first and then taking a lesson out of it. But now everything is so fast that we don’t want to spend time doing the wrong things, even though it’s more beneficial for us in the long run. That struggle is how your brain actually learns new things.
To be frank, I’m guilty of this myself. I used to grind a lot to learn stuff, but now it feels pointless because an LLM can give you whatever you want. All those thoughts brought me here, because I’d hit a plateau, and I needed to learn more stuff, both for professional needs and for fun. Here is how I rediscovered how to learn in the age of LLMs.
I was reading a paper called Bitcask. If you haven’t already, I advise you to read it if you’re into programming. It’s a super lightweight paper that you can read even without being a seasoned programmer, because the concepts are really easy to digest and implement if you are up for it. Anyway, so I started reading that paper and wanted to implement it without any assistance from LLMs, which I did, mostly. I got stuck somewhere in the code and wanted to use an LLM, but this time not to code the part where I got stuck, but to explain the concept clearly so I could do it myself. Then I realized I could just use the LLM to teach me stuff without it giving me all the answers. And it can do all the grunt work, so I don’t get bored. Let’s say you want to build a chat app to learn something. You need two things, a server and a client, and let’s say you just want to practice how the server part works. Why would you kill your motivation implementing the client if it doesn’t interest you? This is where the LLM comes in handy. You can let the LLM do the boring parts for you, like tests, tooling, and visualization. I don’t mean those are useless in any way. I’m just saying if they don’t interest you, don’t bother doing them yourself.
So I started looking at how other people do it, and found a skill called “socratic-code-mentor”. It doesn’t hand you the answer. It asks the right questions, so you reach the answer yourself, and that’s what makes it stick.
Here’s a simplified example:
Me: My sum should be 6, but I get
NaN:const nums = [1, 2, 3]; let sum = 0; for (let i = 0; i <= nums.length; i++) sum += nums[i]; console.log(sum); // NaNLLM: How many items are in
nums, and what is the last index?Me: Three items, so the last index is 2.
LLM: Which values of
idoes your loop run with?Me: 0, 1, 2, 3… oh.
nums[3]isundefined, and6 + undefinedisNaN.LLM: Right:
index:   0  1  2  3
nums:   [1, 2, 3] undefined
i:       ▲  ▲  ▲  ▲  ← one step too far
How would you fix it?
Me: Use
i < nums.length.
So the LLM didn’t just tell me “your loop runs one step too far”. It asked a few questions and drew one picture, and I found the bug myself. I won’t forget it, because it forced me to think it through on my own.
We learn by working things out, not by accepting every fact we’re given. Make It Stick (great book, btw, if you’re into the psychology of learning) says it well:
“When you’re asked to struggle with solving a problem before being shown how to solve it, the subsequent solution is better learned and more durably remembered.”
Even my beloved friend and CTO plays these mind games with me. When I ask “Why don’t we do it like X?”, he replies “Why do you think we should do X?” I explain my reasoning, he asks another question about my answer, and eventually I land on a proper answer myself. And it sticks.
So you have to exercise your brain a bit. That’s exactly what this skill does, it makes you question things.
The second problem is keeping your spirits up, and that takes discipline. If you’re building a non-trivial project to learn something, you won’t finish it overnight. So plan what you need to achieve beforehand, and you won’t waste time figuring out what to work on next. Otherwise, you’ll start your next session by staring at a blank screen for 30 minutes. At least I do. We tend to procrastinate when we’re unmotivated or undisciplined.
The goal is that you sit down at your computer, tell your LLM “Let’s continue”, and it takes you from where you left off. Surprisingly, LLMs are really, really good at making goal lists for you.
Say you want to build a toy LevelDB, or in plain words, an LSM-tree (if you’re not a programmer and still reading this, I’m sorry). Ask your LLM to split it into phases with clear goals. Then every time you start a new session, you get to tick a box.
After Bitcask, I wanted something harder and database-related, so I started building an LSM-tree and called it tinylsm (I’ll probably keep doing my tiny-xyz projects). Here’s a trimmed version of the PLAN.md I used for tinylsm:
# tinylsm — Build Plan

**Golden rule:** every phase ends with a working system and green tests.
Never two half-built features at once.

## Phase 2 — WAL (write-ahead log)

**Goal:** survive crashes. Every write hits the log before memory,
so after a crash we replay the log and lose nothing.

**Steps:**

1. Encode/decode one record.
2. Append records to a file.
3. Replay the file on startup; stop cleanly at a half-written last record.

**Done when:** kill the process mid-write, restart, every finished write is back.

**Trap:** a crash can cut the _last_ record in half. That's expected, not corruption.

## Progress

- [x] Phase 1 — Skiplist
- [x] Phase 2 — WAL
- [ ] Phase 3 — Memtable
- [ ] ...
Every phase has the same four parts, a goal, small steps, a “done when” you can actually check, and the trap that will bite you. The checklist at the bottom is the “let’s continue” part, the LLM reads it and knows where you are.
That way you don’t have to spend any willpower deciding what to do, and kick-starting yourself takes more effort than you might think. It’s even harder now, with the constant dopamine hits from LLMs, Shorts, and the rest. We want things done, and fast. A plan gives you exactly that. Even when you’re worn out, you can do a tiny bit and call it a quick win.
And working this way actually teaches you more, because you keep coming back to the same project in short sessions, spread over days and weeks. It’s like Zen master Shunryu Suzuki’s image of walking through fog: you don’t notice you’re getting wet, but you get wet little by little. Psychologists call this spaced practice: a little forgetting between sessions forces your brain to pull things back up, and that effort is what makes them stick.
So far we’ve covered how to use an LLM properly for learning instead of one-shotting the solution, and how to plan so we don’t procrastinate forever. But one thing is still missing.
Personally, I enjoy what I do much more when I get visual feedback. It can be a half-assed UI, a REPL, whatever. It forces me to stay in the game and stay curious about what comes next. For tinylsm, I had the LLM build a tiny REPL where I could fill the database, watch tables pile up, and benchmark reads:
tinylsm> bench
  miss latency vs L0 height
    88 tables ██████████████████████████████ 174.9µs
     1 table  ░░░░░░░░░░░░░░░░░░░░░░░░░░░░░░   1.7µs
Not gonna lie, seeing my own compaction code make reads 100× faster did fuel my motivation.
I’d advise you to do the same on your next big project. The skill I’ll share at the end of the post does this too, but just use your imagination. With LLMs, you can build whatever motivates you to go further.
Last piece of advice: make your next project an ambitious one. Before LLMs, implementing something like an LSM-tree meant digging through a bunch of GitHub repos and reading specific sections of specific books. Now you can just say “I want to learn how XYZ works”, and the LLM will research it and find you whatever you need. So in a sense, things got easier, but we got lazier. I guess that was always the case. We love getting lazy.
Wrapping Up
Sort of a TLDR for lazy people like me:
- Don’t use the LLM to give you answers. Use it as your mentor.
- Let the LLM do your grunt work: tests, tooling, and so on.
- Plan beforehand with the LLM, so you stay motivated with the least amount of willpower. We already have so little of it nowadays.
- Make progress visible: a REPL, a chart, anything that keeps you in the game.
- Aim for quick wins. Even if you only work 30 minutes a day, it’s better to be consistent than to go hard for 2 days and come back 10 days later.
- Stay curious, and try to learn things beyond your grasp. Even if you’re not the brightest one out there, you can tell the LLM “I don’t understand” 100 times, and it will explain it again. So don’t settle for easy stuff.
Here’s the skill I use: socratic-code-mentor. I found the original, then reshaped it around how I learn. Take it, and change it to fit you.
Let me end with a quote I try to live by:
“When you do something, you should burn yourself completely, like a good bonfire, leaving no trace of yourself.”
— Shunryu Suzuki

Stack Overflow Developer Survey 2026
The 2026 Stack Overflow Developer Survey reveals rising burnout and unhappiness, with 33% of developers dissatisfied as they transition from coders to 'manager of agents'.
Deep dive
- 33% of respondents report unhappiness; 45% feel complacent.
- Freelancing increased from 3.9% to 10.5% in one year.
- 80% of developers use AI for at least one hour daily.
- Trust in AI is conditional: 48% trust it only when they can personally verify the output.
- 64% of developers visit Stack Overflow less for simple questions due to AI.
- 75% of developers spend over five hours searching for context that is often incomplete or outdated.
Original article
More than 30K technologists from 169 countries have shared their thoughts with us, and now it’s time to share everything we’ve learned with you. So let’s dive into this year’s Annual Developer Survey.
In the whirlwind that has been the last year of technological innovation and market uncertainty, we don’t blame you if you’re feeling burnt out. If keeping up with the latest and greatest in the tech world has been difficult for you, have no fear, because the Stack Overflow Annual Developer Survey is here!
For the sixteenth year, we’ve asked developers and technologists about everything from how they’re using AI to how happy they are at work to where they’re learning new skills. This year’s survey boils down to one question: How are you doing?
- 30,903
- Responses
- 169
- Countries reached
- 467
- Technologies examined
“AI has the potential to reshape the entire software and product development life cycle, but realizing that potential requires a foundational change to workflows, roles, and ownership.”
Stack Overflow CEO Prashanth Chandrasekar recently spoke to Computing’s Ctrl Alt Lead podcast about why this might be the case: “With AI, every individual becomes almost a manager of agents. That's a sea change from just an individual that's writing code.” It seems that agents are superpowering some developers' work, making it easier for them to set a solo course backed up by their own team of agents—instead of taking their decreasing satisfaction at work on the chin.
“AI is forcing software organizations to document the judgment they previously relied on people to supply.”
What is Codemode
Codemode allows LLM agents to execute complex, concurrent JavaScript logic directly within the harness, bypassing the limitations of standard CLI-based tools.
Deep dive
- Codemode runs in a sandboxed JavaScript runtime (QuickJS/WASM) on the host side, distinct from the target environment (e.g., the bash sandbox).
- It enables concurrency, allowing agents to issue multiple non-blocking calls, such as processing batches of GitHub issues.
- State persistence allows agents to stash data into the session transcript, bridging the gap between independent tool invocations.
- It addresses binary data limitations by letting the agent directly interact with image and classification APIs.
- Codemode creates a bridge for MCP servers to return structured JSON responses rather than raw text.
Decoder
- Harness: The host application or runtime that manages the LLM's interactions, tool definitions, and environment state.
- MCP (Model Context Protocol): An open standard for connecting AI assistants to data sources and development tools.
- Stash: In this context, the ability to store intermediate session data that can be retrieved in subsequent agent turns.
Original article
What is Codemode
More than a year ago I wrote a few posts here that recommended people not to load custom tools into their context (or MCP servers) but to just use more scripts. Most importantly I wrote that Code Is All You Need and I wrote about that MCP needs code. With Pi 1.0 we now added MCP support via Codemode which in some ways is a long time coming, but then also maybe somewhat surprising to some. So I want to share some updated thoughts on this blog on what this all means.
What Are Tools
When a harness like Pi provides tools for an LLM to call, it does so by supplying some tool definitions which then translate into some token structure on the server side. Whether a model is encouraged to call a tool is the result of the reinforcement learning process. Something I wrote about before if you want to learn more.
One of the reasons we strongly lean towards CLI and bash is because it allows easy composition of calls, and because the model also learns how the file system works when it’s trained. So when it invokes a tool like echo foo > /tmp/test.txt the model also learns that after that tool call, there is now a file called test.txt in /tmp.
However bash has one fundamental limitation which is that it can only compose programs that run. And there are some things, which are not programs, but native tools to the LLM and they sort of have to be.
The most obvious example here is read or view_image. If a multimodal model needs to read an image, it cannot use cat for that because the harness needs to inject the actual image payload into the protocol of the LLM.
Another quite vivid example are sub agents. In order to spawn and orchestrate sub agents, it’s tricky to avoid tools that are provided by the harness. While in theory the agent could provide a CLI tool that talks to the outer harness via environment variables and Unix sockets, it’s a rather crude process. It however has another issue, and that is where the code runs.
Brains vs Hands
To better understand that, it’s important to think a bit more about where all the bits and pieces run. There really usually are two different systems involved. The first is the brain, the harness: it runs on one machine. It’s trusted. The second is often the same machine, but it’s really where the tools are executing: the hands. In Pi we now call this the execution environment, but you can think of it as the target of all the operations.
Crucially what is important for us, is that there is a dividing line between the harness brain and the target environment that runs bash and executes the tools.
And splitting this in half has some really important consequences. For a start it means that they are running on different file systems and they have different levels of trust. If you for instance use a sandboxing solution like Gondolin your bash stuff will be sandboxed just fine, but the harness itself will not be.
Orchestrating The Harness
Which brings us to what Codemode really does: it’s a way for the LLM to express and orchestrate complex operations on the harness side, but not the execution environment side. Codemode runs in the harness, in its own sandbox. In case of Pi it’s running in QuickJS within a WASM runtime with intentional limitations: no network, no file system, no timers, limited RAM. The only way is to call more tools. You could also imagine that Codemode could run Scheme or some other language as well.
If you are not familiar with Codemode, it’s basically just a way to issue tool calls from within some language, in our case JavaScript. That allows you to compose those calls without necessarily going through the LLM’s context. Credit for naming goes to our friends at Cloudflare who coined it.
For instance if you issue a bash call as a regular tool call in the LLM, then we only throw the trailing 2000 lines into the context and if the agent wants more, it needs to look at the overflow file itself. If however the agent issues that invocation via Codemode, then the Codemode side gets larger outputs sent structurally.
Most importantly, because Codemode is JavaScript the agent can express concurrent operations and basic workflows. A common way in which you see agents now use this, is to first probe at 5-10 items from some tool response to see what it looks like, and to then write a Codemode script that processes the next n items.
Codemode also allows you to throw state into the transcript! That means that one Codemode invocation can stash away data, that the next call in the session can load again. And remember: this is on the harness host, not the sandbox.
In case of Pi, Codemode also allows you to issue calls that naturally do not make any sense in Pi’s traditional interface. For instance if you want to generate images with an image model or you want to classify some text with a one shot classifier model, those Pi APIs are exposed via Codemode, but not via regular tools where they would just waste context.
What It Looks Like
So now that we talked a bunch about it, it’s probably worth being a bit more explicit about it. Let’s walk ourselves through some invocations of Codemode of recent Pi sessions of mine. Note that none of this code is human written. It’s from real sessions of Pi, just re-indented for your viewing pleasure. The agent starts using Codemode automatically either because it’s a task where the model already naturally picks up that tool, or because a user asked it to.
Note that Codemode is by default only enabled in Pi when MCP is enabled, but you can turn it on with "defaultTools": ["+codemode"] in the settings. Just ask Pi to enable it for you.
Generating Images
Let’s start simple with image generation. Image generation is a feature that Pi supports in the AI SDK core, but it’s not a tool that the agent can use. In the past the only way to use image models has been to write a bespoke extension or to have the agent run node itself and use the internal image APIs. However because we expose quite a few of the internal model APIs within Codemode, it means that the agent can use it:
const [painter] = await models.getAvailableOfType("image");
const result = await models.generateImages(painter, {
  input: [{ type: "text", text: "A cute little puppy sitting on a grassy " +
    "lawn, soft natural light, photorealistic" }],
});
if (result.stopReason !== "stop") return result.errorMessage;

for (const block of result.output) {
  if (block.type === "image") image(block);
  else text(block.text);
}
Note that the call to image() sends the image back as image content to the LLM. On the harness side it feeds it directly into both the agent, as well as onto disk as a temporary artifact in case the agent wants to be able to pass that image back to bash.
Classifying Things
Similar things apply to classifier models such as Jev. They also do not fit well into the workflows of an agent through the typical tools. But rather than making a bespoke tool available, Codemode just allows the agent to reach into the AI SDK and invoke those directly. Here you can see how Jev is used to mass process GitHub issues for a quick sentiment analysis:
const jev = await models.getModelOfType("classifier", "typesafe", "jev-latest");
const r = await tools.bash({
  command: "gh issue list --state open --limit 100 " +
    "--json number,title,body,comments",
});
const issues = JSON.parse(r.output);

const results = await Promise.all(issues.map(async (issue) => {
  const res = await models.classify(jev, {
    state: {
      title: issue.title,
      body: (issue.body || "").slice(0, 4000),
      comments: issue.comments.slice(-5).map(c => c.body.slice(0, 800)),
    },
    questions: {
      sentiment: {
        type: "choice",
        instructions: "What is the overall sentiment of the author towards pi?",
        criteria: {
          positive: "Appreciative, happy, constructive praise",
          neutral: "Matter-of-fact report or request without emotion",
          negative: "Frustrated, annoyed, upset, or angry",
        },
      },
      frustration: {
        type: "score",
        instructions: "How frustrated is the reporter?",
        criteria: ["not at all", "mildly", "clearly frustrated", "very angry"],
      },
      kind: {
        type: "choice",
        instructions: "What kind of issue is this?",
        criteria: {
          bug: "Bug report or regression",
          feature: "Feature request or enhancement",
          question: "Question or support request",
          other: "Docs, discussion, meta, spam",
        },
      },
    },
  });
  if (res.stopReason !== "stop") {
    return { n: issue.number, title: issue.title, error: res.errorMessage };
  }
  return { n: issue.number, title: issue.title, ...res.answers };
}));

store("sentiment_results", results);
return results
  .filter(r => !r.error)
  .sort((a, b) => b.frustration.score - a.frustration.score)
  .slice(0, 12)
  .map(r => `#${r.n} ${r.frustration.score.toFixed(2)} [${r.kind.choice}] ${r.title}`);
Note how in that above example we also call store() which dumps the result of that execution into the session transcript. A future invocation of Codemode can thus read back that result if it wants to.
The Promise.all here is fine, because Pi limits the total number of concurrent tool executions itself to four and maintains a queue for the rest.
A more adventurous example is to use Jev to drive a game engine for debugging purposes:
Here it knows about my tankctl command and it built itself quickly a minimal harness around it to drive a game loop to assist a user with debugging a problem. Note how it built a 30 step loop in which each step goes back to both the game engine to get a text dump of what’s going on, and then to Jev to determine what to do next:
const jev = await models.getModelOfType("classifier", "typesafe", "jev-latest");
const tank = async (cmd) =>
  (await tools.bash({ command: `tools/tankctl "${cmd}"` })).output;
await tank("start --map assets/maps/night_arena.map");

const questions = {
  action: {
    type: "choice",
    instructions: "You control the tank '@' in a top-down tank game. " +
      "Choose the best next action.",
    criteria: {
      attack: "an enemy has line of sight to you and you can fire at it",
      approach: "no enemy has line of sight; drive toward the nearest enemy",
      dodge: "an enemy shot is heading at you and will hit soon",
      powerup: "a powerup is close and no enemy threatens you",
    },
  },
};

function commandFor(choice, st) {
  const p = st.player;
  const enemy = st.enemies.filter(e => !e.dead)
    .sort((a, b) => (b.los - a.los) || (a.dist - b.dist))[0];
  if (choice === "attack" && enemy) {
    return `fire_at tank ${enemy.id}; frames 30 until clear,damage,kill`;
  }
  if (choice === "dodge") {
    // move perpendicular to the closest incoming shot
    const s = st.projectiles.filter(s => !s.yours)
      .sort((a, b) => a.eta - b.eta)[0];
    const dir = s && Math.abs(s.vel[0]) > Math.abs(s.vel[1])
      ? (p.pos[1] > s.pos[1] ? "+down" : "+up")
      : (p.pos[0] > (s ? s.pos[0] : 0) ? "+right" : "+left");
    return `input ${dir}; frames 20 until damage; input stop`;
  }
  const powerup = st.powerups.filter(u => u.available)
    .sort((a, b) => a.dist - b.dist)[0];
  if (choice === "powerup" && powerup) {
    return `goto ${powerup.pos[0]} ${powerup.pos[1]} 180`;
  }
  return enemy ? `goto ${enemy.pos[0]} ${enemy.pos[1]} 90` : null;
}

const log = [];
for (let step = 0; step < 30; step++) {
  const st = JSON.parse(await tank("state"));
  if (st.state !== "playing") break;
  const threats = st.projectiles
    .filter(s => !s.yours && s.miss_dist < 1.5 && s.eta < 1.5)
    .map(s => `incoming shot dist ${s.dist} eta ${s.eta}s`)
    .join("\n") || "no incoming shots";
  const r = await models.classify(jev, {
    state: { map: await tank("view 8"), threats, hp: st.player.hp },
    questions,
  });
  if (r.stopReason !== "stop") {
    log.push(`#${step} classifier error: ${r.errorMessage}`);
    break;
  }
  const choice = r.answers.action.choice;
  const cmd = commandFor(choice, st);
  if (!cmd) break;
  log.push(`#${step} hp=${st.player.hp} ${choice} -> ${await tank(cmd)}`);
}
return log.join("\n");
Calling MCP Servers
Lastly, Codemode obviously is great for calling MCP servers. And because we do not actually expose any of the MCP tools to the LLM, the agent first uses provided APIs to issue a tool search within Codemode to discover what it might be able to do with the connected servers. This form of progressive discovery makes the whole MCP business work well enough for a lot of use cases today.
Here for instance you can see the agent reach for the Sentry MCP straight away, even without discovering the tools, presumably because it has learned during the RL process already about what the Sentry MCP looks like. But it learns from what we inject into the system prompt, that the Sentry server is available to begin with. It’s not completely guessing here.
const orgs = await tools.mcp__sentry__find_organizations({});
const { organizations } = orgs.structuredContent;
const results = await Promise.allSettled(organizations.map(org =>
  tools.mcp__sentry__find_projects({
    organizationSlug: org.slug,
    regionUrl: org.regionUrl,
  })
));
return organizations.map((org, i) => {
  const r = results[i];
  if (r.status !== "fulfilled") return { org: org.slug, error: String(r.reason) };
  if (r.value.isError) return { org: org.slug, error: r.value.content };
  return {
    org: org.slug,
    projects: r.value.structuredContent.projects.map(p => p.slug),
  };
});
Modern MCP Is A Fight
I really don’t want to talk too much about MCP here, but MCP is in fact a protocol that greatly benefits from Codemode. The problem in parts is that MCP in practice often targets harnesses that do not (yet?) use Codemode. But the tide is shifting. In the meantime, a temporary crutch has been to do what Cloudflare did, and do Codemode within the MCP server. But now we have Codemode in Codemode which is pretty bad. It means double JSON escaping, easy for smaller models to get confused by and the inner code cannot call the outer tools. So if you for instance use the Cloudflare MCP servers in Pi, the agent needs to write JavaScript and funnel it through more JavaScript. This is really not optimal, but it’s also understandable that this is happening:
const accRes = await tools.mcp__cloudflare__execute({
  code: `async () => {
    const r = await cloudflare.request({ method: "GET", path: "/accounts" });
    return r.result.map(a => ({ id: a.id, name: a.name }));
  }`,
});
const accounts = JSON.parse(accRes.content.map(c => c.text).join(""));

const out = [];
for (const account of accounts) {
  const r = await tools.mcp__cloudflare__execute({
    account_id: account.id,
    code: `async () => {
      const r = await cloudflare.request({
        method: "GET",
        path: \`/accounts/\${accountId}/workers/scripts\`,
      });
      return r.result.map(s => ({ id: s.id, modified: s.modified_on }));
    }`,
  });
  out.push({ account: account.name, workers: r.content.map(c => c.text).join("") });
}
return out;
MCP Desires
So to end things off: how well does Codemode work with MCP today? Well … not amazingly well. That’s because MCP servers are not really targeting harnesses that use Codemode yet (though at this point I think most harnesses support it).
For this to work well some recommendations:
- Structured content: Codemode wants calls to return some nicely formatted JSON. So that needs to come back from the server, and many don’t do that yet. The
outputSchemasystem in MCP is great for that. - Consistent results: an interesting failure case is when an MCP server does not return consistent data. For instance because it tries to token optimize things depending on how many items are in the result set. This can cause an initial probe with 5 items to succeed, but then fail when the server returns the maximum batch size.
- Large binary data: today MCP does not yet support large binary data so quite a few use cases that are really interesting do not work well at all yet. You end up with all kinds of weird workarounds such as pre-signed URLs to allow file uploads then to happen through non MCP channels.
- Composable tool search: the MCP server might know better than the MCP client which tool is appropriate for a task. But there is no good mechanism today that allows a harness to fan out tool searches across multiple MCP servers. It’s all emergent behavior and it does not scale well to multiple active servers.
Future of Codemode
So where does this leave us? Is this a reversal of what I wrote a year ago where I encouraged CLIs? I don’t think so. In fact, the MCP ecosystem from my perspective picked up on exactly what we pointed out a year ago works: code. But Codemode goes beyond MCP in that it can act as a capable mechanism within the harness to express more freedom for the agent.
There are however also some things that we still need to figure out. For one, durability with Codemode is trickier. We might have to adopt some ideas from durable workflow engines here to snapshot invocations. Or maybe, something like Starlark is a better composition language than JavaScript given its deterministic nature.
Images, binary data and just the inability of this pattern to work with smaller models is also something that needs to be fleshed out. So it’s for sure not a perfect solution yet, but it’s quite a useful pattern that I expect us to leverage more.
A Terminal Protocol for Program Status (OSC 7501)
Mitchell Hashimoto has proposed OSC 7501, a universal terminal escape sequence standard to help programs communicate their execution status directly to the terminal emulator.
Deep dive
- Objective: Eliminate reliance on screen scraping and window title regex for tracking program state.
- Design: Uses a standard OSC (Operating System Command) escape sequence structure for cross-platform compatibility.
- Data Format: Uses colon-separated key=value pairs, prioritizing portability and ease of parsing.
- Capabilities: Supports nested/hierarchical task tracking, meaning a tool can track both a high-level deploy process and sub-processes like database migrations simultaneously.
- Implementation: Currently supports libghostty and Rex, with proof-of-concept integrations for Terraform, Claude Code, and Homebrew.
- Safety: Designed so that unknown sequences are ignored by standard terminal emulators, ensuring backward compatibility.
Decoder
- OSC (Operating System Command): A type of terminal escape sequence (starting with ESC ]) used to send control information from the application to the terminal emulator.
- PTY (Pseudo-terminal): A bidirectional communication channel that allows programs to interact with a terminal; the mechanism that allows CLI tools to "talk" to your shell.
- Heuristic: A practical, often rule-based approach used to guess program state when formal data is unavailable (e.g., matching a spinner character in a window title).
Original article
A Terminal Protocol for Program Status (OSC 7501)
I wrote a specification for a new terminal escape sequence: OSC 7501, the Program Status Protocol. It lets any program tell the terminal what it's doing: idle, working, waiting on the user, finished, or failed, and why.
For example, here is how Terraform could indicate that it is blocked waiting for user input, with the message "Apply 3 to add, 1 to change, 0 to destroy?" (base64-encoded). A terminal (or any other tool running Terraform) could show this information however it feels appropriate: a notification, an inbox, a status icon, etc.
ESC ] 7501 ; state=blocked:kind=permission:app=terraform:msg=QXBwbHkgMyB0byBhZGQsIDEgdG8gY2hhbmdlLCAwIHRvIGRlc3Ryb3k/ ESC \This post covers why I think this protocol needs to exist, why the existing approaches aren't good enough (especially for coding agents), and how the protocol works.
This is a completely generic, terminal-native specification and protocol. It emerged from my work on Superlogical and Ghostty but the specification has no product-specific functionality or language. It is designed as an idiomatic, well-formed specification that any terminal developer will find familiar.
The Problem
Long-running work is common in terminals: builds, deployments, package upgrades, data processing, and, more and more today, coding agents. These programs alternate between working on their own, waiting on the user, and finishing. Meanwhile, users usually go off and do something else and want to know when the work finishes or needs them.
Aspects of this problem have been solved in various ways going back decades. For example, some terminals monitor the active foreground process and have features to notify when it changes. Or, they wait for some time period of "quiet" (for various definitions) output. The specification also lists the reasons why existing sequences aren't enough.
Ultimately, I felt there wasn't a cohesive, interaction-agnostic, generic solution to this problem that conveyed progress, blocking, completion, and trees of tasks. And it wasn't possible to cobble together pre-existing sequences to achieve it robustly, either.
Singling Out "Agentic Inboxes"
Don't care about AI, LLMs, etc.? Skip this section. The problem is generic and applies in a compelling way without bringing in AI. It's particularly nasty with AI so I want to call it out, but if you don't care about any of that, just skip this.
It's now increasingly common for people to run many long-running agents for any number of reasons: background research, issue monitoring, bug fixing, large features, etc. Each one works for a while and then stops to ask for permission, ask a question, or report it's done.
From this, a new category of tool has emerged that I'll simply call the agentic inbox: a single view across every running agent showing which are working, which are done, and which are waiting on you. Herdr, cmux, and Agent Deck are a few examples of hundreds.
Without a dedicated protocol, they solve the agent status problem in two ways: heuristics and non-terminal APIs.
Heuristics
The first approach is to guess by reading the screen or the window title and matching it against known patterns.
Herdr is a good example because it does this well and documents it openly. Its detection manifests are TOML rules that classify an agent as idle, working, or blocked. Here is the first of 16 rules for Claude Code:
[[rules]]
id = "osc_title_working"
state = "working"
priority = 1100
region = "osc_title"
visible_working = true
# Braille covers <= 2.1.227; half-circles are the 2.1.228 busy spinner.
regex = ['^[\x{2800}-\x{28FF}\x{25D0}-\x{25D3}] ']
Claude Code is considered "working" if its window title starts with a Braille spinner character or, as of version 2.1.228, a half-circle one. The history of that file shows ten changes in three months for just Claude Code.
This isn't a criticism of Herdr. Its maintainers are doing the best possible job with the tools available. But it demonstrates well the benefit a unified protocol would have.
Non-Terminal APIs
The second approach is to have the program report its own state through an inbox-specific, out-of-band API such as Herdr's socket API or cmux notify. This is better than heuristics in some ways, because the program that actually knows its state is the one reporting it. But every program has to integrate with every inbox separately, and a local socket doesn't work over SSH or from within a container without extra bridging. The pty already works across all of this.
The Program Status Protocol
OSC 7501 is a terminal native answer to this problem. The program reports its own state directly via the pty that it always has, using a format that is safe to send everywhere (well-behaved terminals ignore unknown OSCs).
The body of the sequence is a list of key=value pairs separated by :. The only required key is state, which is one of:
state |
Meaning |
|---|---|
idle |
At rest, waiting for the user's next instruction. |
working |
Running. May include a progress percentage. |
done |
Finished. The result is ready and the user hasn't seen it yet. |
blocked |
Can't continue until the user does something. kind says what (permission, question, or auth) and msg says why. |
error |
Failed and stopped. |
Optional keys include app, a stable machine-readable program name like cargo or claude-code, and msg, a single human-readable line encoded as base64.
Programs that run several things at once can report multiple records using hierarchical ids. A deploy tool can be working at the root while us-east pushes an image at 40% and eu-west is blocked waiting for approval to deploy to production. Both are true at the same time, and the terminal decides what to show. A clear state removes records.
Here's a complete integration for a shell script to wrap rsync to participate in this protocol:
status() {
  printf '\e]7501;state=%s:msg=%s\e\\' "$1" "$(printf '%s' "$2" | base64 | tr -d '\n')"
}
status working "Syncing photos"
rsync -a ~/Photos backup:/photos && status done "Photos synced" || status error "rsync failed"
Trivial to script with plain old POSIX sh. No SDK, no sockets, no environment variables, no JSON. No bias towards specific GUI presentations. No bias to any specific workload (like AI). A well-formed, generic foundation to build functionality above that anyone and everyone can participate with.
The full spec covers the rest: record lifetime, feature detection, terminfo, size limits, and security. It's short. I wrote it all by hand. Please read it.
Implement It
I wrote this specification based on my experience maintaining a terminal emulator for many years now. It is written in a way that is easy for application developers to emit, and easy for terminal emulators to consume and parse.
I've already implemented this protocol twice. We have one implementation in libghostty and I have a parallel implementation in Rex. I've also implemented it as a proof-of-concept in Terraform, Claude Code, Codex, and Homebrew via either plugins or forks. In each case, the implementation was no more than a dozen lines.
I've been in contact with the maintainers of many popular terminal programs and emulators and they've helped review and shape the specification. But if you have any more feedback, I'm happy to hear it.
If you've implemented the specification please let me know via email and I'll add you to the list of tools that implement this. Thank you.
I'd like us all to stop guessing what programs are doing by reading their screens or process trees. The program already knows. Let's give it a way to tell us!

Everything we launched during Birthday Week 2026
Cloudflare's Birthday Week 2026 introduced 46 updates, including a new agentic CLI called 'cf' and a Monetization Gateway for AI agents to pay for content.
Deep dive
- cf: An agentic CLI mirroring the Cloudflare API for consistent configuration.
- Monetization Gateway: Beta support for charging agents for content via HTTP 402.
- Cloudflare Basin: A serverless data platform built on Apache Iceberg and R2.
- Post-quantum: Plans to become a public Certificate Authority using Merkle Tree Certificates.
- AI Search: Generally available with visual and PDF-based search support.
- K2: Durable serverless event streams built on R2.
Decoder
- HTTP 402: A proposed HTTP status code for 'Payment Required', here repurposed by Cloudflare to enable automated micropayments from AI agents to content providers.
- MCP (Model Context Protocol): An open standard for connecting AI models to external tools and data sources.
Original article
We celebrated our 16th birthday last week by sharing how we’re building a better Internet for today’s world. As Matthew and Michelle reflected in this year’s Founders’ Letter, this year saw some of the most consequential changes in the history of the Internet.
For the first time, automated traffic surpassed human activity. AI is empowering people to build like never before, leading the Internet to grow massively in scale and unlocking more ambition and creativity. As we witnessed the influence that agent-driven recommendations have on consumer choices, we identified the need for a new approach that creates space for new businesses to succeed.
Each day of Birthday Week explored a different way we are helping to build the future of the Internet. We began on Monday by strengthening our commitment to open source. Tuesday focused on application security and the post-quantum transition. On Wednesday, we explored new economic models for the agentic Internet. Thursday, we expanded the Developer Platform with new tools for data analysis, storage, AI, and agent development. Finally, we closed out the week by launching features that make Cloudflare faster, easier to operate, and more accessible to everyone. As a special Birthday Week follow-up, we shared an update on our intern program, one year after announcing our goal to hire 1,111 interns. Interns directly contributed to many of the projects launched this week, including EmDash, post-quantum visibility, CryptoLabe, and Protected Quick Tunnels.
We shipped 46 announcements this week. In case you missed any, here’s the full list of everything we announced during Birthday Week 2026.
Monday, September 28 - Commitment to open source
With the announcement of our new CLI, which we released alongside the pipeline we use to generate it and our SDKs and docs, we shared how we’re building to support agents and developers as they use Cloudflare — and supporting the projects that you rely on, too.
| What | In a sentence… |
|---|---|
| Introducing cf: the agentic CLI for the entire Cloudflare API | The new cf CLI mirrors the Cloudflare API, uses JSON-first output and typed configuration, and gives people and agents one consistent command-line interface. |
| Introducing Forge: the open source pipeline for generating SDKs, CLIs, docs, and more | Forge is a pluggable, open-source pipeline that runs in CI to generate SDKs, CLIs, documentation, and other interfaces directly from API definitions. |
| Introducing EmDash - the spiritual successor to WordPress that solves plugin security | EmDash is an open-source, Astro-based serverless CMS that runs plugins in isolated Worker sandboxes with explicitly approved capabilities. |
| Four months of VoidZero at Cloudflare: making the open-source JavaScript toolchain faster for all humans and agents | Since joining Cloudflare, VoidZero has delivered more than 80 releases across the Vite ecosystem, and its previously commercial Void platform will become fully open source. |
| Next.js applications, powered by Vite: introducing Vinext 1.0 | Vinext 1.0 turns an AI-built experiment into a production-ready, portable way to run Next.js applications on Vite. |
| The road to the agentic browser: A Kitesurf update | Kitesurf, our Workers-based browser for agents, adds WebMCP support, faster DOM operations, broader web compatibility, and terminal-based rendering. |
| How fast is the web? Explore billions of real-user measurements with BEACON | BEACON makes billions of anonymized real-user performance measurements from 10,000 major websites available as a public BigQuery dataset. |
| Supporting native Rust in Workers with the new Emscripten target for wasm-bindgen | Experimental Emscripten target support lets developers bring more native Rust libraries and applications, including progress toward Tokio support, to Workers. |
| Introducing The Cold Start: pitch your startup live at Cloudflare Connect | The Cold Start gives five early-stage companies the opportunity to pitch live at Cloudflare Connect and compete for resources to help them grow. |
Tuesday, September 29 - Helping secure the agentic Internet
Technological progress is rapidly changing how we think about application security. We announced our intention to become a certificate authority, as well as how we’re preparing foundational Internet cryptography for the post-quantum era and adapting application security to counter AI-driven attacks.
| What | In a sentence… |
|---|---|
| Building a certificate authority for the whole Internet | Twelve years after launching Universal SSL, Cloudflare announced its intention to become a public certificate authority (CA) and add resilience to free, automated certificate issuance. |
| Building a post-quantum certificate authority with Merkle Tree Certificates | Our planned CA will issue free Merkle Tree Certificates designed to make post-quantum authentication practical without imposing large certificate and handshake costs. |
| Using AI to chart a course for our post-quantum migration | CryptoLabe uses AI to find and classify cryptography across our codebase as Cloudflare works toward completing its post-quantum migration by 2029. |
| Preventing quantum downgrade attacks against IPsec | Cloudflare helped develop an IETF extension that authenticates the full IKEv2 transcript and prevents attackers from downgrading post-quantum IPsec tunnels. |
| Is your domain using post-quantum encryption? Now you can see for yourself | HTTP Analytics, Log Explorer, and Logpush now show whether requests negotiated post-quantum key exchange, giving customers evidence they can inspect and report. |
| Enforce positive security with Cloudflare Application Profiles | Application Profiles learns the expected structure of HTTP requests so customers can identify deviations and enforce what valid application traffic should look like. |
| We tested our own WAF with frontier AI models. Here's what we found | An adaptive AI red-team system found WAF detection gaps across six attack categories, helping us improve normalization and managed rules for customers. |
| Introducing Threat Signals: agentic skills for open-source threat intelligence, free for every Cloudflare account | Threat Signals turns open-source reporting into structured indicators and connects the context to WAF rules, while the Threat Events Platform expands to every account. |
| Adaptive application security for the AI era: how Cloudflare connects code, traffic, and intelligence to stop attacks | Our application-security framework connects discovery, governance, runtime protection, investigation, and response in a continuous learning loop. |
Wednesday, September 30 - Powering the agent economy
With our announcements of Pay Per Use and the release of our Monetization Gateway in beta, we shared how we’re building support for a new economic model that empowers creators to monetize their content and services.
| What | In a sentence… |
|---|---|
| The Internet has a second audience | AI agent requests have grown rapidly, and our strategy helps creators see agents, set terms for access, and get paid when agents use their work. |
| Cloudflare Containers, rebuilt to scale agent sandboxes | Containers now has faster startup, flexible image and instance selection, new scheduling controls, and filesystem snapshots for persistent agent workspaces. |
| Monetization Gateway beta: charge AI agents for consumption with HTTP 402 | Monetization Gateway lets sellers put a price on resources behind Cloudflare and collect agent payments using HTTP 402 and x402. |
| Pay Per Use: when AI uses your work, you should get paid | Pay Per Use gives enrolled publishers usage reports, billing, and payouts when verified AI buyers use their content. |
| Simplifying domains for people and agents | A new domain-search experience and expanded Registrar APIs make it easier for both people and agents to search, register, transfer, and manage domains. |
| Identify AI model overuse with User Insights | AI Gateway User Insights identifies tasks, model fit, and overuse, so teams can understand where a smaller or less expensive model may work. |
| Detect and send production issues straight to your agent | Issues groups Workers errors and sends the relevant stack traces, logs, and traces to coding agents or any webhook for faster investigation. |
| Cut your AI spend with AI Gateway's Auto Router | Auto Router classifies each request at the edge and sends it to a suitable model, reducing cost while preserving response quality. |
| Cloudflare Impact reaches $100 million in donations | Initiatives including Project Galileo, the Athenian Project, and Cloudflare for Campaigns have now delivered more than $100 million in donated services. |
Thursday, October 1 - Bringing more of the developer stack to Cloudflare
We expanded what is possible to achieve on Cloudflare’s platform with the general availability launch of Cloudflare Basin, our data analytics platform, the launch of K2, a durable serverless event stream, and the announcement of our new contest — inviting developers to build a Git platform designed for agentic development.
| What | In a sentence… |
|---|---|
| Introducing Cloudflare Basin: an open, serverless data platform, now generally available | Basin is now generally available, giving developers a serverless platform built on Apache Iceberg and R2 for ingesting, managing, and querying large datasets. |
| Support for modern cryptographic algorithms in Workers | Workers adds opt-in native Web Crypto support for ML-KEM and ML-DSA, giving developers post-quantum primitives without bundling their own implementations. |
| AI Search is now generally available | AI Search reaches general availability with visual search, OCR for scanned PDFs, larger files, and support for any chat model. |
| We want you to build the next Git platform on Cloudflare | Artifacts enters open beta and a new competition invites developers to build a Git platform designed for the era of AI agents. |
| Announcing Cloudflare K2: serverless event streams | K2 provides durable, ordered event streams on R2, separating producers and consumers without the operational overhead of managing broker clusters. |
| Cloudflare OS: your company's agent workspace, managed for you | Cloudflare OS provides an agent workspace connected to an organization’s data and systems, with a waitlist open for fully managed deployments. |
| Introducing Workers KV Instant - powered by Quicksilver | Workers KV Instant delivers sub-two-millisecond p99 reads and fast global replication across more than 300 locations using the familiar Workers KV API. |
| One year later: Sovereign AI and the fight for choice | We are expanding local open-source model choice and model-agnostic security tools, so nations can pursue AI sovereignty without isolation. |
| Introducing Clef: our open-source decision models, and new RL fine-tuning platform | Clef and Clef-flash are open-source decision models for fast classification and agent workflows, accompanied by a platform for reinforcement-learning fine-tuning. |
Friday, October 2 - Delivering a faster, simpler Internet for everyone
We wrapped up the week with major updates to Cloudflare Observability, alongside adding Cloudflare Traces, network performance improvements that make Cloudflare faster, and an announcement on how we’re supporting civil society organizations.
| What | In a sentence… |
|---|---|
| 8 major updates to Cloudflare Observability | Eight updates bring logs, traces, analytics, alerts, dashboards, querying, and telemetry export into one observability platform with simpler pricing. |
| Introducing Cloudflare Traces: follow requests through our entire platform | Cloudflare Traces provides request-level visibility across security rules, transformations, cache, Workers, services, and origins without requiring an agent or SDK. |
| Updates on our pledge to make Cloudflare features accessible to everyone | One year after our pledge, Logpush, multi-account governance, higher platform limits, and other capabilities are available to more customers across plans. |
| Announcing Cloudflare OHTTP Gateway - expanding access to Cloudflare's privacy-preserving infrastructure | A self-serve OHTTP Gateway enters closed beta, while Privacy Gateway becomes Cloudflare OHTTP Relay to distinguish the two roles. |
| Follow the thread: a new dashboard to investigate account abuse | Account Abuse Protection uses stateful analysis and privacy-preserving Hashed User IDs to help teams investigate credential stuffing and fake-account creation. |
| Protected Quick Tunnels: simple accountless authentication for your next dev project | Quick Tunnels now support email authentication, letting developers share a local application with selected people or domains without requiring Cloudflare accounts. |
| Building for good: How civil society organizations are automating on Cloudflare | Civil society organizations are using Cloudflare’s developer platform to automate and scale work that protects human rights and the public interest. |
| 2026 Birthday week: network performance update | Using an expanded real-user measurement methodology, Cloudflare now ranks as the fastest provider across 74% of the top 1,000 networks. |
| Introducing Web Search API via AI Gateway | AI Gateway’s Web Search API brings current web context from multiple providers into model calls through REST APIs, Workers bindings, or customer-managed keys. |
| Streamline: custom video pipelines with Cloudflare Stream and Workers | Streamline is an open-source example for building continuous video pipelines by combining Workers, Durable Objects, and a containerized media engine. |
Building the Internet’s next chapter together
Across this week’s announcements, we kept returning to a consistent theme: the Internet should continue to open up more opportunities for people to create, contribute, and succeed. That means open tools developers can shape, security that keeps pace with new threats, a fairer exchange between agents and the people whose work they use, and infrastructure designed for the agentic Internet.
For 16 years, we have been building alongside developers, creators, researchers, customers, partners, and open-source communities. Your ideas, feedback, and willingness to challenge us have shaped Cloudflare, and that collaboration matters now more than ever.
Scaling Kubernetes Workloads with Node Swap
Kubernetes 1.34 brings General Availability to node swap support, allowing memory-constrained clusters to achieve 3x pod density by offloading dormant state to NVMe SSDs.
Deep dive
- Enables swap for K8s nodes, resolving previous memory accounting issues via cgroup v2.
- Local SSDs are recommended to mitigate the latency penalty of standard spinning disks.
- Benchmark showed 3x density gains for isolated Python sandboxes.
- CI/CD kernel build memory limits were cut by 50% using swap as a buffer.
- Requires setting memory limits higher than requests to utilize 'Burstable' QoS tiers.
Decoder
- cgroup v2: The second version of Linux control groups, which provides more reliable memory accounting and hierarchical management of resources.
- OOM (Out-Of-Memory) Kill: A process used by the Linux kernel to terminate memory-heavy processes when physical RAM is exhausted.
Original article
Scaling Kubernetes Workloads with Node Swap
Memory is often the first hard limit a Kubernetes cluster hits. Nodes run out of RAM long before they run out of CPU, and the new wave of agentic AI workloads makes this worse. These workloads demand large memory footprints to start up and run untrusted code, then sit idle waiting for the next prompt. That idle but resident memory is expensive, and it caps how many pods a node can hold. This is where swap helps. Kubernetes support for running nodes with swap enabled reached General Availability in v1.34, and by backing that swap with fast NVMe solid state drives (SSDs), a node can page out dormant memory and pack in far more pods. This post explains how we benchmarked that approach across three workloads, including CI/CD kernel builds, sandboxed headless browsers, and isolated Python runtimes; we found density gains of up to 3×, often with little or no latency cost.
The node density problem
The Kubernetes ecosystem has reached a fundamental physical resource constraint: the strict limits of hardware memory versus the growing demand for dynamic, bursty workloads in the new agentic era.
Historically, administrators provisioning memory-intensive workloads encountered a persistent dilemma: set memory limits too high and you waste expensive infrastructure on idle RAM; set them too low and you risk Out-Of-Memory (OOM) kills.
This conflict is amplified when deploying autonomous AI agents using secure execution environments like the agent-sandbox framework. These agentic pods require large memory footprints to initialize and execute untrusted code. However, after their burst of activity, they typically enter long-tail idle phases waiting for user prompts. Keeping this idle state in physical RAM caps cluster density and makes AI infrastructure expensive to run.
The solution: Kubernetes node swap
With the introduction of Kubernetes' support for running nodes with swap enabled (which reached General Availability in v1.34), this paradigm shifts. By enabling the Linux kernel to page out anonymous memory to disk, node swap acts as a shock absorber during traffic spikes or periods of heavy memory oversubscription.
Historically, swap was discouraged in Kubernetes for two reasons. The first was memory accounting. Under cgroup v1, the controls treated memory and swap as a single combined limit rather than letting operators set an independent limit for disk swap. Without independent tracking, a process could page large amounts of anonymous memory out to disk, which made a container's real memory usage unpredictable and hard to isolate. Kubernetes' swap support resolves this by relying on cgroup v2, whose separate swap accounting tracks disk swap on its own. The second reason was the latency penalty of paging to slow spinning disks, which fast NVMe Local SSDs largely eliminate. Together, these make it practical to increase pod density and buffer against memory spikes without sacrificing cluster stability.
The benchmark data
| Workload Profile | Baseline Capacity (No Swap) | Local SSD Swap Capacity | Density Improvement |
|---|---|---|---|
| Linux CI/CD Kernel Build | 600 MB RAM Limit | 300 MB RAM Limit | -50% RAM Footprint |
| Headless Chrome (Kata) | 40 Concurrent Pods | 50 Concurrent Pods | +25% Pod Density |
| Headless Chrome (gVisor) | 80 Concurrent Pods | 160 Concurrent Pods | +100% Pod Density |
| Python Sandbox (gVisor) | 80 Concurrent Pods | 240 Concurrent Pods | +200% Pod Density |
1. Traditional workload: Linux kernel build
Before exploring specialized agentic architectures, swap was validated against classic batch workloads by running a complete Linux 6.1.1 kernel build. The kernel compilation process leverages concurrent worker threads, balloons in memory to hold compiled object files, and requires a large memory spike during the brief linking phase.
This workload mirrors the memory behavior of enterprise CI/CD pipelines. Because earlier compiled objects sit inactive in memory while the pipeline progresses, CI/CD jobs frequently hoard unused physical RAM, which makes them well suited to node swap compression.
On a baseline node without swap, the minimum memory limit to prevent an OOM crash during compilation was 600 MB. Routing swap to a Local SSD cut the container memory limit by 50% to 300 MB without incurring any execution slowdown (in fact, it ran cleanly in 374s vs the baseline 433s). However, as an explicit tradeoff, compressing the limit further to 200 MB forced the active working set into swap, causing long I/O wait times and increasing execution time by over 40%. This reinforces that swap serves as an insurance policy for burst memory, not a replacement for active RAM.
2. High-density agent workloads: headless browser runtimes
AI agent workloads frequently require manipulating headless browsers via Chromium. However, trusting external code execution often requires stricter security isolation than standard Linux namespaces. This benchmark cross-evaluated several container runtime environments.
- Unsandboxed baseline limits (
runc): To test the limits of the environment without the overhead of security runtimes, plain runc containers were swept on a c4-standard-32 node (32 vCPU, 120 GB RAM). Without swap, the node exhausted physical memory and failed past 512 pods. Enabling Local SSD swap allowed the node to support 768 concurrent pods. - Advanced security runtimes (for example: gVisor, Kata Containers): Enabling strict security sandboxing increases memory overhead and normally reduces pod density. However, memory swap naturally absorbs this overhead penalty. Without swap, a gVisor environment hit a hard limit at 80 pods. Local SSD swap doubled that capacity, which allowed 160 concurrent gVisor pods on a single node. Similarly, Kata Containers microVMs exhausted physical RAM at 40 concurrent pods without swap, but using GCP Local SSD swap expanded this to 50 stable Kata microVMs before CPU saturation.
At these maximum densities, the per-pod latency increase is driven mainly by pods competing for CPU, not by swap I/O. An operator tuning for a specific latency target would run at a lower density than the peak numbers here and see a proportionally smaller latency cost.
3. Beyond browsers: sandboxed Python runtimes
The advantages of node swap also extend to untrusted, isolated code-execution environments. This sweep deployed simultaneous Python sandbox sessions analyzing 5 million rows of data from the MovieLens 20M dataset, requiring a ≃375 MiB resident memory footprint per execution.
Without swap, heavy concurrent bursts exhausted physical memory, causing the node to hit a hard RAM limit and fail at 80 concurrent sessions. Enabling Local SSD swap offloaded dormant anonymous memory, freeing up physical RAM and preserving the node's page cache. This allowed the node to scale to 240 concurrently isolated Python sandboxes—a 3× density improvement. As with the browser workloads, the latency rise at peak density comes mainly from the sandboxes competing for CPU rather than from swap itself.
How to use it
If you manage Kubernetes infrastructure for developer environments, browser testing farms, JVM applications, or AI execution runtimes, leveraging Local SSD swap can multiply your density efficiency.
In Kubernetes v1.34+, node swap is Generally Available. You enable it via the kubelet configuration:
kind: KubeletConfiguration
apiVersion: kubelet.config.k8s.io/v1beta1
failSwapOn: false
memorySwap:
  swapBehavior: LimitedSwap
Pairing this upstream configuration with your cloud provider's high-speed local disk gives you dynamic memory balancing. For example, this is natively supported on Google Kubernetes Engine via Node Memory Swap configured on Local SSD profiles.
To get the benefits, configure your workloads with Burstable QoS: set your container's memory limits higher than its requests. The node automatically rations fast swap space based on idle application memory usage while keeping active processes responsive.
Conclusion
As the Kubernetes ecosystem transitions into the agentic era, administrators face a growing conflict between finite hardware memory limits and the bursty behavior of AI workloads. Frameworks like Agent Sandbox provide the security isolation required for running untrusted agents, but that isolation traditionally demands large amounts of idle memory overhead.
By configuring the kubelet with LimitedSwap and routing it to Local SSDs, you can mitigate this conflict. Fast swap offloads the dormant states of idle agents, allowing you to increase pod density and node utilization on the same infrastructure without compromising security boundaries.
Rea (GitHub Repo)
REA allows AI agents to perform local reverse engineering on applications and binaries without source code access, providing evidence-based analysis for feature reproduction.
Deep dive
- Supports local analysis of native binaries, JavaScript, .NET, and websites.
- Native analysis integrates with Hopper, Ghidra, or IDA Pro.
- Generates evidence-based explanations of features and facilitates building reproduction code.
- Runs analysis locally for security and privacy.
- Uses the Model Context Protocol (MCP) to provide findings directly to agents like Claude or Cursor.
Decoder
- MCP (Model Context Protocol): An open standard that allows AI models to securely connect to external tools, databases, and environments.
- Reverse Engineering: The process of analyzing a software system to identify its components and interrelationships to recreate or understand its design and implementation.
Original article
REA: Reverse Engineer Anything
One MCP for reverse engineering across binaries, applications, and runtime behavior.
See a feature you like. Understand how it works, down to the binary level.
See a feature in an app that you want in your own product? Ask your agent to investigate it with REA. It can inspect the app without its source code, explain how the feature works, show the evidence, and build a version for your project.
REA connects your agent to tools for inspecting native binaries, JavaScript and Electron apps, .NET assemblies, and websites. You can also use the same tools from your terminal. Analysis runs locally, and results include the evidence and limitations behind each conclusion.
Setup registers REA with your agent and installs matching workflow instructions. Native analysis can use an existing Hopper or Ghidra installation; setup can optionally install Hopper with approval. Static JavaScript analysis needs neither engine.
Visit the REA website for setup instructions, illustrated guides, and real case studies.
Quick start
Set up your agent
With Node.js and npm installed, run:
npx rea-agents setupChoose your agents, review the proposed changes, and approve them. Setup adds REA's MCP server and matching workflow instructions, with backups of existing configuration. Restart your agent afterward.
Setup supports Claude Code, Codex, Cursor, Gemini CLI and other agents.
Ask your agent
Understand how search works in the Notes app, show me the evidence, and build a
similar feature for my project.
Replace Notes with your target app and the feature you want to understand.
Use the terminal
Inspect an extracted JavaScript/Electron app directory or ASAR:
npx -y rea-agents@latest analyze-javascript-application /absolute/path/to/app --jsonThe result includes modules, imports, Electron boundaries and their evidence. Replace the path with your target, such as "D:/apps/example" on Windows.
To install the rea command for regular use:
npm install --global rea-agents
rea --help
Update REA
REA changes quickly, and new releases include frequent bug fixes. Keep your installation up to date.
For an npm-installed CLI:
rea updateTo refresh your agent registrations and skill, run the setup command printed by the update.
If you use npx, update your agent setup with:
npx rea-agents@latest setupHow REA works
Your agent calls REA through MCP to inspect the target and trace relevant code. REA returns findings with their evidence. The agent uses them to ask follow-up questions, explain the behavior, or write and test an implementation. CLI commands use the same workflows.
What you can analyze
REA requires Node.js 22.x (>=22.19), 24.x (>=24.11), or 26+, plus npm. Additional tools and host support depend on the target:
| Target | What REA returns |
|---|---|
| Native binaries | Pseudocode, assembly, strings, symbols, calls and references |
| Offline ELF layout | Sections, segments, original symbols/relocations and static mitigation candidates |
| EVM bytecode | Dispatch selectors, byte offsets, inferred arguments and mutability |
| Recorded Linux crashes | Raw notes, every recorded thread's registers/signals and optional mapping candidates |
| JavaScript / Electron | Modules, imports, source maps, routes, IPC and native add-on relationships |
| Websites | Page structure, scripts, network observations and requested screenshots |
| Saved network captures | Requests, responses, exposed payloads and source locations |
| .NET assemblies | Metadata, CIL instructions, declared native dependencies and build comparisons |
| Android APKs | Manifest declarations, classes, decompiled methods and references |
| Firmware | Regions, extraction results and native-analysis handoffs |
| Packages and resources | File inventories, digests, plists, Apple bundle anatomy and extracted resources |
| Process behavior | Terminal output, interactions, exit and filesystem observations, and run comparisons |
Showcases
DX-Ball: reconstruct a sound-pan calculation
Follow a sound call into its position-to-pan helper, inspect the instructions, and turn incomplete pseudocode into C. The reconstruction passes 3,205 original-x86 cases and reproduces all 63 compiled function bytes.
Notion: trace the Electron clipboard bridge
Find the renderer's clipboard API, follow it through preload and IPC into the main process, and inspect the rich clipboard format.
TH04: recover a DOS bullet-ring calculation
Inspect the original PC-98 game's 16-bit instructions, recover the fixed and aimed angle calculations, and compare the reconstructed C++ with the historical compiler output.
FAQ
Which agents can use REA? Any agent that supports local MCP servers.
Do I need Hopper, Ghidra or IDA? Deep native analysis uses one of them. Static JavaScript and .NET inspection work without a native analysis engine.
Does REA upload my app? REA analyzes targets locally. Your agent receives the tool results, and its model provider has its own data policy.
Disclaimer
REA provides tools for lawful reverse-engineering research, analysis, and reconstruction. You are responsible for obtaining any required authorization and complying with applicable laws. The project does not endorse illegal or unauthorized use.
e2e (GitHub Repo)
e2e is an agent-based testing framework that allows developers to describe test goals in natural language to drive browser and mobile app automation.
Deep dive
- Uses natural language agents for UI-based automation.
- Supports web engines (Chromium, Firefox, WebKit) and mobile (iOS/Android simulators).
- Implements replayable recordings to avoid redundant model API calls.
- Provides integration for PR reporting on GitHub.
- Active development toward version 1.0; APIs are subject to change.
Decoder
- Agentic testing: A method where an LLM-powered agent explores an interface to complete a defined goal rather than following a rigid sequence of hard-coded selector interactions.
Original article
e2e
e2e is an end-to-end testing framework for web and mobile apps. Describe a goal in natural language and an agent drives the app to reach it. Check the result with locators and assertions in the same test.
// tests/checkout.e2e.ts
import { test, expect } from 'e2e';

test('a member upgrades to Pro', async ({ app, agent, screen }) => {
  await app.open('/settings/billing');

  await agent.act('upgrade the workspace to the Pro plan');
  await agent.assert('the invoice preview shows a prorated amount');

  await expect(screen.getByRole('status')).toContainText('Pro');
});
An agent step that a later assertion verifies records its actions, and the next run replays them with no model calls until the app changes. Tests without agent steps need no model. Bring your own subscription, API key, or local model.
Quick start
npx e2e initinit asks for an engine, web or mobile, and a model provider, then writes a config and an example test. The quickstart covers the rest.
To see a finished setup in your stack, open examples/: Vite, Next.js, Expo, SwiftUI, Jetpack Compose, Kotlin Multiplatform, and Flutter, each a standalone project with a passing suite.
Packages
| Package | What it does |
|---|---|
e2e |
The SDK, runner, and CLI. |
@e2e-dev/web |
Browser engine: Chromium, Firefox, and WebKit through Playwright. |
@e2e-dev/mobile |
iOS and Android engine: simulators and emulators through agent-device. |
@e2e-dev/github |
Reporter that posts results as a pull request comment. |
@e2e-dev/kernel |
Kernel hosted browsers for the web engine. |
@e2e-dev/eas |
EAS Simulators hosted iOS simulators and Android emulators for the mobile engine. |
@e2e-dev/decision |
Decision-model executors for bounded semantic actions and assertions. |
Documentation
e2e.tester.army/docs. The e2e package ships every page, so coding agents can read them offline in node_modules/e2e/docs.
Contributing
See CONTRIBUTING.md. Questions go to Discord.
Security
Please don't open public issues for security vulnerabilities. Follow SECURITY.md and report them to security@tester.army.
Telemetry
The CLI sends anonymous usage data, such as which commands and engines run and where runs fail, but no test content, app content, or credentials. Opt out with npx e2e telemetry disable or E2E_TELEMETRY_DISABLED=1. Telemetry lists every field.
Status
e2e is in active development on the way to 1.0. APIs and config can still change between minor releases.
Made by TesterArmy
e2e is built by TesterArmy, the agentic testing platform that runs natural language tests on web and mobile apps, on every pull request or on a schedule.
Apache-2.0.

"Think of it as Kubernetes for agents": OpenClaw lands in the enterprise with OpenAI, Nvidia and Red Hat on board
OpenClaw Enterprise launches as an open-source Kubernetes control plane designed to provide central governance and security for persistent AI agents.
Deep dive
- Provides centralized management for agent deployment, configuration, and credentials.
- Implements namespace-based isolation for multi-tenant agent workloads.
- Built to run on existing Kubernetes infrastructure.
- Currently in embryonic development; unsuitable for production until 1.0.
- Managed by the independent OpenClaw Foundation to ensure vendor neutrality.
Decoder
- Agent harness: The scaffolding or runtime environment that manages an agent's lifecycle, model calls, and tool access.
Original article
Full article content is not available for inline reading.

Cursor Uses S3 WAL to Scale Git Storage to More than 300 Pushes per Second
Cursor's 'Continuity' architecture achieves high Git push throughput by using an S3-backed write-ahead log as the primary source of truth.
Deep dive
- Uses S3 as the authoritative storage layer instead of replica-to-replica coordination.
- Employs S3 Express One Zone for low-latency durability.
- Local NVMe storage serves as a warm read cache.
- Git compaction (heavy CPU task) is performed by the primary and distributed to replicas.
- Replicas converge on state via gossip protocols, with S3 serving as the fallback source of truth.
Decoder
- Write-Ahead Log (WAL): A technique where changes are logged to durable storage before applying them to the main data store to ensure crash consistency.
- Linearizable: A consistency model where operations appear to take effect instantaneously at some point between their invocation and response.
Original article
Cursor Uses S3 WAL to Scale Git Storage to More than 300 Pushes per Second
Cursor has developed Continuity, a Git storage architecture that uses an S3-backed write-ahead log (WAL) as the source of truth rather than relying on replica coordination as the consistency mechanism. Cursor reports linear read scaling with up to 100 replicas in synthetic tests and more than 300 pushes per second using S3 Express One Zone. The architecture targets both large repositories with heavy CI workloads and the large number of smaller repositories created by coding agents.
Git hosting at scale depends on local Git repositories and packfiles. GitHub's Spokes architecture maintains multiple NVMe replicas and uses three-phase commit for reference updates. The design keeps replicas synchronized and allows reads to be served from any replica, but coordination overhead increases as replica counts grow.
Continuity changes that model by making an S3-backed WAL the durable source of truth. Cursor stores pushed data in S3 and records the corresponding reference update in the WAL. A push is acknowledged only after the required data has been persisted, providing durability before acknowledgment. Cursor also batches operations to reduce the impact of S3 PUT latency on throughput.
/filters:no_upscale()/news/2026/09/cursor-continuity-git-storage/en/resources/1cursorarch-1789844142232.jpeg)
Continuity architecture (Source: Cursor Blog Post)
Cursor engineer Vicent Martí described local NVMe repositories as warm caches rather than authoritative copies. Rendezvous hashing selects preferred nodes, while atomic compare and swap operations on S3 allow any server to accept a push. A repository can be materialized from the WAL when a local copy is unavailable. UDP gossip propagates WAL updates, while conditional S3 reads verify replica state. Cursor reports these reads take less than 10 milliseconds on average and says lost gossip does not affect correctness because S3 remains the source of truth.
The storage model has prompted comparisons with database systems. Maksim Al Dandan, a senior software engineer, described the approach as treating Git storage like a database, pointing to push consistency, force-push transactions, and point-in-time recovery as questions relevant to the model.
/filters:no_upscale()/news/2026/09/cursor-continuity-git-storage/en/resources/1Screenshot 2026-09-19 at 11.54.41 AM-1789844142232.png)
Continuity Push Flow (Source: Cursor Blog Post)
Casey Lee, CTO at Liatrio and a former AWS engineer, highlighted the architectural shift, describing the WAL in S3 as the source of truth while local NVMe serves as a cache. Lee also noted that Cursor's published performance figures had not been independently verified.
The Continuity model changes how replication and compaction scale. Cursor says monorepos can support hundreds of replicas for CI, while idle repositories can be materialized on demand. Only the primary performs Git compaction, with replicas downloading resulting packs from S3, trading bandwidth for CPU.
In synthetic tests using Cursor's everysphere monorepo, Cursor reports up to 120 pushes per second with S3 Standard and more than 300 with S3 Express One Zone. At the higher rate, Git compaction became the bottleneck. Cursor says tested pushes were linearizable and persisted to external storage before acknowledgment, while clones remained fully consistent.
The architectural shift moves the consistency boundary from the replica layer to durable object storage. Instead of synchronously coordinating more replicas, Continuity lets local repositories converge independently on state stored in S3, trading replica coordination for storage validation, asynchronous propagation, and extra bandwidth.

Designing for Voice First
Designing voice-first interfaces requires treating voice as a primary modality rather than just an alternative way to fill existing text fields.
Original article
Designing for voice first
Through my work with a startup exploring voice-first interfaces, I’ve noticed how easy it is to design an app around touch and typing, even when the intention is to make it voice-first. You start with familiar components and workflows, and by the time you’re thinking about voice, most of the decisions about how someone will use the product have already been made. Speaking becomes another way to fill in the same fields.
I also caught myself thinking that voice-first meant giving voice, touch, and typing equal importance. People should be able to use whichever makes sense for them, so that felt like a reasonable place to start. But it didn’t really answer what we were trying to explore. If voice is always being fitted into a workflow designed for something else, how much are we actually reconsidering?
I don’t think the answer is to remove the keyboard or make people speak when they’d rather tap. But we do need to question some familiar requirements, like choosing a project before adding a task, or opening the right screen before being able to change something.
These are five principles I’ve been working through. Some get more difficult when you put them together, particularly when you move from someone speaking at their desk to someone talking through their AirPods with their phone in their pocket.
1. Make context count
One of the benefits of speaking is how naturally you give more context. If you’ve used voice to prompt an agent, you’ve probably noticed this already. You explain why you’re asking, mention something related, or add a qualification you might not have bothered typing.
For a task, I might type “Review proposal.” Speaking, I’m more likely to say something like, “I need to review the proposal before Friday’s meeting, particularly the pricing, because I’m not sure we’ve allowed enough time for the research.”
There’s useful information in that explanation. The meeting gives the task a timing constraint, and the concern about research tells me what to look for when I come back to it. But if the software turns all of that into a task called “Review proposal,” I haven’t gained much from saying it.
We keep saying that agents work better with more context, but people need a reason to keep providing it. If the extra explanation doesn’t improve the result, we’re effectively teaching them to be brief.
In this example, I’d expect the concern about research to stay with the task and the timing to reflect the meeting. I shouldn’t have to dictate my thought, then open the task and organize everything myself. That’s work the software should be taking on, while leaving me a way to correct its interpretation.
2. Let people steer as they think
The proposal example sounds fairly complete written down. In practice, I might say Friday, realize that leaves me no time to prepare, and change it to Thursday while I’m still talking.
That’s something the interaction needs to allow for. People won’t always arrive with a finished instruction, and sometimes seeing the software respond is what helps them figure out what they meant.
If I’m looking at the screen while speaking, I want to see the task taking shape. I can notice that it has the wrong date, add something I forgot, or change direction because the result has made me think of something else. Waiting until I’ve finished talking to show anything loses some of that opportunity.
But showing every partial interpretation could become distracting, too. If the task keeps moving around or changing its wording, I’m now trying to follow the interface while also keeping track of my thought.
I don’t think we’ve resolved all of this yet. The useful question for me is whether the feedback helps someone continue thinking, or gives them another thing to manage.
3. Make understanding clear
A microphone animation is useful for knowing that the app is listening, but it doesn’t tell me whether the app has understood what I’m asking.
Even a correct transcript leaves that question open. It might capture both Thursday and Friday perfectly and still assign the wrong one to the task.
When I’m looking at the screen, I can check the result as it appears. Seeing the review scheduled for Thursday, with the concern about pricing attached, tells me more than a generic acknowledgment would. I probably don’t need the app to read it all back as well.
If I’m out walking, that changes. A short spoken response might be useful because I have no other way to know what happened. “Added for Thursday, with a note to check the research budget” gives me enough to catch a misunderstanding without listening to my entire request again.
This is where feedback needs to be specific about what has actually happened. Capturing what I said, understanding it, and acting on it are separate things. If the app has saved my words but hasn’t managed to create the task, I need to know that. Otherwise I’m walking away with confidence it hasn’t earned.
4. Make correction easy
Once software starts interpreting what we mean, getting some of it wrong is part of the experience we have to design for.
I should be able to say, “No, the meeting is Friday. I want to review the proposal on Thursday,” and have that fix the relevant detail. I don’t want to repeat the whole request or wonder whether I’ve just created a second task.
There’s also a difference between changing my mind while something is being formed and undoing an action that has already happened. If we’re showing an interpretation before we’re confident in it, the interface needs to make that clear enough that people don’t mistake it for a finished result.
How much confirmation we ask for depends on what the software is about to do. I’m comfortable with a task moving to another day if I can easily move it back. Sending the proposal to a client is a different decision.
Requiring approval for every small change would make voice tedious pretty quickly. But skipping over uncertainty because it makes the demo feel faster won’t hold up in daily use. I need to understand when the system is asking for my judgment and trust that I can repair the ordinary mistakes without starting over.
5. Let attention come and go
A lot of what I’ve described so far benefits from being able to see the screen. That’s one of the situations to design for: I’m at my computer or holding my phone, speaking and watching the software respond.
The other is when I’m walking my dog or driving. I want to talk through something without looking at a screen, and I shouldn’t need to take out my phone to confirm a detail or finish the request.
These situations belong in the same product. I might start planning something at my desk and continue thinking about it after I leave. The interaction should survive that change in attention.
That raises some difficult questions about when to interrupt. If something essential is unclear, the app may need to ask me a spoken question. If it can safely keep the thought and leave a detail unresolved, that might be better than breaking my flow. Either way, it needs to avoid leaving me with the impression that something is handled when it isn’t.
When I come back to the screen, I want to see what happened and what still needs me. I don’t want to work through a transcript to discover whether the things I asked for became tasks, remained suggestions, or failed somewhere along the way.
These principles give me something to check my design decisions against, especially when I catch myself reaching for the familiar version of an app again. But this is the part I keep coming back to: seeing the software work can help me trust it, while some of the value of voice comes from being able to stop looking. If I finish a walk and feel the need to check every request, there’s still work to do.
Designing for People Who are Color Blind
Inclusive design for color blindness requires providing non-color visual cues and ensuring contrast ratios remain sufficient for all users.
Decoder
- WCAG: Web Content Accessibility Guidelines, the standard set of rules for making web content accessible to people with disabilities.
- Protanopia: A form of red-green color blindness involving reduced sensitivity to red light.
- Deuteranopia: A form of red-green color blindness involving reduced sensitivity to green light.
Original article
Color blindness affects about one in 12 men and one in 200 women, making key information, interactive elements, and color-coded data harder to perceive. Designs should pair color with an icon, pattern, or text label per WCAG 1.4.1, keep sufficient contrast, and avoid red-green and purple-blue pairings. Blue is a safer hue, though not guaranteed. Grayscale checks help, and hover, focus, and disabled states need non-color cues, ideally tested with real people.

AI invasive design
AI-invasive design occurs when teams prioritize using AI models over maintaining human-centric workflows, often leading to product failure and user deskilling.
Decoder
- Deterministic interface: An interface where the same input always produces the exact same output through fixed logic, as opposed to probabilistic AI models.
- MCP: Model Context Protocol, a standard for connecting AI models to external data sources.
Original article
AI invasive design
If this was written by AI, it would be shorter.
Your definition of AI native will fail you
“AI native” is a powerful but slippery phrase. There's just enough consensus on its definition that we assume shared understanding, and enough room for interpretation to be dangerous.
I think most of our definitions start somewhere like IBM’s:
Systems, products, and operational workflows designed from the ground up with AI as a core component, not bolted on later as a mere feature.
Businesses, teams, and people are performing cargo cult rituals to market themselves as AI native, while working from a definition that’s driven by mechanics and not outcomes. It’s isomorphic mimicry, adopting the outward appearance of successful peers as an empty signifier of your own credibility.
And I think this is, in part, because of the framing the phrase “AI native” itself creates.
There's an implicit callback to the digital native, whose early exposure to technology was assumed to translate into technical ability. It didn't.
Immersion in a technology might build conversational aptitude, but not critical fluency. Exposure to technology alone doesn’t teach you how to use it well. We shouldn’t repeat the mistake of conflating familiarity with fluency when it comes to AI nativeness.
By that definition, there’s only one way to become more AI native: volume. But trying to prove AI nativeness by how much AI you use or expose in your product will eventually lead teams to rip out whatever was there before—regardless of the value it provides—and replace it with AI…regardless of the value it provides.
Since I don’t know we’re escaping the phrase, I'd propose an alternative interpretation—one that I think encourages better decisions.
Alternative framing
In the prevailing framing, our products, our processes, our people are meant to be native to AI: AI is the new world everything is built to fit. But that’s backwards.
Human behavior is still the defining context we build technology in, and while human behavior can change in relationship to technology, it happens slowly within some pretty firm constraints set by the goo and meat we use to interact with our world.
The human motivation to create, communicate, and yeah, sell is what gives our products value.
Instead of considering how we build our products to fit the world of AI, we should be thinking about how to build AI that behaves like a native species in the ecosystem of human behavior.
Products in which AI feels native need to account for all inhabitants of the ecosystem in order to be successful. Otherwise, instead of thriving like a native species, AI initiatives:
- Dry up and die or are kept alive at great expense, like an imported ornamental grass
- Act like an invasive species, strangling out other sources of value and eroding the experience.
And I do think there are environments in this ecosystem that should be inhospitable to AI.
We need to look at products through the dual lens of what AI is capable of and what we know about human behavior and cognition. Here’s what I see as essential to an AI native product through this lens.
Reflect intent
The promise of natural language processing is that all you need to achieve your goal is intent. This is a legitimately cool aspect of AI that opens up new worlds to people regardless of their past education. But users don’t always come with clear intent, and language is not the best way to express all intents.
So AI native products need to be able to intuit, refine, capture, and play back users’intent. And we really need to find ways to do that other than chat bots.
Making interfaces more intent or goal-oriented, and building modes into agents can make implicit intent more reliable to intuit. But users also need new modalities and inputs to express intent.
Act as scaffolding
Interfaces will become increasingly fluid. At some point, that fluidity may come from generative UI; but there’s a huge amount of area to explore today by letting an agent manipulate the display of the existing UI to fit the user.
Users can work at the level of abstraction that’s right for them, creating a network of self-paving desire paths. For example: turning agent-driven adaptations of the user’s workspace into presets they can switch to at will.
To be scaffolding on which new experiences can evolve over time, you need a sharp content model and strong design system to create structure and consistency while still adapting to the user.
Digital experiences have evolved to reflect human users’ sense of place, and digital workflows rely on muscle memory. An AI native product needs to be more rigorous in its pursuit of clarity than one whose quirks can be learned over time because it never changes.
Work from a shared, natural language
AI is evolving alongside deterministic technologies, not replacing them. In the long-run, maybe only one survives—that’s not my bet—but just like early hominids, there’s going to be some coexistence and intermingling in the meantime.
All interactions in your product, whether mediated through AI or not, should reinforce the same mental model, even if they’re presenting the model at a different level of abstraction.
Some users may interact exclusively through knobs and dials to refine an agent’s work and others may send code that interacts directly with your foundational documents through an MCP. But most users will rarely work one way, at one altitude, all the time.
We shouldn’t make assumptions about users based solely on whether they favor deterministic or agentic interfaces. We’ve done this before with the advent of mobile experiences.
We assumed that the use of mobile technology was enough to determine the user’s context, what they’re trying to do, and what features they would need access to. We created dot-em sites catered to users on-the-go, only to find out they were visiting our mobile sites while sitting on the couch.
If we assume too much about the user from the technology they gravitate to first, we risk building them into a deep silo that limits the value they can derive from our products. Generative and agentic AI can and should meet the user where they are, but those interactions should also build the user’s intuitive understanding of the product outside the prompt box.
We need to be aware of drift in language (actual and visual) between agents and the rest of the interface.
I think successful AI native products will be least flexible with their content model, opinionated about what paths through that model they prioritize, and open-minded about how the system presents those paths to individual users.
Offer concurrency and scale with a controlled blast radius
We’ve been asked to do more with less long before generative AI. The volume and speed of AI production can be beneficial. But systems need to be transparent and open to participation by humans to avoid slop, cognitive surrender, and errors with a high blast radius.
This is more than human-in-the-loop. It’s using human cognition and behavior to set the loop’s circumference. It’s not enough to invite human participation into the process at fixed checkpoints if they can’t also make sense of what’s happening before or after. If users are being asked to “review” more decisions than the human brain can process, that’s a sign you’re doing AI invasive product design, and you need to do some weeding.
Avoid deskilling or die
While some users may say they want AI to do everything for them, keeping them engaged is critical. There’s a symbiotic relationship between effort and satisfaction. There’s evidence that encouraging people to let the AI handle everything leads to reduced motivation, satisfaction, and competency over time.
Deskilling, demotivating, or disenfranchising users is an existential threat to your product.
Sure, there are products out there who are hated by their users and survive regardless. Few of us will make it to that position. And why would we want to?
It’s impossible to manage this tension if your definition of AI native boils down to “AI only.” It requires hand-off between AI and human execution. It means building products that encourage users to do their own thinking first and treat the outputs of AI as material they should expect to refine. It means building pathways to learning into every interaction so usage doesn’t become dependency.
Of course, providing new ways of doing something will soften old skills. The ability to set metal type became less critical, then knowing how to use Letraset. Maybe some day my use of a keyboard will seem artisanal.
We should distinguish between what operational skills are needed to achieve something inside a specific product and the larger cognitive and domain skills humans need to do the thing themselves. Most importantly, we should use that distinction, along with the other principles above, to make principled decisions about where and how to use AI in our products.
Dot Matrix Loaders for Every App (Website)
A repository of over 55 open-source dot matrix loaders is now available for React, TypeScript, and Tailwind CSS users.
Decoder
- shadcn: A collection of reusable components built with Radix UI and Tailwind CSS that users copy and paste directly into their projects.
Original article
55+ free and open-source loaders, built with React, TypeScript, Tailwind CSS, and shadcn. Install one, copy the code, and make it yours.
npx shadcn@latest add @dotmatrix/dotm-square-3The First Collaborative Design Agent Workspace (Website)
Open Design AI is positioning itself as an open-source alternative to Claude Design for collaborative, agent-driven prototyping.
Decoder
- Claude Design: A set of AI-driven design capabilities recently popularized by Anthropic to bridge natural language prompts with functional UI code.
Original article
Open-source vibe design workspace & Claude Design alternative — build prototypes, landing pages, dashboards, slides, and HTML video with your own coding agent.

Ultra-Fast Zero-Dependency Shaders for Your Designs (Website)
New zero-dependency canvas shaders are available for high-performance design effects without external libraries.
Decoder
- Shader: A program that runs on the GPU to manipulate pixels or vertices, commonly used in web design for fluid animations and image filters.
Original article
Full article content is not available for inline reading.
Sharing AI progress in mathematics
OpenAI has published a repository of formal mathematical proofs generated by an internal frontier model, including compute usage statistics and Lean code.
Decoder
- Lean: An interactive theorem prover and programming language used to verify mathematical proofs formally through computer-checked logic.
Original article
OpenAI has released a broad range of mathematical results produced by an internal frontier model. It has published the results in a GitHub repository along with protocols for paper revisions and citations. The repository contains formalizations of many of the proofs in Lean and will be updated with more formalizations as they are obtained. It also includes 10 summaries of the model's reasoning, estimations of compute spent in terms of Pro usage on ChatGPT, and statistics about the number of attempted problems.
The Cyber Risk Discourse is Broken
Industry analyst Nathan Lambert argues that current bans on open-weight models may inadvertently weaken cybersecurity by hindering defensive innovation.
Deep dive
- Open-source models like GLM-5.3 have not resulted in the catastrophic cyber-attacks predicted by proponents of restrictive access.
- Closed-model APIs have been documented as the source of most AI-assisted cyber incidents.
- Restricting open models prevents their deployment in air-gapped or sensitive government environments where cloud access is impossible.
- Chinese AI labs face stronger domestic political and social oversight than Western counterparts.
- The current discourse suffers from ad hominem arguments and a lack of data on how Chinese companies actually assess safety risk.
- Policy decisions should focus on the minimum compute required for safety evaluations rather than broad bans.
Decoder
- Air-gapped: A security measure where a computer or network is physically isolated from unsecured networks, including the public internet.
- FelonyBench: A benchmark used to evaluate how likely an AI model is to assist in illegal or malicious activities.
- Endogenous: Originating from within a system or organization; in this context, internal development of safety cultures.
Original article
The Cyber Risk Discourse is Broken
Open-weights, ideology, and acknowledging trade-offs.
I’ve had one too many discussions on the cyber risks of open models — where someone assumes that either banning open models happens in a silo (and bad actors will somehow actually be stopped) or that China is a threat and doesn’t care about AI safety — that I feel we’re going to end up making policy decisions that both limit American AI competitiveness and increases long-term cyber risk. I feel like we’re locked in on a path of lose-lose situation, unless people embrace nuance, trade-offs, and scary realities.
Much has been written about the views of various players in this debate, which I summarize as follows:
- Open weight models pose an untenable risk to society’s functionality, occupied by frontier lab leadership and the national security community in the U.S.
- Western voices saying open weight models are necessary for defense and banning them will make the world less safe, occupied by AI risk moderates to different extremes. I include myself in this bucket, along with Hugging Face’s perspective after the OpenAI incident, and others like Joshua Saxe.
- Chinese companies continuing to release open-weight models with strong cyber capabilities, who are making decisions based on the risk assessments of their society and government.
This list is also organized by volume or clarity of message in the Western AI ecosystem. The risk-focused discussions have been disproportionately visible, including pieces of work which I view as very detrimental to potential of engaging across assumed party lines on this issue. There’s also very little substantive engagement trying to understand how Chinese companies assess risk — rather, mostly arguments that border on ad hominem attacks like “Chinese labs don’t care about safety.”
The delusions of the anti open-weight alliance
The most recent publication from the “open-weights are dangerous” crowd was the report by Anthropic on the risks of GLM-5.3 as an offensive cyber tool. The problem with this is not the technical research they did, which is largely reasonable, but the failure to engage on more cross cutting questions like: What happens if we ban open models due to cyber risks or why do Chinese companies deem these models safe to release?
These questions, which I’ll come back to, are the ones we need to answer to understand the ecosystem perspective on current AI risks. All policy actions happen in a multi-piece puzzle, where the shape of risk can be changed, but it is rare that you get a universally better outcome. They are all trade-offs.
This sort of solipsistic writing by Anthropic fits very closely to another type of discourse I’m hearing about regularly that is determining the fate of open models and AI broadly — classified briefings. I’ve had many discussions with people who say something like “Look, I’m pro open models, but if you’re seeing what I’m seeing, it’s an onslaught out there due to [XYZ Chinese open-weight model] and we need to act.”
This perspective flies in the face of public information, where to date closed models have been documented as the cause of most existing cyber attacks. As someone who tries to make grounded predictions, the evidence of numerous attacks from OpenAI models is the only data I have on the shape of cyber risks (or, you can broaden the scope to include all of FelonyBench). There are a few possible explanations, and it’ll take years to get to the true answer:
- Maybe open model weights and closed model APIs (with some safe guards) are both far closer to being easy to mis-use, rather than API models being closer to safe. The trope "Open Dangerous, Closed Safe" may be closer to "Open Unsafe, Closed Unsafe."
- Maybe there are far fewer bad actors who are willing to use AI models for “loud” cyber attacks that target crucial infrastructure in the US or powerful and underprepared institutions. Closed models have stronger capabilities and stronger safeguards (in theory), but the stronger capabilities part could matter more in net harm if the safeguards on both are porous.
- I have a lot more to learn about how the cybersecurity ecosystem works, so I won’t support this full-heartedly as one of my current recommendations, but I think it’s at least a reasonable argument that open weight models as a diffusion tool for cyber defense could be the best tool we have to prevent harm over the next few years. There are many domains, e.g. sensitive government agencies, where open-weight models are the only tools that can be deployed in the near-term on air-gapped networks.
Lots of this situation seems like the messy reality being hard to pin down, where the logical limits are clearer. I may agree with the simple reality that closed models are far safer in the limit, as a technical tool with more layers of protection, but they may actually be causing more harm in the near term because of how accessible model APIs are. Still, much of the impact of the tools comes down to how they’re used and controlled. A duopoly on such a crucial tool may be the defining, risky part. This is the debate we’re having, and over time, as intelligence diffuses, many things may change.
These together make me come to the conclusion that if you think the latest open-weight models need to be banned to slow the diffusion of cyber risks, you probably also need to make public-facing APIs for the frontier closed-models illegal. The current stack of safeguards on closed models is stronger than open-weight models, but far from perfect. It is very likely that cyber capabilities of closed models increase much faster than guardrail performance, and a world where open models are banned while closed models continue to progress would be increasing the offense-defense cyber gap. It will take meaningful time to build mitigations that allow defenders to use strong AI models on their private infrastructure if we remove access to strong open-weight models.
Explaining China’s AI risk posture
China cares about AI safety. They have come to this discourse in a complete, endogenous manner relating to Chinese culture and power structures. There are some big picture pieces of this puzzle that reflect in other ways, such as Chinese society’s techno-optimism that extends into AI and the Chinese government’s complete focus on political stability. These things do, of course, interface with emerging AI risks like cybersecurity.
They are in their own AI risk dynamic, which hasn’t risen to the prominence of the political dance between the White House and the frontier labs which we have followed in the U.S. for a few months. My understanding is that the Chinese companies have to register every major model release with the Chinese government. This includes evaluations, which originated around information control for banned government information. It is unclear if this framework has expanded meaningfully into any risks like cyber or bio. The Chinese government is very decentralized and information from the labs needs to go through existing structures to make it to the top.
At the same time, there is a much stronger air of social risk in China, where leading AI researchers aren’t allowed to leave the country and the industry is closing off to foreign investment. On balance I would guess the personal risks facing people by unleashing any domestic harms would be much higher than in the U.S., where the worst case is that your company gets deleted.
Overall, the political oversight seems much earlier than in the U.S. The Western AI companies’ core principle is close to “the best way to stop a bad guy with AI is to be a good guy with AI.” In China, these companies are much more practical about building a wonderful tool, and in many cases building a tool that complements their existing businesses.
I do think that the companies consider the global implications of their work. These labs also clearly are incentivized, and often pushed via the government (at least in public messaging) to compete as much as they can. Running comprehensive safety evaluations on a frontier model like Kimi K3 could cost tens of millions of dollars in compute. These labs would much rather leave that for training.
The correct debate is “what is the correct minimum amount of compute a lab should spend on safety testing before releasing each model?” There’s surely a case to be made that it’s more than the Chinese labs do, or at least they should be more transparent on what they do, but I would be hard pressed to agree if you said the minimum amount of compute would match what Anthropic or OpenAI does. It is not clear that, for all the effort Anthropic and OpenAI make on creating an institution that prioritizes understanding risks, they put it before business value and economic success in their priority stack. This “hands off the wheel” vibe from incidents like the HuggingFace—OpenAI incident was one of my lasting takeaways. It’s exemplified in the Hacktron hacking of OpenAI — it’s hard to be the world’s trust cyber partner if your own house is teeming with leaks. I trust many of the individuals at the labs to work hard to ensure safety, but I’m not trustworthy of the institutions overall.
Open-weight Mythos in April would’ve been fine?
When Claude Mythos was announced, it was previewed as if it was a new class of cyber weapon, where if it ended up in the wrong hands it would’ve caused mass societal destabilization.
It seems like this was wrong.
By all measures, GLM-5.3 is the model that crosses that threshold of capability, and there’s little public evidence that much has changed, and we’re over a month out of the model weight release.
In fact, I would go further. If Claude Mythos was accidentally released as open-weight, it seems like the world would have been more or less fine. Yes, there would be a clear increase in cybersecurity incidents and it would be bad for society if the model leaked, but it would be a scenario that looks more like an acceleration than a step change in risk.
The leading proponents of this new wave of open-weight fear mongering have effectively been making a falsifiable prediction — that the current open-weight models are going to cause substantial, not seen before AI harms by crippling our cyber infrastructure.
Based on all the evidence I have, which I’ve unpacked above, they’re set up to be wrong. At least now, after so many years of debating open weight risks, we will start to get some real answers.
Introducing Personal Agent Protocol
Meta and Sierra have partnered with companies like Shopify and Stripe to launch the Personal Agent Protocol, a standard for how AI agents interact with businesses.
Decoder
- Agentic: Refers to AI systems designed to perform multi-step actions and decision-making on behalf of a user, rather than just generating text or answers.
- OAuth: A standard protocol for authorization that allows third-party services to access resources on behalf of a user without requiring them to share their password.
Original article
Personal AI agents are taking the world by storm. People are using them to do everything from scheduling appointments to booking flights and shopping for car insurance. It’s extraordinary how fast AI is changing consumer behavior and how many of us are having those incredible “wait, it just did that” moments with our personal agents. Unsurprisingly companies are asking how they can best respect their consumers’ choices while also protecting their privacy and security.
So today we’re excited to announce Personal Agent Protocol — an open standard Meta and Sierra are developing along with industry partners at Genesys, Instinct, Rocket, Shopify, Stripe, and Walmart that defines how personal agents interact with businesses. We’re designing it to handle authentication, empower consumers and give companies visibility into what personal agents do through their websites, APIs or company agents. It’s open for anyone to implement.
The problem to be solved
Today most personal agents use websites and apps the way people do — loading pages and clicking through forms. When that can’t get the job done, they may call the company’s support line or open its web chat. This can take a long time, and the agent might fail to complete the task. But a direct connection could get the same task done securely in seconds.
To be adopted at scale, that connection has to work for all parties. Everyone wants security, but they have different needs, too:
- Consumers want speed, dependability, and trust — for the job to be done right the first time, by a personal agent they can count on to act in their best interests.
- Brands want visibility and control — to know when a personal agent is acting for a customer and to decide for themselves what it can do.
- Companies building personal agents want efficiency and access — a direct, consistent way to work with participating companies.
How it works
The principle behind the Personal Agent Protocol we’re building is that consumers decide what access to give their personal agents, and companies set parameters for what those agents can do. It enables companies to work with personal agents in the way that is best for their customers: through their existing websites and APIs, or through an agent of their own.
Personal Agent Protocol starts on the website, where a personal agent can discover what the company offers and how to reach it. The personal agent then begins a session on its user’s behalf. It can start as a guest, which may be enough to check product availability or ask about a returns policy. When a task requires access to a customer’s account, they can sign in on the company’s page or use credentials they have already set up with their personal agent. The customer is always in control, deciding whether the agent has read-only or write access.
The session is built on OAuth, an established standard for authorizing access. It carries across channels, so a question asked before sign-in and an order change made afterward are part of the same visit. From there, the personal agent can get the job done using whichever routes the company believes will offer the best customer experience:
- Its website: navigating the company’s regular web pages.
- Its APIs: connecting through interfaces built on standards such as MCP and OpenAPI.
- Its agent: working through tasks that need conversation, such as a warranty claim.
The company decides what it makes available, the personal agent gets a consistent way to connect, and the customer gets a faster way to get things done.
What comes next
We want to develop this protocol with the companies and personal agent builders using it and are excited that Instinct will also be joining the effort. We welcome all partners and plan to publish the v0.1 specification later this month, host design workshops with interested parties, and publish a reference implementation to help developers get started.
More detailed permissions could let customers and companies set limits on specific actions. Push notifications could let a company tell a personal agent the moment a flight is delayed or an order ships. Payments extensions could let a personal agent complete a purchase without sharing credit card information.
As personal agents take on more of our everyday tasks, companies need clear, secure ways to work with them while continuing to deliver a trusted experience. Personal Agent Protocol gives them that foundation — so the company and the personal agent can get the job done for the customer they share.
“Personal AI is creating a new front door to the enterprise. Brands need a trusted way to know who an AI agent represents, what it’s authorized to do, its intent, and how to work with it securely. Personal Agent Protocol is an important step toward creating the shared foundation this new era of customer experience will require.” (Tony Bates, Chairman & CEO, Genesys)
“The next era of AI is about persistent agents taking action. Rocket and Redfin are building for that world now. Our agentic technology, developed with Sierra, allows a Muse agent to move across our platform, from finding a home, to securing financing and beyond, all in real time. Nobody else has the data, technology and homeownership ecosystem to make that possible.” (Shawn Malhotra, Chief Technology Officer, Rocket Companies)
“As personal agents become part of everyday life, merchants have a new frontier for excellent customer service. From answering product questions to supporting purchases, returns, and exchanges, the ambition is to turn a buyer’s intent into an outcome that delights them. Personal Agent Protocol helps establish how agents and merchants can work together to make that happen.” (Mani Fazeli, VP Product, Shopify)
“A customer relationship doesn’t start or end at checkout. When customers send an agent, they expect the same service they’d get themselves. We’re contributing to the Personal Agent Protocol to give businesses a standard way to recognize their customers’ agents, efficiently interact with them, and shape their customer relationships.” (Kevin Miller, Head of Payments, Stripe)
A $12B DeepSeek Raise Is Reportedly Close, With Tencent And CATL Among Backers
DeepSeek is reportedly closing a $12 billion funding round led by Tencent and CATL as it prepares for a potential Shanghai STAR Market IPO.
Deep dive
- Round reportedly exceeds 80 billion yuan (~$12 billion)
- Backed by Tencent and battery giant CATL
- Hiring CITIC Securities to advise on a possible IPO on the Shanghai STAR Market
- Follows an initial outside raise in June that included 20 billion yuan of the founder's personal wealth
Decoder
- STAR Market: Formally the SSE STAR Market, it is China's technology-focused stock exchange located in Shanghai, similar to the US NASDAQ.
Original article
Chinese AI lab DeepSeek is close to raising at least 80 billion yuan, about $12 billion, from investors including Tencent and CATL, people familiar with the matter said.
Key Points:
- DeepSeek is close to securing at least 80 billion yuan, well above its original target of 50 billion yuan.
- Tencent and battery maker CATL have committed some of the largest sums, and the total could approach 100 billion yuan.
- The raise comes as the company prepares for a possible listing on Shanghai's STAR Market.
DeepSeek Funding Round
The financing is set to close soon, and term sheets already signed suggest the final tally could approach 100 billion yuan, people familiar with the matter said Tuesday. DeepSeek first sought about 50 billion yuan. Interest outran that target after the company released its latest AI model, the people said, asking not to be named because the details are private.
DeepSeek has not announced the round.
One person with knowledge of the matter put the raise at more than 80 billion yuan, with money coming from both existing and new investors. The round opened in July at a target valuation of 500 billion yuan, about $74 billion, a month after the company's first outside raise. Two people said it should wrap up in October.
A separate account described state-backed funds and corporate investors competing for stakes while DeepSeek limits participation by individual investors, with the final amount still subject to change. DeepSeek, Tencent and CATL did not immediately respond to requests for comment.
Tencent, CATL Stakes
Tencent's own Hunyuan model trails domestic rivals including ByteDance's Doubao and DeepSeek, and the new commitment deepens the WeChat operator's tie to that lab.
A closer relationship could help Tencent keep pace with rival Alibaba, which has prioritized its in-house Qwen model, according to reporting from June. Tencent put 10 billion yuan into the first round, and CATL 5 billion yuan.
The money builds a reserve ahead of a domestic initial public offering, which one account placed in early 2027. DeepSeek hired CITIC Securities to prepare for a possible listing on Shanghai's STAR Market, though timing, valuation and size remained undecided as of last month.
The round would be DeepSeek's second since June, when a first outside raise of about 50 billion yuan closed with founder Liang Wenfeng committing 20 billion yuan of his own money. Until then, Liang had funded the lab himself through his hedge fund High-Flyer. DeepSeek drew global attention with its R1 model in early 2025, released V4.1-Flash last month and recently partnered with Huawei on programming tools for Ascend AI chips.
Hark debuts an AI agent a year before its first devices
Brett Adcock's Hark is shipping its AI agent service to early users today, though the company's promised physical hardware is not expected until 2027.
Original article
Brett Adcock’s Hark has released Hark Pro, an agent that buys groceries, books cars, pays bills and refills a child’s lunch card, free with $20 and $100 monthly tiers, a year before the company’s first devices arrive. Meta launched an agent doing the same things at the same three prices four weeks ago.
Hark has released an AI agent that buys groceries, books cars and pays bills, a year before any of its hardware arrives. It is free, with tiers at $20 and $100 a month. Meta launched an agent that does the same things at the same three prices four weeks ago.
Hark Pro runs on the web and as an iOS or Android app, as Bloomberg reported. A cloud system called Handoff remembers what it is told, and the company says it juggles up to six browsers at once and can log in to millions of sites. Action Buttons pay a bill or cancel a service.
One example the company gives is noticing that a child’s lunch card is low and refilling it. Another is inferring from email that a flight is booked but a hotel is not. It stores card details and passwords in an encrypted vault that Hark says even it cannot see inside.
The devices come in 2027.
We reported in May that Hark had raised $700M at $6B two months after leaving stealth, with Nvidia, AMD Ventures, Intel Capital and Qualcomm Ventures in the round. Brett Adcock put in $100M of his own money first, and also runs Figure AI.
Nobody outside the company has seen the hardware.
Abidur Chowdhury, head of design and a former Apple lead on the iPhone Air, said the devices should be “portable, and useful in the home and workplace”, and that “we don’t really believe in glasses with cameras or a pin you can wear”. AT&T is supplying the cellular service.
The competition is already shipping the software part.
Meta’s Muse books, buys and negotiates, pays through Stripe’s Link and costs nothing, $20 or $100 a month, which is the same ladder Hark has just set.
It is rolling out in the United States, on iOS, Android and the web.
OpenAI’s first device is a $300 speaker designed by Jony Ive’s studio, also due in 2027.
None of them has settled how an agent pays for anything in Europe.
A payment approved by software on somebody’s behalf has no carve-out from the strong customer authentication rules, which were written for a person approving a transaction tied to a named payee and an amount, and Hark has not said whether Hark Pro is available in Europe at all.
(Correction: this article originally gave the number of browsers Handoff can run as 36. Hark says it is six. Updated 6 October 2026.)
OpenAI Releases Findings on 377 Math Problems, Further Roiling Field
OpenAI published 377 mathematical solutions generated by an unreleased model, sparking debate over whether the system is truly reasoning or mimicking human proofs.
Original article
OpenAI released hundreds of new findings spanning a wide range of topics including algebra, number theory, theoretical computer science, mathematical logic, and topology. These were solved with an internal model that has not been released publicly. There is debate on whether OpenAI's systems were employing creative thinking or simply completing the final steps of a proof after borrowing ideas from human mathematicians' work. OpenAI has provided summaries of how its models came up with the solution for 10 of the problems.
Apple to Launch Doorbell, Lock, Thermostat Developed With LG
Apple is collaborating with LG to launch a suite of smart home devices, including a thermostat and lock, hitting the market October 13.
Decoder
- Matter: A unified, open-source connectivity standard that allows smart home devices from different brands to communicate seamlessly.
- Thread: A low-power, self-healing mesh networking protocol designed for smart home devices.
Original article
Apple plans to launch several devices developed through a partnership with LG as part of an ecosystem of devices that work with its new smart home hub. These include a doorbell, thermostat, an upgraded HomePod mini, and a fresh TV set-top box. The products, set to launch on October 13, will carry the LG brand. Most of the devices will include support for Wi-Fi, Bluetooth, Thread, and Matter.
The Decision Model Gold Rush
TypeSafe's 'Jev' decision model saw rapid adoption across AI Gateway workflows, signaling a growing trend toward specialized, confidence-scoring AI outputs.
Decoder
- Decision Model: An AI model trained specifically to classify inputs into choices or binary outcomes (yes/no) rather than generating open-ended prose.
- AI Gateway: A proxy service that sits between an application and various AI model providers to manage, route, and observe API traffic.
Original article
Decision models return a choice, a score, or a yes-or-no with a confidence number stapled on. Within a day of launch, TypeSafe's Jev decision model had been wired into 13% of Vercel's paid AI Gateway customer workflows, and within three days, Cloudflare, LangChain, and Langfuse had shipped integrations for it. It took competitors about two weeks to show up. The field is evolving quickly - this post looks at the criteria and nuances of using decision models in production to help readers decide which model to use.

An application in Lisp you grow by talking to it
Geoffrey Huntley built Jiti, a Lisp kernel that allows developers to add application capabilities in real-time by chatting with an LLM.
Deep dive
- Kernel Architecture: Jiti acts as a thin layer for managing the Lisp runtime, providing tools for the LLM to read, redefine, and execute functions.
- Interactive Development: Changes are made to the live memory image, eliminating the need for traditional compilation or CI cycles.
- Compositionality: Once a capability is written by the LLM, it becomes a standard Lisp function that can be called by other functions or future prompts.
- State Management: The kernel provides transaction machinery to ensure that changes are consistent and can be reversed if necessary.
- Tooling: Uses the OpenAI agent tool interface to distinguish between requests to 'develop' (modify source) and 'execute' (call existing logic).
Decoder
- Lisp image: A representation of a running program in memory that includes both data and compiled functions, which can be modified at runtime.
- REPL (Read-Eval-Print Loop): The environment Lisp uses that allows for the interactive evaluation of code, which enables the "live" modification described.
Original article
It's kind of strange seeing all these discussions about software factories... and the like. It's also strange to see conversations about programming languages or claims that $language is best, as if that will remain true going forward. It's very clear, however, that programming languages will converge toward something, but that 'something' is undefined for now.
What I haven't seen is people really deeply understanding the power of the new substrate that we have. People are still too fixated on what they have now and how systems have been built to rethink fundamentally how much things can change.
To me, a software factory isn't just about process automation; it isn't about automating everything you've got as it is now. It's about using this substrate so you can develop your product while it runs whilst in the product itself.
Everyone (regardless of their discipline or background) in the company should be able to develop the product in the product without having to go to some external vendor supplied tool.
The only tool that exists is your product itself. The product should build the product from the product.
In a future blog post, I'll go further into what it means for the product to develop the product, in the product, but for now I have one simple thing for you to imagine:
Why is software built the way it is now, rather than grown through iterative use of LLMs? What if you could develop your application just by chatting with it? Live and interactive with no compilation steps.
To demonstrate this, I built Jiti, a small kernel for growing a running Lisp application through conversation with an LLM. You ask for a capability, the model writes Lisp, and the application permanently acquires that capability until you ask for that capability to be removed.
The kernel supplies the machinery to inspect, change, execute, and recover a managed Lisp world. Application behavior comes from whatever you decide to add to the application by prompting for those outcomes. With Jiti, you can start from a clean slate or modify an existing application to add more behavior just by prompting it.
The source code is available on GitHub, and I encourage you to run it and play around with it. It is very generic, in the sense that it can do literally anything you want. All you have to do is ask, and it will program that capability into the application.
How it works is relatively simple. At a high level, an OpenAI model receives your request, instructions for operating the application, tool definitions, and observations of its current state. The kernel can ask to inspect the available functions, read a definition, propose new source, or execute an expression.
Once a definition is accepted, it is an ordinary Lisp function. Calling it does not inherently require another inference request. You can call it from Lisp, from another application function, or through the chat interface.
The OpenAI model is used to extend a program, while the running Lisp world holds the resulting functionality.
The agent tool interface has two useful intentions.
develop_formadds, redefines or removes functionality.execute_formcalls functionality that exists, including combinations of existing functions.
Both use the same evaluator and transaction machinery. The distinction helps the model choose whether the user is asking to change the application or simply use it.
Suppose I've already asked the application to add uppercase-string and reverse-string. I can then prompt the kernel to uppercase some text and reverse the result. The composition is just Lisp:
(reverse-string (uppercase-string "Hello"))If I want that combination as a reusable capability, I can prompt it to save that as a function.
(defun shout-backwards (text)
  (reverse-string (uppercase-string text)))
That function joins the catalog with its arguments and source, ready for inspection and later use. A future request can discover it and build on it. The application accumulates an executable vocabulary through use. Lisp already gives us the composition rules; the kernel keeps the evolving definitions available and their managed effects accountable.
Lisp deserves the credit for the interactive programming machinery. Definitions, inspection, conditions, and restarts have been there for decades. It's kind of cool, huh?
To me, the idea that an agent writes source code and then there's a costly compilation phase involving CI/CD is now truly undefined now that we have AI. The only limiting factor will really be people's curiosity about what they can do with this new substrate...

When AI agents swarm, can banks keep up?
Banks face security risks from swarms of autonomous AI agents, requiring a shift toward unified data platforms for real-time, cross-system observability.
Deep dive
- Agentic swarms can simultaneously probe multiple attack vectors, bypassing single-control defenses.
- Observability must now extend to AI agent behavior: tools called, APIs invoked, and data accessed.
- Security Operations Centers (SOCs) must evolve to combine human judgment with automated, machine-speed investigation.
- Unified data platforms are required to correlate logs, metrics, and traces with threat intelligence to detect patterns of abuse.
Decoder
- SOC (Security Operations Center): A centralized unit responsible for monitoring, analyzing, and responding to cyber threats across an organization's infrastructure.
Original article
When AI agents swarm, can banks keep up?
As autonomous AI reshapes cyber risk, financial institutions need the visibility and context to detect unusual behavior and respond at machine speed.
AI agents are changing more than just how financial services companies operate. They are also changing the speed and scale of cyber risk.
A recent American Banker article explored an emerging concern for banks: coordinated groups of AI agents capable of probing systems, sharing information, adapting their behavior, and searching for vulnerabilities simultaneously. While the idea of a “rogue AI agent swarm” may sound futuristic, the underlying security challenge is already taking shape.
The next security challenge: Agentic AI
Banks have spent decades building layers of protection around critical systems and data. Identity and access management, multifactor authentication, fraud detection, endpoint security, network monitoring, and increasingly sophisticated security operations have made financial services one of the world’s most security-conscious industries.
Agentic AI introduces a different variable: autonomy at machine speed.
Instead of an attacker manually probing systems one after another, autonomous agents can potentially explore multiple paths simultaneously, learn from what they encounter, and adjust their behavior. For defenders, the challenge becomes recognizing patterns across thousands or millions of signals quickly enough to understand what is happening and determine whether it represents a threat.
That puts visibility and context at the center of the security equation.
AI-driven activity can generate signals across applications, APIs, identities, endpoints, networks, cloud environments, customer interactions, and third-party systems. Viewed independently, many of those events may look perfectly legitimate. A valid credential is used. An authorized API is called. A permitted system is accessed. It is only when those activities are connected that a potentially dangerous pattern becomes visible.
This is where fragmented security and operational data becomes a liability. Security teams need to bring together logs, metrics, traces, security events, threat intelligence, identity information, and historical activity so they can identify relationships that might otherwise remain hidden.
AI defense against AI attacks
Search plays an important role in making that possible. When activity is distributed across systems and happening at machine speed, analysts need to search and correlate enormous volumes of heterogeneous data quickly enough to understand not only that something unusual occurred, but what else happened around it, what systems were involved, and how those events are connected.
The growth of agentic AI also expands the role of observability. Financial services companies increasingly need visibility not only into the health and performance of applications and infrastructure, but into the behavior of AI agents themselves.
Understanding which systems an agent accessed, which tools it invoked, what data it retrieved, which APIs it called, and how its behavior changed over time becomes important whether the agent belongs to the bank, a customer, a third party, or potentially an attacker.
OpenTelemetry-based traces, logs, and metrics can provide a detailed record of agent activity. When that telemetry can be correlated with identity, endpoint, network, application, and threat intelligence data, security teams gain the context needed to distinguish normal automated activity from behavior that warrants investigation.
That distinction will become increasingly important because traditional security controls alone may not tell the entire story. Identity, authentication, least privilege, segmentation, rate limits, and access controls remain fundamental, but an autonomous system can behave unexpectedly without necessarily violating an individual control.
An account might access an unfamiliar system. An agent might begin querying information at an unusual rate or initiate an unexpected sequence of otherwise permitted actions. No single event necessarily indicates an attack. The pattern does.
Detecting those patterns requires analyzing behavior across systems and over time. AI and machine learning can help defenders surface anomalies, correlate seemingly unrelated events, prioritize investigations, and give analysts the context needed to respond faster.
Evolving the SOC for machine-speed investigations
What also changes is the role of the security operations center (SOC). Attackers do not need a human analyst to approve every automated probe, and banks cannot realistically require a person to manually investigate every suspicious machine-generated interaction.
Security operations will increasingly combine human judgment with automated investigation and response. Agentic security can help investigate alerts, correlate evidence across large volumes of security and operational data, reconstruct attack paths, and recommend or initiate response workflows according to an organization’s policies.
For financial institutions, however, greater automation cannot come at the expense of governance. Consequential actions still require clearly defined permissions, controls, and appropriate human oversight. The objective is not to remove people from security operations, but to use automation to handle the speed and scale of investigation while keeping people accountable for the decisions that matter most.
That accountability extends to a bank’s own AI agents.
Governance and transparency in autonomous systems
As financial institutions deploy more autonomous systems, they need to be able to reconstruct what those systems did: which tools an agent called, which data it accessed, what information it used, what actions it recommended or performed, and, when necessary, who authorized those actions.
This is particularly important in an industry already governed by extensive requirements around cybersecurity, operational resilience, data governance, model risk, and accountability. Agent observability and comprehensive audit trails can make autonomous activity something technology, security, risk, and compliance teams can examine and investigate rather than a black box they are simply expected to trust.
The emergence of agentic AI does not make decades of cybersecurity investment obsolete. It increases the importance of connecting those investments.
Identity, endpoint protection, network security, application security, fraud detection, and observability each provide part of the picture. As autonomous systems increasingly operate across those boundaries, financial institutions need a common data foundation that can bring those signals together and make them searchable and actionable in real time.
Bringing it all together on a unified data platform
What makes Elastic unique in this space (in my opinion) is in how we bring security, observability, and search together on a common platform, helping companies analyze activity across complex technology environments and apply AI to that context. This gives financial services companies a foundation for understanding both human and machine activity as AI agents become a larger part of the financial services ecosystem.
The next phase of AI in banking will not simply be about what agents can do. It will also be about whether financial services companies can see what they are doing, understand their behavior, identify when something changes, and respond at the same speed at which autonomous systems operate.
In an agentic world, visibility and context become a large part of the control.

How fast is Python 3.15?
Python 3.15 shows minimal performance gains over 3.14, while its experimental JIT provides a notable 20-28% speed improvement in CPU-bound tasks.
Deep dive
- Standard interpreter performance is flat relative to Python 3.14.
- Experimental JIT provides a consistent 20-28% speed boost in Fibonacci and sorting benchmarks.
- Free-threading builds significantly outperform standard interpreters in multi-threaded scenarios by bypassing the Global Interpreter Lock (GIL).
- PyPy 3.12 remains substantially faster for single-threaded CPU-heavy workloads than CPython 3.15.
Decoder
- GIL (Global Interpreter Lock): A mutex that prevents multiple native threads from executing Python bytecodes at once, limiting concurrency in CPU-bound tasks.
- Free-threading: A build configuration for Python (PEP 703) that removes the GIL to allow true multi-core parallel execution.
Original article
How fast is Python 3.15?
It's October once again, and that means it is time to take the new release of Python for a spin (technically, it is the 3.15.0rc3 release that I'm using, the official 3.15 release is still a few days out). As I did with my Python 3.14 performance article of a year ago, today I'm sharing a new run of my informal Python benchmark, comparing Python 3.15 against previous interpreters all the way back to 3.10.
If you are not interested in the charts and the tables and just want to read my analysis, feel free to jump to the conclusions section at the end.
The benchmark
I just called my benchmark "informal". What does that mean?
Getting an objective and universal measure of the performance of a programming language is impossible. All you can do is write some programs and run them to get a measure of their performance. Other programs may show similar performance characteristics or they may not, there is really no way to know. My intention with this benchmark is just to get a feel for the performance changes across versions of Python, but I want to make it clear that I'm not trying to obtain a comprehensive performance profile of the Python interpreter.
For my benchmark I will be running two programs called fibo.py and bubble.py, which you can inspect if you like. These are the same programs I used in past editions of this benchmark. The first calculates numbers from the Fibonacci sequence, and the second sorts numbers using the bubble sort algorithm.
I've chosen these two programs as representative of two classes of algorithms. The Fibonacci calculation is done using recursion, which I have found to be somewhat inefficient in Python interpreters. On the other side, the bubble sort only uses for-loops, without any recursion. There are other types of programs that my benchmark does not attempt to cover. In particular, note that I'm not including I/O bound code in this benchmark.
Because some of the performance improvements in recent Python versions revolve around multi-threading, I also created a multi-threaded variation for each program, so in total I have four different tests.
The testing matrix
The complete testing matrix is actually fairly complex, because I have to run the four program variations under all the Python versions, plus the JIT and free-threading alternatives for those that have them. I like to run the tests under PyPy as well, because this interpreter has shown impressive performance in past runs of this benchmark. And to place Python performance within the wider ecosystem, I've also ported the two programs to JavaScript (Node.js) and Rust.
Here is the full test matrix that I've worked with:
- 2 test scripts
- fibo.py: calculates Fibonacci numbers, with recursion
- bubble.py: sorts a list of randomly generated numbers, without recursion
- 2 threading modes
- Single-threaded
- 4 parallel threads
- 6 Python versions, plus recent versions of PyPy, Node.js and Rust:
- 3 Python interpreters
- Standard
- Just-In-Time (JIT): only for CPython 3.13+
- Free-threading (FT): only for CPython 3.13+
Readers of my previous benchmarks may recall that I had an additional dimension in my matrix for Linux vs. macOS. Given that there were no significant differences between them in the two previous runs of the benchmark, I've decided to drop the macOS tests this time around, so all tests were executed on my Linux laptop, which has an Intel Core i5 CPU and runs Gentoo Linux.
The method I'm using to measure the performance of each participant in this benchmark is to run the test program three times and take the average duration of the three. In the tables of results that I share below I also show the speed difference versus the 3.15 version, and when it makes sense also the speed difference versus the previous version of a given interpreter. For speed comparisons I'm using a simple ratio, where 1x means same speed, 0.5x means half speed (or that it took twice the time to run), 2x means twice as fast (or that it ran in half the time if you prefer), etc. Hopefully this makes sense.
Test 1: fibo.py, single-threaded
Let's get started. The first test calculates the first 40 Fibonacci numbers.
| fibo(40) - 1 thread | Time (secs) | vs. 3.15 | vs. previous |
|---|---|---|---|
| 3.10 | 15.9442 | 0.44x | |
| 3.11 | 9.4058 | 0.74x | 1.70x |
| 3.12 | 8.8545 | 0.78x | 1.06x |
| 3.13 | 8.8174 | 0.79x | 1.00x |
| 3.14 | 7.1659 | 0.97x | 1.23x |
| 3.15 | 6.9361 | 1.03x | |
| pypy3.12 | 1.2517 | 5.54x | |
| node-26.3 | 1.3899 | 4.99x | |
| rust-1.97 | 0.0898 | 77.24x |
From these results we can infer that for this test Python 3.15 is just a tiny bit faster than 3.14, probably not enough to matter. As I have also observed in previous years, the performance of PyPy 3.12 is out of this world, clocking in at 5.5x the speed of 3.15, and even getting a small lead over Node.js. As for Rust there are no surprises, but it is always good to know where the limits are!
Comparing each Python release against the previous one shows an interesting detail. The only two releases that made significant performance improvements over their predecessors are Python 3.11 and 3.14. You can see this clearly in the chart, when there is a larger drop in the height of a bar compared to the previous one. The other releases either maintained the same speed or made small improvements, so overall there's always been progress.
In the next set of results you can see the progress of the JIT and free-threading (FT) releases of Python on the same test. Keep in mind that these alternative versions of the Python interpreter were first introduced in 3.13, so the range of versions to evaluate is much smaller.
| fibo(40) - 1 thread | Time (secs) | vs. 3.15 | vs. previous |
|---|---|---|---|
| 3.13 JIT | 8.8339 | ||
| 3.14 JIT | 7.1587 | 1.23x | |
| 3.15 JIT | 5.7625 | 1.20x | 1.24x |
| 3.13 FT | 12.0368 | ||
| 3.14 FT | 7.1185 | 1.69x | |
| 3.15 FT | 7.0298 | 0.99x | 1.01x |
Really the most interesting thing from this is that the JIT in the 3.15 interpreter was faster than the standard interpreter of the same test, which was not the case in previous years. And a 1.20x speed increase is not negligible, this is very exciting to see!
On the free-threading front there isn't really a lot to expect because this test is single-threaded. But we can say that the performance of the free-threading interpreter is about the same as the 3.14 one.
Test 2: bubble.py, single-threaded
Let's look at the second test now. Here are the table and the chart for the single-threaded bubble sort test, which was configured to sort 10,000 random numbers:
| bubble(10000) - 1 thread | Time (secs) | vs. 3.15 | vs. previous |
|---|---|---|---|
| 3.10 | 3.9918 | 0.49x | |
| 3.11 | 2.6237 | 0.75x | 1.52x |
| 3.12 | 2.7341 | 0.72x | 0.96x |
| 3.13 | 2.833 | 0.70x | 0.97x |
| 3.14 | 2.0575 | 0.96x | 1.38x |
| 3.15 | 1.9716 | 1.04x | |
| pypy3.12 | 0.1073 | 18.37x | |
| node-26.3 | 0.0643 | 30.66x | |
| rust-1.97 | 0.0391 | 50.42x |
As in the previous test, here we can also see that 3.15 had a very small improvement in performance with respect to 3.14. And we again can see that 3.11 and 3.14 are the two recent releases of Python that have really moved the needle in terms of performance. Some releases are even showing small regressions on this test. PyPy continued to be very fast, but for this test Node.js was faster.
The next table and chart show the results for the JIT and free-threading editions of the Python interpreter:
| bubble(10000) - 1 thread | Time (secs) | vs. 3.15 | vs. previous |
|---|---|---|---|
| 3.13 JIT | 2.5887 | ||
| 3.14 JIT | 2.3624 | 1.10x | |
| 3.15 JIT | 1.5435 | 1.28x | 1.53x |
| 3.13 FT | 4.1888 | ||
| 3.14 FT | 2.7248 | 1.54x | |
| 3.15 FT | 2.6808 | 0.74x | 1.02x |
This shows the same overall picture from the first test. The 3.15 JIT once again shows an impressive 1.28x speed gain over the regular interpreter. The free-threading version shows a performance drop with respect to the standard interpreter, but a similar drop occurred with the 3.14 interpreter, so this is not a regression. As I said before, this does not matter much because this test is single-threaded, so it isn't the kind of application that will ever help the free-threading interpreter shine. I think it is reasonable to expect the free-threading interpreter to perform comparably to the regular one, so from that point of view we can say that there is work to be done yet.
Test 3: fibo.py, multi-threaded
Let's now repeat all the tests, but running 4 threads in parallel. Given that this is a very specific test that is designed to evaluate the free-threading version of the Python interpreter, I'm dropping the non-Python runs.
To get a baseline, first I ran the multi-threaded test on the standard Pythons. To be absolutely clear, these results are going to be bad for CPython, because the global interpreter lock (GIL) prevents true concurrency between threads. Here are the results and chart for the multi-threaded Fibonacci test:
| fibo(40) - 4 threads | Time (secs) | vs. 3.15 | vs. previous |
|---|---|---|---|
| 3.10 | 67.2867 | 0.48x | |
| 3.11 | 49.726 | 0.65x | 1.35x |
| 3.12 | 38.7307 | 0.84x | 1.28x |
| 3.13 | 38.9421 | 0.84x | 0.99x |
| 3.14 | 31.8367 | 1.02x | 1.22x |
| 3.15 | 32.5421 | 0.98x | |
| pypy3.12 | 5.6385 | 5.77x |
This test shows 3.15 being a tiny bit slower than 3.14. We've seen in the single-threaded tests that the 3.15 interpreter was only slightly faster than 3.14, so overall I think we can say that the standard interpreter is about the same speed as 3.14. Here we can also see that PyPy continues to run circles around standard Python, but with the threads its speed slowed it down by a similar ratio, because PyPy's concurrency is also affected by a GIL.
Now let's see how the JIT and free-threading versions of the Python interpreters do on this test.
| fibo(40) - 4 threads | Time (secs) | vs. 3.15 | vs. previous |
|---|---|---|---|
| 3.13 JIT | 38.5661 | ||
| 3.14 JIT | 30.9696 | 1.25x | |
| 3.15 JIT | 27.1641 | 1.20x | 1.14x |
| 3.13 FT | 12.4376 | ||
| 3.14 FT | 7.3052 | 1.70x | |
| 3.15 FT | 7.235 | 4.50x | 1.01x |
The free-threading edition of the Python 3.15 interpreter runs about 4.5 times faster than the standard interpreter, and the ratio was about the same with 3.14. This significant speed gain can be attributed to the interpreter running without the GIL, which allows for more efficient thread concurrency.
A secondary observation that we can make from these results is that the JIT edition of the interpreter, which runs with the GIL, keeps a similar edge over the standard interpreter even when running multiple threads, and this is new with 3.15.
Test 4: bubble.py, multi-threaded
We have one more set of results to go over. Here are the standard interpreter results for the bubble sort test:
| bubble(10000) - 4 threads | Time (secs) | vs. 3.15 | vs. previous |
|---|---|---|---|
| 3.10 | 16.5959 | 0.51x | |
| 3.11 | 10.7541 | 0.79x | 1.54x |
| 3.12 | 10.979 | 0.77x | 0.98x |
| 3.13 | 11.1337 | 0.76x | 0.99x |
| 3.14 | 8.7198 | 0.97x | 1.28x |
| 3.15 | 8.4514 | 1.03x | |
| pypy3.12 | 0.5165 | 16.36x |
This is, again, more or less in alignment with the previous results, with the 3.15 interpreter just a hair faster than 3.14.
Now that we have the baseline for this test, let's have a look at the JIT and free-threading interpreters:
| bubble(10000) - 4 threads | Time (secs) | vs. 3.15 | vs. previous |
|---|---|---|---|
| 3.13 JIT | 10.3004 | ||
| 3.14 JIT | 9.9454 | 1.04x | |
| 3.15 JIT | 6.6417 | 1.27x | 1.50x |
| 3.13 FT | 8.0547 | ||
| 3.14 FT | 4.9934 | 1.61x | |
| 3.15 FT | 4.8549 | 1.74x | 1.03x |
And here the free-threading 3.15 interpreter is once again faster than the standard one. The gains are not as impressive as in the Fibonacci test, but this type of program is still a good use case for a GIL-free interpreter.
As for the JIT results, they seem consistent with all other runs of this interpreter, which show a great improvement in 3.15.
Conclusions
I hope you enjoyed looking at my benchmark. Maybe in addition to seeing a bunch of numbers and colorful charts, you are wondering what does this all mean in practical terms.
What I want to do before ending this article is to give you my personal interpretation of what these numbers suggest, because you may want to know if it makes sense to upgrade to 3.15, and what improvements you can expect to see when you do. In this section we are leaving determinism and enter opinion territory, so please keep in mind that someone else looking at these numbers may have a completely different interpretation than mine!
With the disclaimer out of the way, I'll say that my gut feeling after running the tests is that Python 3.15 is at best a fairly minor improvement over 3.14 in terms of performance. I may eventually upgrade production projects I currently have on 3.14 such as this website, but the results that I obtained do not make me want to rush an upgrade like I did after seeing such great results with 3.14 last year.
The only area where there is a clear improvement in the 3.15 release is in the JIT. But the JIT continues to be an experimental feature, so it is not a good idea to use it in production. I will consider using the JIT in production only when it is out of the experimental phase.
Aside from the JIT, there aren't really any significant performance gains in this release. Some tests do show a small performance increment, but others show regressions, so I don't expect these small variations to translate into noticeable performance changes for a real world project. I honestly don't feel I'm losing anything by staying on 3.14 for a few more months, or even until 3.16 drops in a year and I have one more release to evaluate.
I do, however, plan to use 3.15 as my main day-to-day interpreter, and maybe I will end up upgrading some of my production projects just so that I can use some of the new features, such as the JavaScript-like unpacking of comprehensions or the lazy imports.
Capcom Plans to Use AI to Speed up the Game Development Process
Capcom is rebranding its RE Engine as REX to integrate AI tools that streamline development workflows rather than generating game assets.
Decoder
- RE Engine: Capcom's proprietary game engine used for titles like Resident Evil, Monster Hunter, and Devil May Cry.
Original article
Capcom plans to use AI to speed up the game development process
The company previously said it won’t use AI-generated content in its games.
Video game companies are increasingly leaning on AI to help develop new titles and Capcom will be the latest to embrace this approach. During a company conference, Capcom detailed the next steps for the RE Engine, its proprietary video game engine, that includes using AI to improve efficiency during the game development process. As first reported by GameBiz and IGN, Capcom's game engine would undergo a major improvement project called REX, to eventually become a "game engine of the AI generation."
Capcom's programmer Satoshi Ishida explained during the conference that the AI usage would mostly help with streamlining development workflows. Ishida explained that games and their assets have become much larger these days, leading to longer development times. From Capcom's latest remarks, it doesn't seem like the company will be using AI-generated assets in its video games, but instead employing AI to speed up the game development process.
Previously, Capcom said during a Q&A portion of a shareholders' meeting that it would explore ways to use AI to assist with things like graphics, sound and programming but clearly stated that it would not use AI-generated content in its games. This approach would line up with Capcom's desire to breathe new life into some of its older franchises, especially since the company saw success with the release of Onimusha: Way of the Sword. Other major game companies have also welcomed the use of AI for game development, like Epic Games who detailed that it would incorporate Claude and Gemini into Unreal Engine earlier this year.
Redesigned MacBook Pro with OLED to feature ‘significantly lighter' design
Apple is reportedly redesigning the MacBook Pro to be significantly lighter by adopting Tandem OLED displays and a heavily reworked internal architecture.
Decoder
- Tandem OLED: A display technology stacking two OLED layers to achieve higher brightness and better longevity.
Original article
Apple's upcoming MacBook Pro redesign will reportedly be significantly lighter thanks to miniaturized parts and a rearranged internal architecture, addressing the substantial weight of current models, particularly the 16-inch version. The overhaul is also expected to introduce Tandem OLED displays, touchscreens, and a Dynamic Island, with macOS Golden Gate receiving changes to support the new interactions. The M5 Pro and M5 Max models are expected to launch by November, as Apple reportedly skips higher-end M6 chips to accelerate its transition to M7.
You can't describe your way to great design
Generative AI tools currently fail designers by forcing a rigid generate-and-evaluate loop instead of providing an intuitive, manipulative canvas.
Deep dive
- The describe-generate-evaluate loop creates friction by requiring users to restart from scratch for minor iterations.
- Current tools favor either total constraint or total lack of control, failing the 'Goldilocks' zone of creative professional work.
- A better AI model would maintain layers and editability, allowing designers to tweak parts of a result rather than discarding it.
- Great design relies on continuous manipulation, which prompt-only interfaces effectively prevent.
- The industry needs to transition from 'AI as a fountain' to 'AI as a canvas'.
Original article
Prompt-driven AI tools force creative work into a describe-generate-evaluate loop that poorly supports the instinctive experimentation and continuous manipulation involved in serious design. Current tools tend to offer either editable but constrained output or expressive but largely fixed results, leaving professionals without the combination of creative range and direct control they need. Better AI creative tools should behave more like canvases where people can manipulate generated material fluidly, preserve editability, explore alternatives, and remain actively involved in shaping the work.

The Top 10 Graphic Design Trends for 2027 Are About Process, Not AI
Graphic design in 2027 is moving away from purely aesthetic output toward 'provable craft' to combat the saturation of AI-generated content.
Deep dive
- Proof-of-Process Work: Capturing and presenting the human labor behind a design to build trust.
- Provenance Strip: A metadata-containing band in a layout that lists the author, tools used, and iteration count.
- Range Sheet: A replacement for traditional static logo files that provides a set of valid outputs and forbidden combinations.
- Dial-Ready Design: Optimizing assets for UI systems that allow users to adjust interface transparency, such as Apple's 'Liquid Glass'.
- Base-and-Spike Color: A design strategy using a neutral, warm white base combined with a single saturated accent color.
- Signal Decay: The concept that specific aesthetic cues, like halftone textures or serif headlines, lose their impact and trustworthiness once widely adopted by AI-generated content.
Decoder
- Liquid Glass: An interface design style used by Apple that involves semi-transparent, blur-heavy panels that adapt to background content.
- Variable Font: A font format that allows for custom weights, widths, and slants within a single file, controlled by parameters.
- WCAG: Web Content Accessibility Guidelines, which specify a minimum contrast ratio (4.5:1) for body text to ensure readability.
Original article
Full article content is not available for inline reading.
Nano Banana 2.1
Google has launched Nano Banana 2.1, a new Gemini 3-series model featuring a 1 million token context window for multimodal inputs.
Original article
Nano Banana 2.1 is a member of the Gemini 3 series of models. It can take text and image inputs and output images and text. Based on Gemini 3.6 Flash, the model has a token context window of up to 1 million. Nano Banana 2.1 is available in the Gemini app and API, Google AI Studio, Google Search AI Mode, Google Ads, Google Flow, and Google Stitch.
Decisions API is now available in Public Beta
OpenAI has moved the Decisions API to public beta, offering specialized decision-making outputs that are reportedly 10 times faster than GPT-6 Luna.
Decoder
- Predicate: A statement that evaluates to true or false, used in programming to define conditions or filters.
Original article
OpenAI's Decisions API is now available to all developers in public beta. It makes decisions up to 10 times faster than GPT-6 Luna through the Responses API. The Decisions API accepts text and image inputs and supports three kinds of outputs: predicates, choices, and scores. It costs $0.10 per 1 million input tokens - there are no cache-read, cache-write, or output-token charges.
In Race With US, China Struggles to Recruit Foreign AI Researchers
Despite aggressive state-backed incentives, China is struggling to recruit top-tier international AI researchers to move to the country.
Original article
China has made recruiting the world's best scientists a national priority. It introduced a visa for scientists and is offering lucrative research grants. Foreigners are not coming despite those efforts. The number of Chinese scientists working in the US has risen rather than declined.
Pulumi Google Cloud Provider Version 10.0.0
Pulumi has released version 10.0.0 of its Google Cloud (GCP) provider.
Original article
Pulumi has released version 10 of its Google Cloud provider.

Textile Artist Kathrin Marchenko Reimagines Iconic Monet Painting
Textile artist Kathrin Marchenko translates the impressionist technique of Monet into embroidery through layered, multidimensional stitching.
Original article
Kathrin Marchenko's embroidery Beyond the Bridge reimagines Monet's Bridge over a Pond of Water Lilies in wool and mohair thread on framed tulle, showing how closely brushstrokes and stitches relate.