How Agents Use Systems Differently
Lovable exceeded GitHub's repo creation limits by orders of magnitude while Databricks sees 10-second median compute times as agents force infrastructure redesign.
Summary
Deep Dive
Decoder
Original Article
Portability Is a Myth: Why the Best AI Stacks Will Never Be Hardware-Agnostic
Patrick Toulme argues AI kernel portability is impossible: MoE matmul ships as 282 Pallas lines on TPU versus 4 million CUDA lines on Blackwell.
Summary
Deep Dive
Decoder
Original Article
Tokenomics: the 62.5-minute rule for Claude's cache
Anthropic's cache pricing creates a universal 62.5-minute break-even point: refresh before then or let it expire.
Summary
Deep Dive
Decoder
Original Article
How Claude Code works in large codebases: Best practices and where to start
Anthropic reveals Claude Code's 'harness' (CLAUDE.md, hooks, skills, plugins, MCPs) matters more than the model for enterprise deployments across million-line codebases.
Summary
Deep Dive
Decoder
Original Article
How Claude Code works in large codebases: Best practices and where to start
The most successful Claude Code deployments share a set of recognizable patterns across configurations, tooling, and org structure. This article is part of Claude Code at scale, a new series covering best practices for engineering organizations building with Claude Code at enterprise scale.
Claude Code is running in production across multi-million-line monorepos, decades-old legacy systems, distributed architectures spanning dozens of repositories, and at organizations with thousands of developers. These environments present challenges that smaller, simpler codebases don't, whether that's build commands that differ across every subdirectory or legacy code spread across folders with no shared root.
This article covers the patterns we've observed that have led to successful adoption of Claude Code at scale. We use "large codebase" to refer to a wide range of deployments: monorepos with millions of lines, legacy systems built over decades, dozens of microservices across separate repositories, or any combination of the above. That also includes codebases running on languages that teams don't always associate with AI coding tools, such as C, C++, C#, Java, PHP. (Claude Code performs better than most teams expect it to in those cases, particularly as of recent model releases.) While every large codebase deployment is shaped by its specific version control, team structure, and accumulated conventions, the patterns here generalize across them and are a good starting point for teams considering adopting Claude Code.
How Claude Code navigates large codebases
Claude Code navigates a codebase the way a software engineer would: it traverses the file system, reads files, uses grep to find exactly what it needs, and follows references across the codebase. It operates locally on the developer's machine and doesn't require a codebase index to be built, maintained, or uploaded to a server.
RAG-powered AI coding tools work by embedding the entire codebase and retrieving relevant chunks at query time. At large scale, those systems can fail because embedding pipelines can't keep up with active engineering teams. By the time a developer queries the index, it reflects the codebase as it previously existed weeks, days, or even hours before. Retrieval then returns a function the team renamed two weeks ago, or references a module that was deleted in the last sprint, with no indication that either is out of date.
Agentic search avoids those failure modes. There's no embedding pipeline or centralized index to maintain as thousands of engineers commit new code. Each developer's instance works from the live codebase.
But the approach has a tradeoff: it works best when Claude has enough starting context to know where to look. This means the quality of Claude's navigation is shaped by how well the codebase is set up, layering context with CLAUDE.md files and skills. If you ask it to find all instances of a vague pattern across a billion-line codebase, you'll hit context-window limits before the work begins. Teams that invest in codebase setup see better results.
The harness matters as much as the model
One of the most common misconceptions about Claude Code is that its capabilities are solely defined by the model used. Teams focus on a model's benchmarks and how it performs on test tasks. In practice, the ecosystem built around the model—the harness—determines how Claude Code performs more than the model alone.
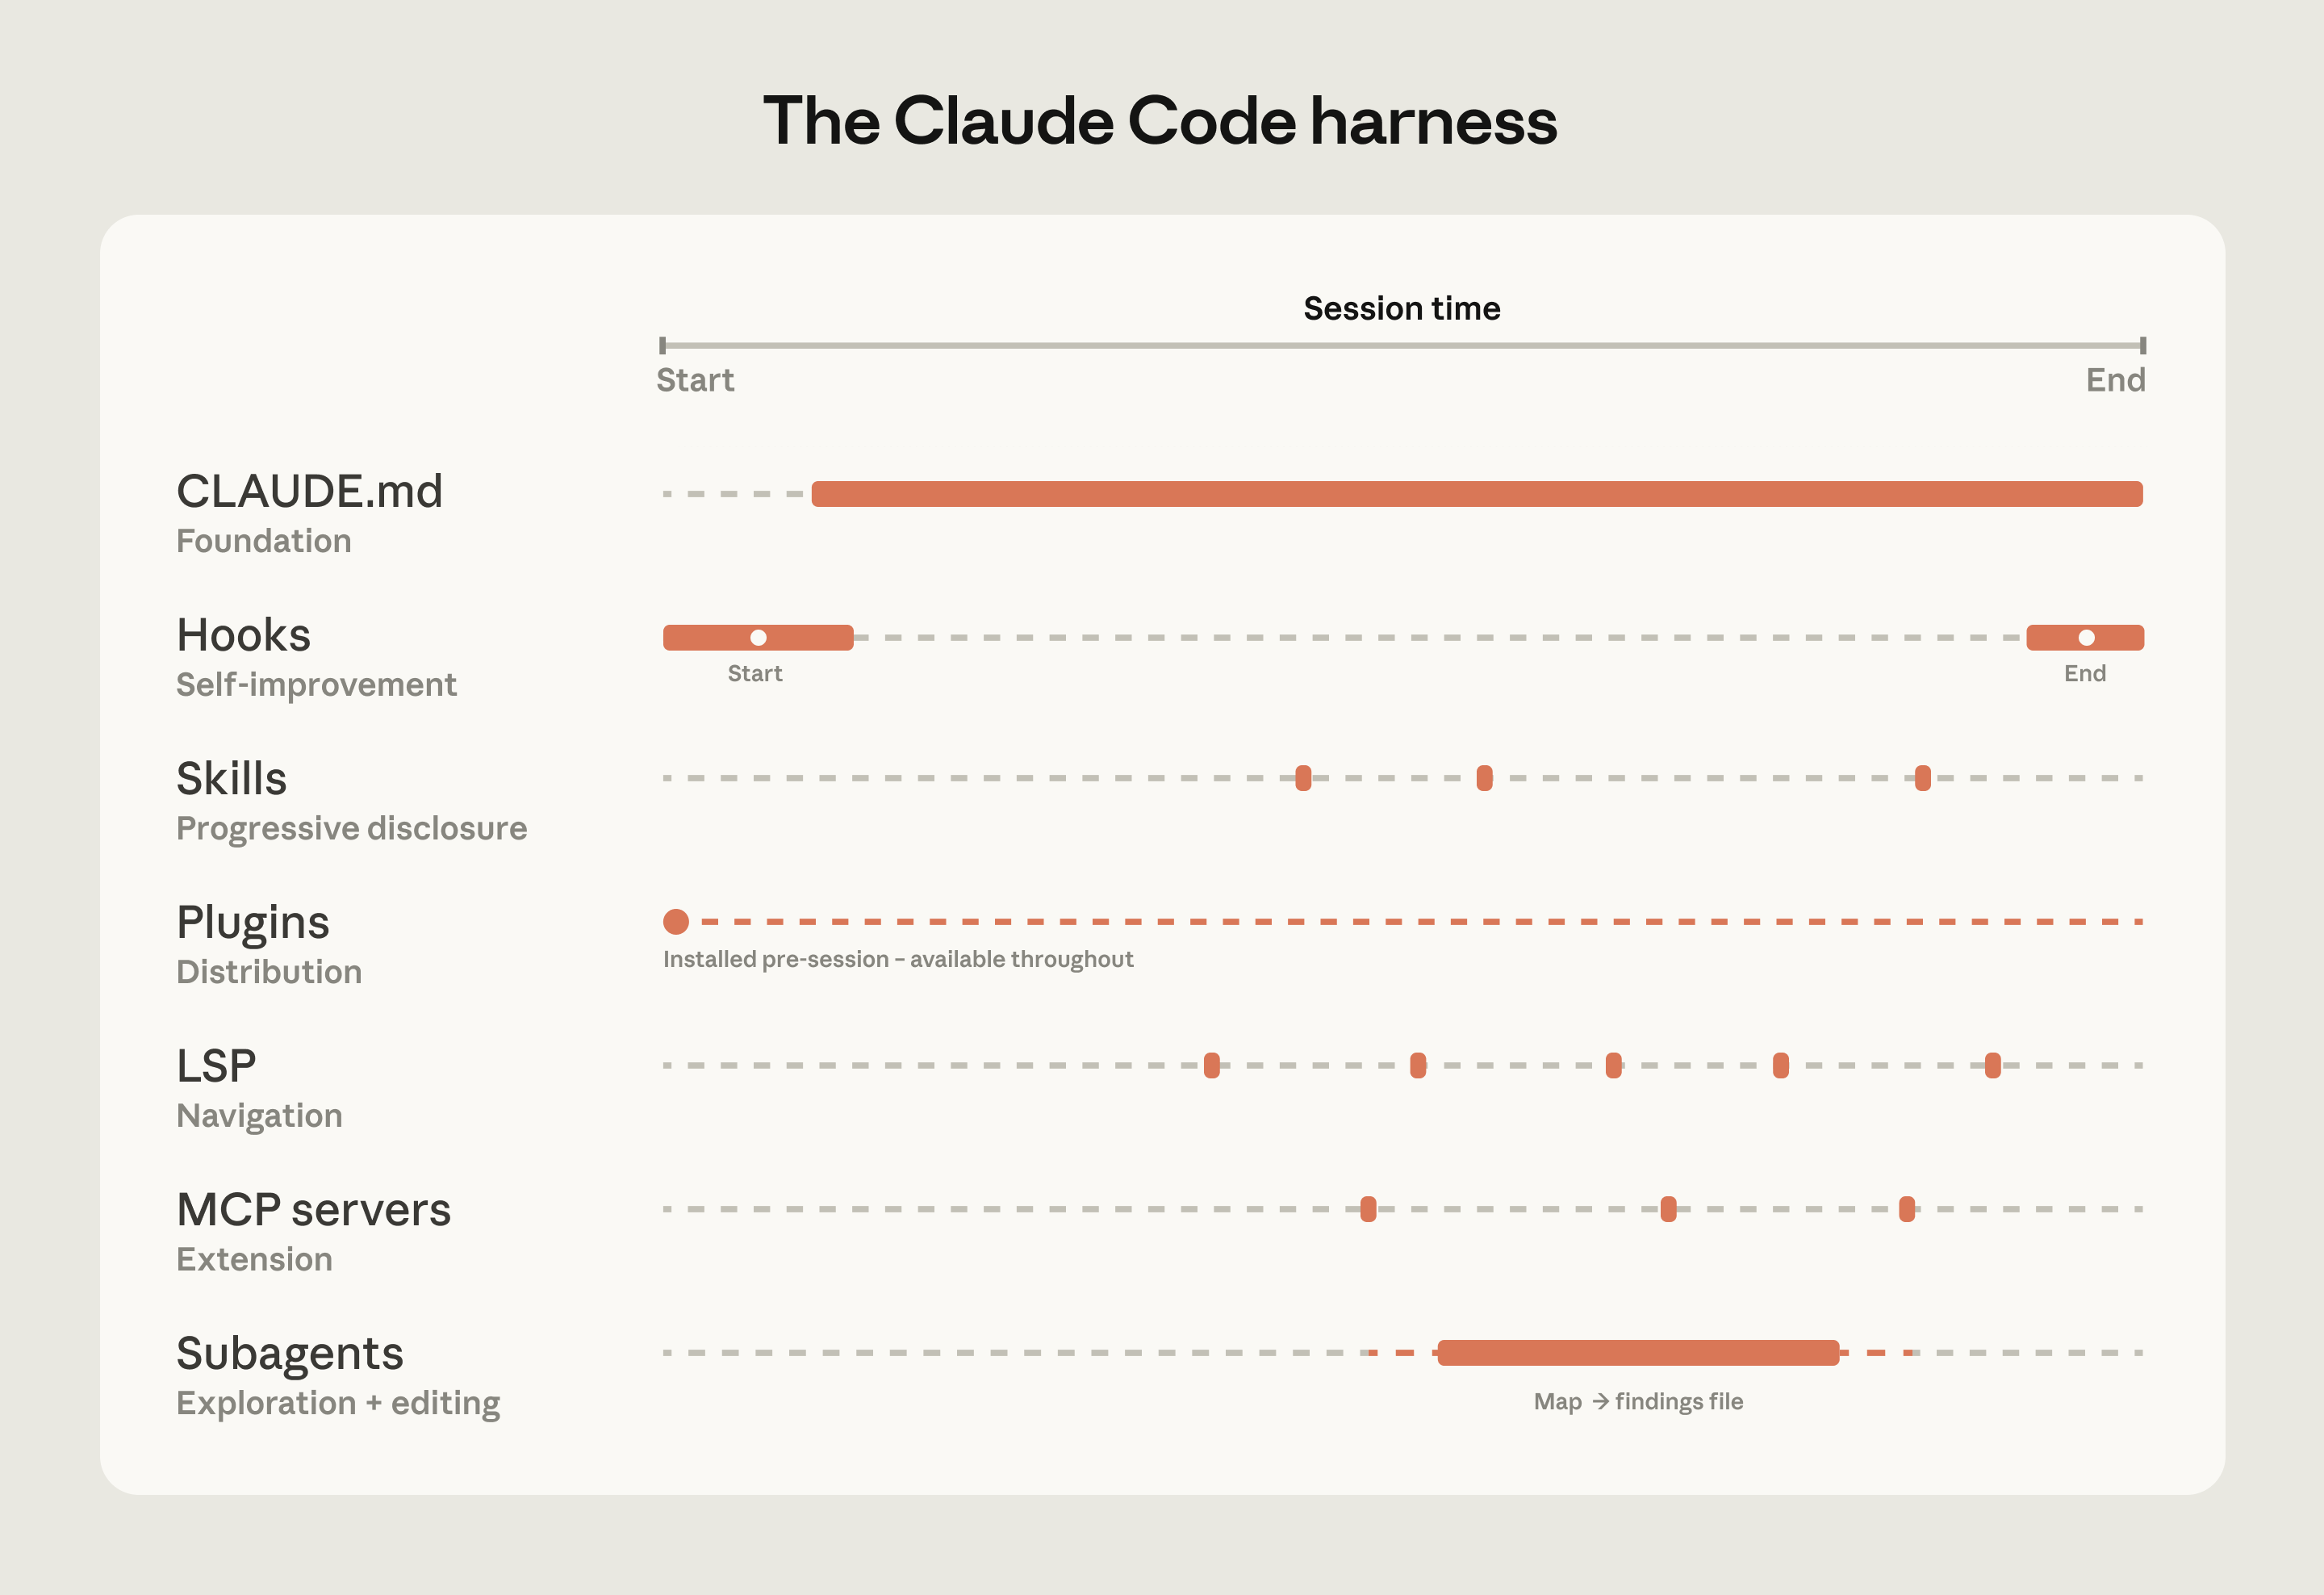
The harness is built from five extension points—CLAUDE.md files, hooks, skills, plugins, and MCP servers—each serving a different function. The order in which teams build them matters, as each layer builds on what came before. Two additional capabilities, LSP integrations and subagents, round out the setup. Below, we explain what each of these components and capabilities do:
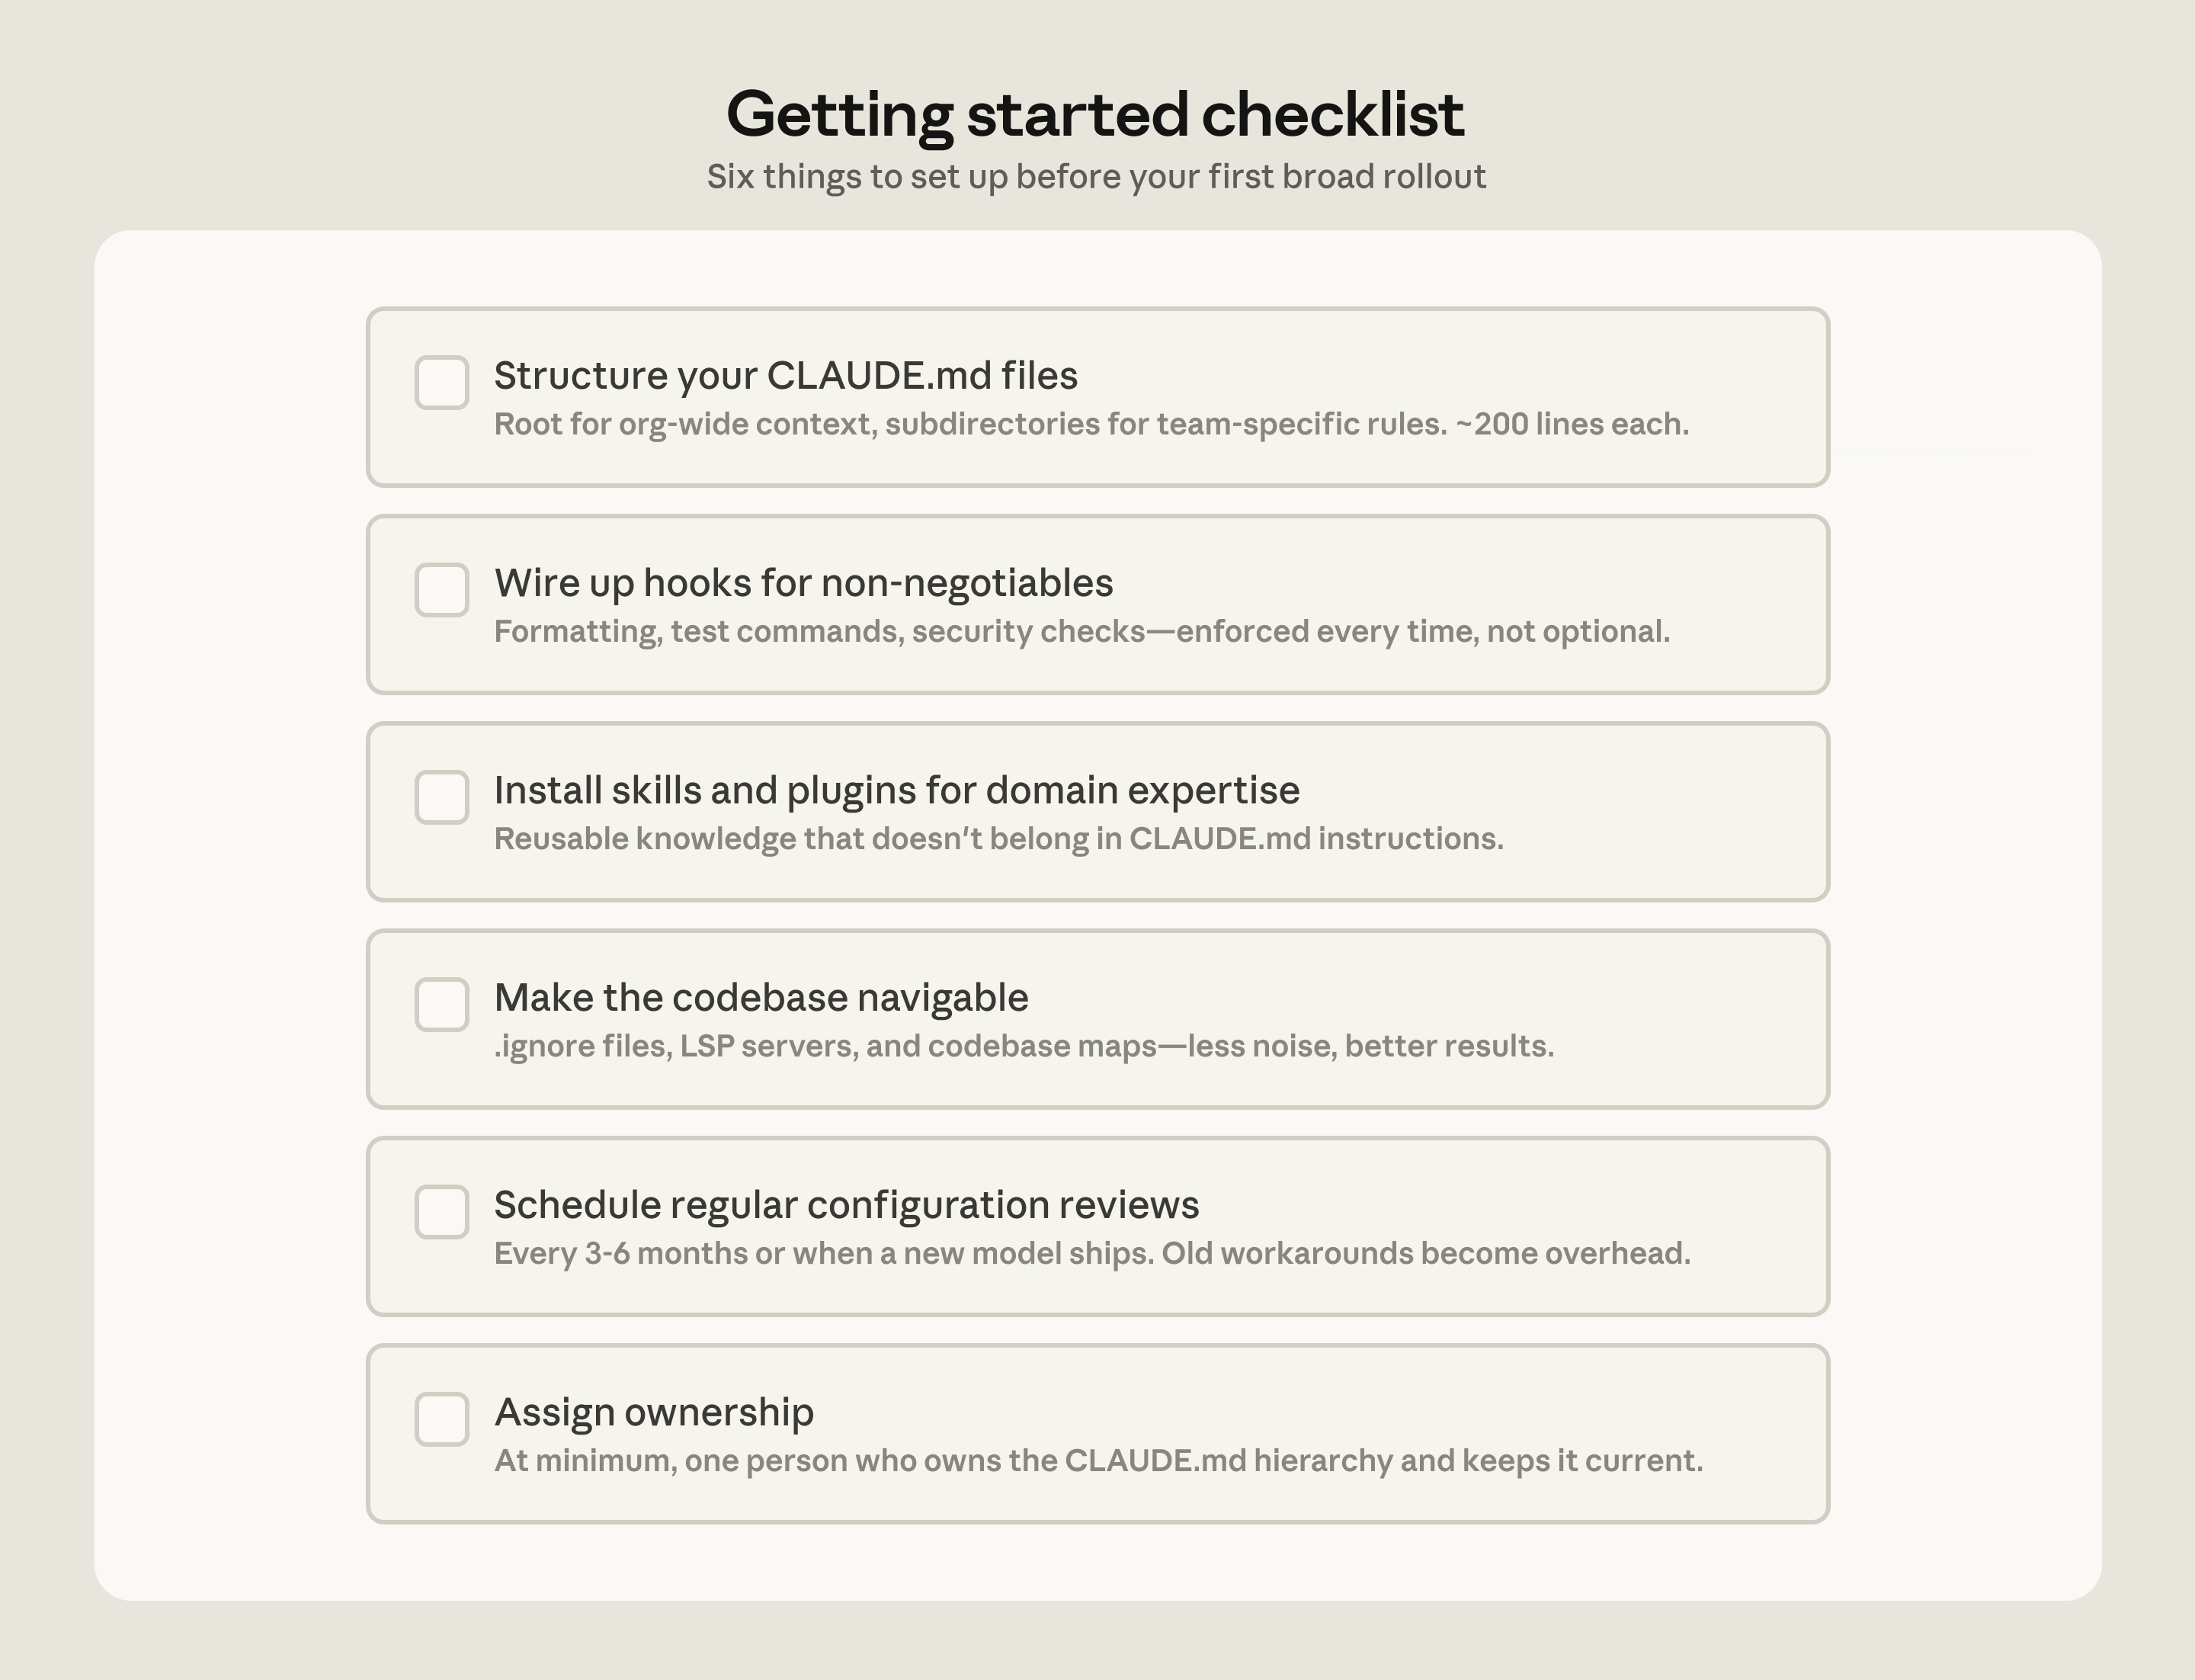
CLAUDE.md files come first. These are context files that Claude reads automatically at the start of every session: root file for the big picture, subdirectory files for local conventions. They give Claude the codebase knowledge it needs to do anything well. Because they load in every session regardless of the task, keeping them focused on what applies broadly will prevent them from becoming a drag on performance.
Hooks make the setup self-improving. Most teams think of hooks as scripts that prevent Claude from doing something wrong, but their more valuable use is continuous improvement. A stop hook can reflect on what happened during a session and propose CLAUDE.md updates while the context is fresh. A start hook can load team-specific context dynamically so every developer gets the right setup for their module without manual configuration. For automated checks like linting and formatting, hooks enforce the rules deterministically and produce more consistent results than relying on Claude to remember an instruction.
Skills keep the right expertise available on-demand without bloating every session. In a large codebase with dozens of task types, not all expertise needs to be present in every session. Skills solve this through progressive disclosure, offloading specialized workflows and domain knowledge that would otherwise compete for context space and loading them only when the task calls for it. For example, a security review skill loads when Claude is assessing code for vulnerabilities, while a document processing skill loads when a code change is made and documentation needs to be updated.
Skills can also be scoped to specific paths so they only activate in the relevant part of the codebase. A team that owns a payments service can bind their deployment skill to that directory, so it never auto-loads when someone is working elsewhere in the monorepo.
Plugins distribute what works. One challenge with large codebases is that good setups can stay tribal. A plugin bundles skills, hooks, and MCP configurations into a single installable package, so when a new engineer installs that plugin on day one, they will immediately have the same context and capabilities as those who have been using Claude already. Plugin updates can be distributed across the organization through managed marketplaces.
For example, a large retail organization we work with built a skill connecting Claude to their internal analytics platform so that business analysts could pull performance data without leaving their workflow. They distributed it as a plugin before the broad rollout to the business.
Language server protocol (LSP) integrations give Claude the same navigation a developer has in their IDE. Most large-codebase IDEs already have an LSP running, powering "go to definition" and "find all references." Surfacing this to Claude gives it symbol-level precision: it can follow a function call to its definition, trace references across files, and distinguish between identically named functions in different languages. Without it, Claude pattern-matches on text and can land on the wrong symbol. One enterprise software company we worked with deployed LSP integrations org-wide before their Claude Code rollout, specifically to make C and C++ navigation reliable at scale. For multi-language codebases, this is one of the highest-value investments.
MCP servers extend everything. MCP servers are how Claude connects to internal tools, data sources, and APIs that it can't otherwise reach. The most sophisticated teams built MCP servers exposing structured search as a tool Claude can call directly. Others connect Claude to internal documentation, ticketing systems, or analytics platforms.
Subagents split exploration from editing. A subagent is an isolated Claude instance with its own context window that takes a task, does the work, and returns only the final result to the parent. Once the harness is in place, some teams spin up a read-only subagent to map a subsystem and write findings to a file, then have the main agent edit with the full picture.
The table below summarizes what each component does, when it loads, and the most common mistakes we see with each:
| Component | What it is | When it loads | Best for | Common confusion |
|---|---|---|---|---|
| CLAUDE.md | Context file Claude reads automatically | Every session | Project-specific conventions, codebase knowledge | Using it for reusable expertise that belongs in a skill |
| Hooks | Scripts that run at key moments | Triggered by events | Automating consistent behavior, capturing session learnings | Using prompts for things that should run automatically |
| Skills | Packaged instructions for specific task types | On demand, when relevant | Reusable expertise across sessions and projects | Loading everything into CLAUDE.md instead |
| Plugins | Bundled skills, hooks, MCP configs | Always available once configured | Distributing a working setup across the org | Letting good setups stay tribal |
| Language server protocol (LSP)* | Real-time code intelligence via language specific servers | Always available once configured | Symbol-level navigation and automatic error detection in typed languages | Assuming that it's automatic |
| MCP servers | Connections to external tools and data | Always available once configured | Giving Claude access to internal tools it can't otherwise reach | Building MCP connections before the basics are working |
| Subagents* | Separate Claude instances for specific tasks | When invoked | Splitting exploration from editing, parallel work | Running exploration and editing in the same session |
| *LSP is accessed through the plugin layer. Subagents are a delegation capability rather than a configured extension point. |
Three configuration patterns from successful deployments
How you configure Claude Code for a large codebase depends heavily on how that codebase is structured. Still, three patterns appeared consistently across the deployments we observed.
Making the codebase navigable at scale
Claude's ability to help in a large codebase is bounded by its ability to find the right context. Too much context loaded into every session degrades performance, while too little context leaves Claude to navigate blind. The most effective deployments invest upfront in making the codebase legible to Claude. A few patterns appear consistently:
- Keeping CLAUDE.md files lean and layered. Claude loads them additively as it moves through the codebase: root file for the big picture, subdirectory files for local conventions. The root file should be pointers and critical gotchas only; everything else drifts into noise.
- Initializing in subdirectories, not at the repo root. Claude works best when it's scoped to the part of the codebase that's actually relevant to the task. In monorepos, this can feel counterintuitive because tooling often assumes root access, but Claude automatically walks up the directory tree and loads every CLAUDE.md file it finds along the way, so root-level context is never lost.
- Scoping test and lint commands per subdirectory. Running the full suite when Claude changed one service causes timeouts and wastes context on irrelevant output. CLAUDE.md files at the subdirectory level should specify the commands that apply to that part of the codebase. This works well for service-oriented codebases where each directory has its own test and build commands. In compiled-language monorepos with deep cross-directory dependencies, per-subdirectory scoping is harder to achieve and may require project-specific build configurations.
- Using
.ignorefiles to exclude generated files, build artifacts, and third-party code. Committingpermissions.denyrules in.claude/settings.jsonmeans the exclusions are version-controlled, so every developer on the team gets the same noise reduction without configuring it themselves. In some codebases, generated files are themselves the subject of development work. Developers who work on code generators can override project-level exclusions in their local settings without affecting the rest of the team. - Building codebase maps when the directory structure doesn't do the work. For organizations where code isn't consolidated in a conventional directory structure, a lightweight markdown file at the repo root listing each top-level folder with a one-line description of what lives there gives Claude a table of contents it can scan before opening files. For codebases with hundreds of top-level folders, this works best as a layered approach: the root file describes only the highest-level structure, and subdirectory CLAUDE.md files provide the next level of detail, loading on demand as Claude moves through the tree. For simpler cases, @-mentioning the specific files or directories Claude should reference can do the same job.
- Running LSP servers so Claude searches by symbol, not by string. Grep for a common function name in a large codebase returns thousands of matches and Claude burns context opening files to figure out which matters. LSP returns only the references that point to the same symbol, so the filtering happens before Claude reads anything. Setting this up requires installing a code intelligence plugin for your language and the corresponding language server binary; the Claude Code documentation covers the available plugins and troubleshooting.
One caveat: there are edge cases where even the hierarchical CLAUDE.md approach breaks down, for example codebases with hundreds of thousands of folders and millions of files, or legacy systems on non-git version control. We will address their challenges in future installments of this series.
Actively maintaining CLAUDE.md files as model intelligence evolves
As models evolve, instructions written for your current model can work against a future one. CLAUDE.md files that guided Claude through patterns it used to struggle with may either become unnecessary or actively constraining when the next model ships. For example, a CLAUDE.md rule that tells Claude to break every refactor into single-file changes may have helped an earlier model stay on track but would prevent a newer one from making coordinated cross-file edits it handles well.
Skills and hooks built to compensate for specific model limitations, whether in the model's reasoning or in Claude Code's own tooling, become overhead once those limitations no longer exist. A hook that intercepted file writes to enforce p4 edit in a Perforce codebase, for example, became redundant once Claude Code added native Perforce mode.
Teams should expect to do a meaningful configuration review every three to six months, but it's also worth doing one whenever performance feels like it's plateaued after major model releases.
Assigning ownership for Claude Code management and adoption
Technical configuration alone doesn't drive adoption. The organizations that got it right invested in the organizational layer, too.
The rollouts that spread fastest had a dedicated infrastructure investment before broad access. A small team, sometimes even just one person, wired up the tooling so Claude already fit developer workflows when they first touched it. At one company, a couple of engineers built a suite of plugins and MCPs that were available on day one. At another, an entire team focused on managing AI coding tools had the infrastructure in place before the rollout began. In both cases, developers' first experience was productive rather than frustrating, and adoption spread from there.

The teams doing this work today tend to sit under developer experience or developer productivity, which is typically the function responsible for onboarding new engineers and building developer tooling. An emerging role in several organizations is an agent manager: a hybrid PM/engineer function dedicated to managing the Claude Code ecosystem. For organizations without a dedicated team, the minimum viable version is a DRI: one person with ownership over the Claude Code configuration, the authority to make calls on settings, permissions policy, the plugin marketplace, and CLAUDE.md conventions, and the responsibility to keep them current.
Bottoms-up adoption generates enthusiasm but can fragment without someone to centralize what works. You need to have an individual or a team assemble and evangelize the right Claude Code conventions (such as a standardized CLAUDE.md hierarchy or a curated set of skills and plugins). Without that work, knowledge will stay tribal and adoption will plateau.
In large organizations, especially those in regulated industries, governance questions come up early, such as: who controls which skills and plugins are available, how do you prevent thousands of engineers from independently rebuilding the same thing, how do you make sure AI-generated code goes through the same review process as human-generated code? To address these early on, we suggest starting with a defined set of approved skills, required code review processes, and limited initial access, and expand as confidence builds.
We've observed the smoothest deployments at organizations that establish cross-functional working groups early by bringing together engineering, information security, and governance representatives to define requirements together and build a rollout roadmap.
Applying these patterns to your organization
Claude Code is designed around conventional software engineering environments where engineers are the primary codebase contributors, the repo uses Git, and code follows standard directory structures. Most large codebases fit this mold, but non-traditional setups such as game engines with large binary assets, environments with unconventional version control, or non-engineers contributing to the codebase require additional configuration work. Our guidance assumes a conventional setup and the patterns we've described have worked across many of our customers. Any remaining complexity requires judgment specific to your codebase, tooling, and organization. That's where Anthropic's Applied AI team works directly with engineering teams to translate these patterns into your organization's specific requirements.
Get started with Claude Code for Enterprise.
Acknowledgements: Special thanks to Alon Krifcher, Charmaine Lee, Chris Concannon, Harsh Patel, Henrique Savelli, Jason Schwartz, Jonah Dueck and Kirby Kohlmorgen from Anthropic's Applied AI team for sharing their experience deploying Claude Code at scale, and to Amit Navindgi at Zoox for providing feedback on this article.
Recent Developments in LLM Architectures: KV Sharing, mHC, and Compressed Attention
Transformers aren't being replaced but made 10x more complex, as DeepSeek V4 and peers add KV compression to slash long-context memory costs.
Summary
Deep Dive
Decoder
Original Article
Lighthouse Attention
Nous Research's Lighthouse Attention delivers 17x faster training at 512K context using symmetric pooling and vanilla FlashAttention, no sparse kernels.
Summary
Deep Dive
Decoder
Original Article
Notes on pretraining parallelisms and failed training runs
An FP16 floating-point precision bug initially broke GPT-4 training by causing gradient accumulation errors above 1024, and expert routing causality issues rumored to have hurt Llama 4 quality.
Summary
Deep Dive
Decoder
Original Article
Headroom (GitHub Repo)
Headroom compresses AI agent context by 60-95% with zero code changes, reversible local storage, and 60B+ tokens saved across the community.
Summary
Deep Dive
Decoder
Original Article
Apple Silicon costs more than OpenRouter
Running LLMs locally on a $4,299 M5 Max MacBook Pro costs about 3x more per million tokens than OpenRouter cloud APIs and runs 2-7x slower.
Summary
Deep Dive
Decoder
Original Article
DeepSeek-V4-Flash means LLM steering is interesting again
DeepSeek-V4-Flash is the first local model competitive with frontier models to make steering—direct manipulation of neural activations mid-inference—worth trying.
Summary
Deep Dive
Decoder
Original Article
Zero (GitHub Repo)
Vercel Labs released Zero, an experimental systems programming language designed for AI agents as primary users rather than humans.
Summary
Deep Dive
Decoder
Original Article
How I use LLMs as a staff engineer in 2026
Sean Goedecke went from occasional AI use to starting every code change with agents and having them diagnose 80% of bugs in just 15 months.
Summary
Deep Dive
Decoder
Original Article
The Sigmoids Won't Save You
Forecasters wrongly predicted plateaus in birthrates, solar power, and AI capabilities by assuming exponentials flatten just when they start analyzing.
Summary
Deep Dive
Decoder
Original Article
Native all the way, until you need text
After 20 years building native macOS apps, a developer found Electron delivered better Markdown chat performance than SwiftUI, AppKit, and TextKit 2 combined.
Summary
Original Article
Git Is Not Fine
Git's immutable history model breaks down with stacked PRs and async workflows, driving Meta to use superior in-house version control instead.
Summary
Deep Dive
Decoder
Original Article
I strongly believe there are entire companies right now under heavy AI psychosis
Mitchell Hashimoto warns of 'AI psychosis' at companies where teams justify shipping bugs because agents will fix them instantly.
Summary
Deep Dive
Decoder
Original Article
Agent Hooks: Deterministic Control for Agent Workflows
Nader Dabit's agent hooks pattern enforces rules like test gates and protected paths deterministically across Claude Code, Devin, Cursor, and Codex workflows.
Summary
Deep Dive
Decoder
Original Article
Gradual deployments in Amazon ECS with linear and canary strategies
Amazon ECS added canary and linear deployments with automated CloudWatch-triggered rollbacks, shifting container traffic in 10% increments or testing 5% slices before committing.
Summary
Deep Dive
Decoder
Original Article
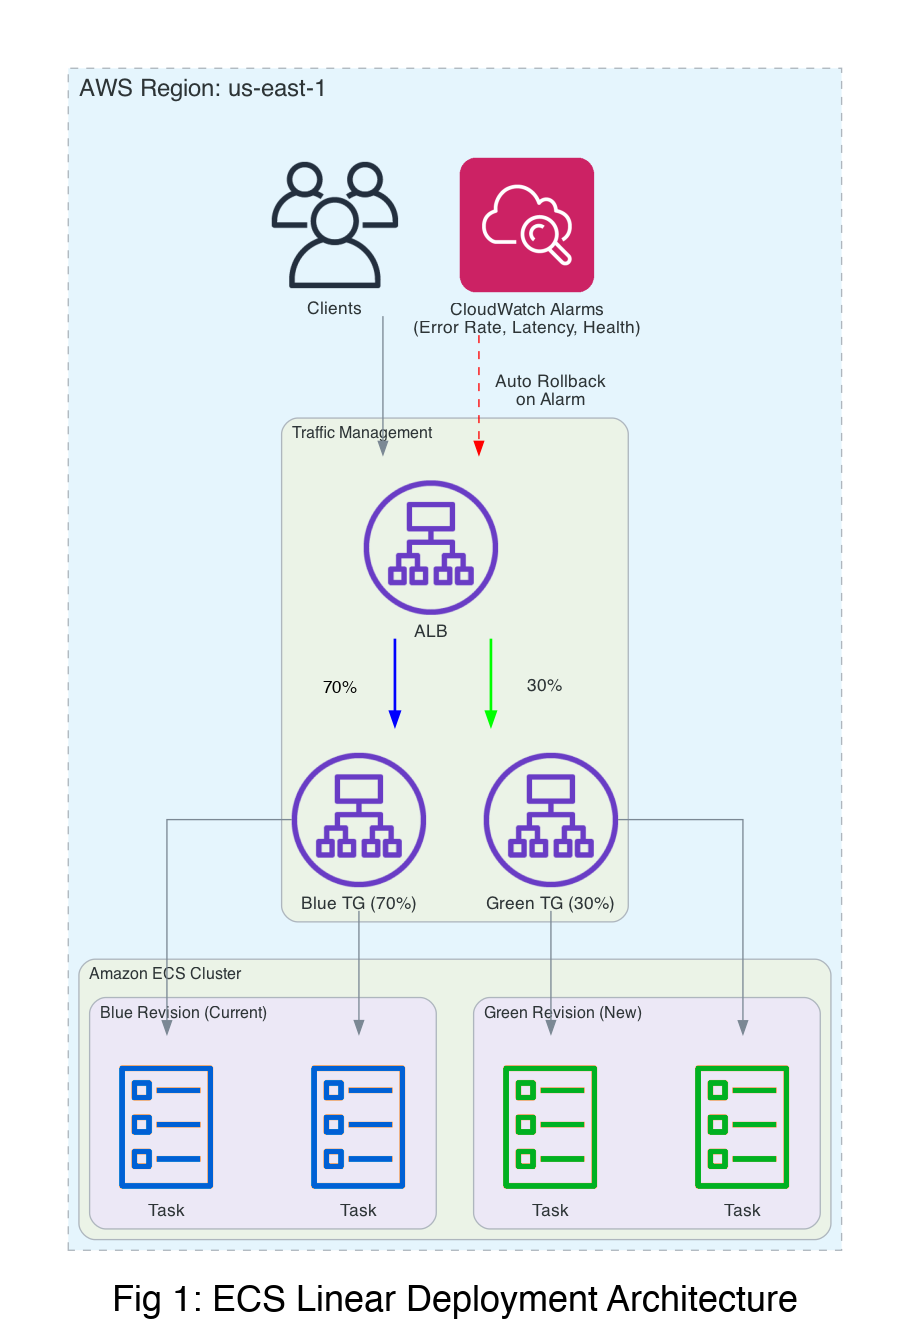
Gradual deployments in Amazon ECS with linear and canary strategies
When deploying new application versions, you need confidence changes won't impact customers. Amazon Elastic Container Service (Amazon ECS) now supports linear and canary deployment strategies, complementing built-in blue/green deployments. With linear deployments, you shift traffic in equal increments with a bake time between each shift. With canary deployments, you route a small percentage to the new revision and monitor before shifting the rest. Both strategies support Amazon CloudWatch alarms for failure detection and rollback, and lifecycle hooks for custom validation.
In this post, we walk through how linear and canary strategies work in Amazon ECS, how to configure each, and how to set up automatic rollbacks with CloudWatch alarms.
How Amazon ECS orchestrates gradual deployments
When you configure linear or canary deployments, Amazon ECS uses Elastic Load Balancing weighted target groups and CloudWatch alarms for traffic shifting and automated rollback.
Architecture and traffic flow
Amazon ECS supports four deployment strategies, each with a different approach to traffic management. Your choice depends on your risk tolerance and required control over the rollout.
Rolling: task-by-task replacement
Rolling deployments replace tasks progressively without traffic shifting. Amazon ECS starts new tasks before stopping old ones to maintain availability (controlled by the minimumHealthyPercent and maximumPercent parameters). This is the default deployment type.
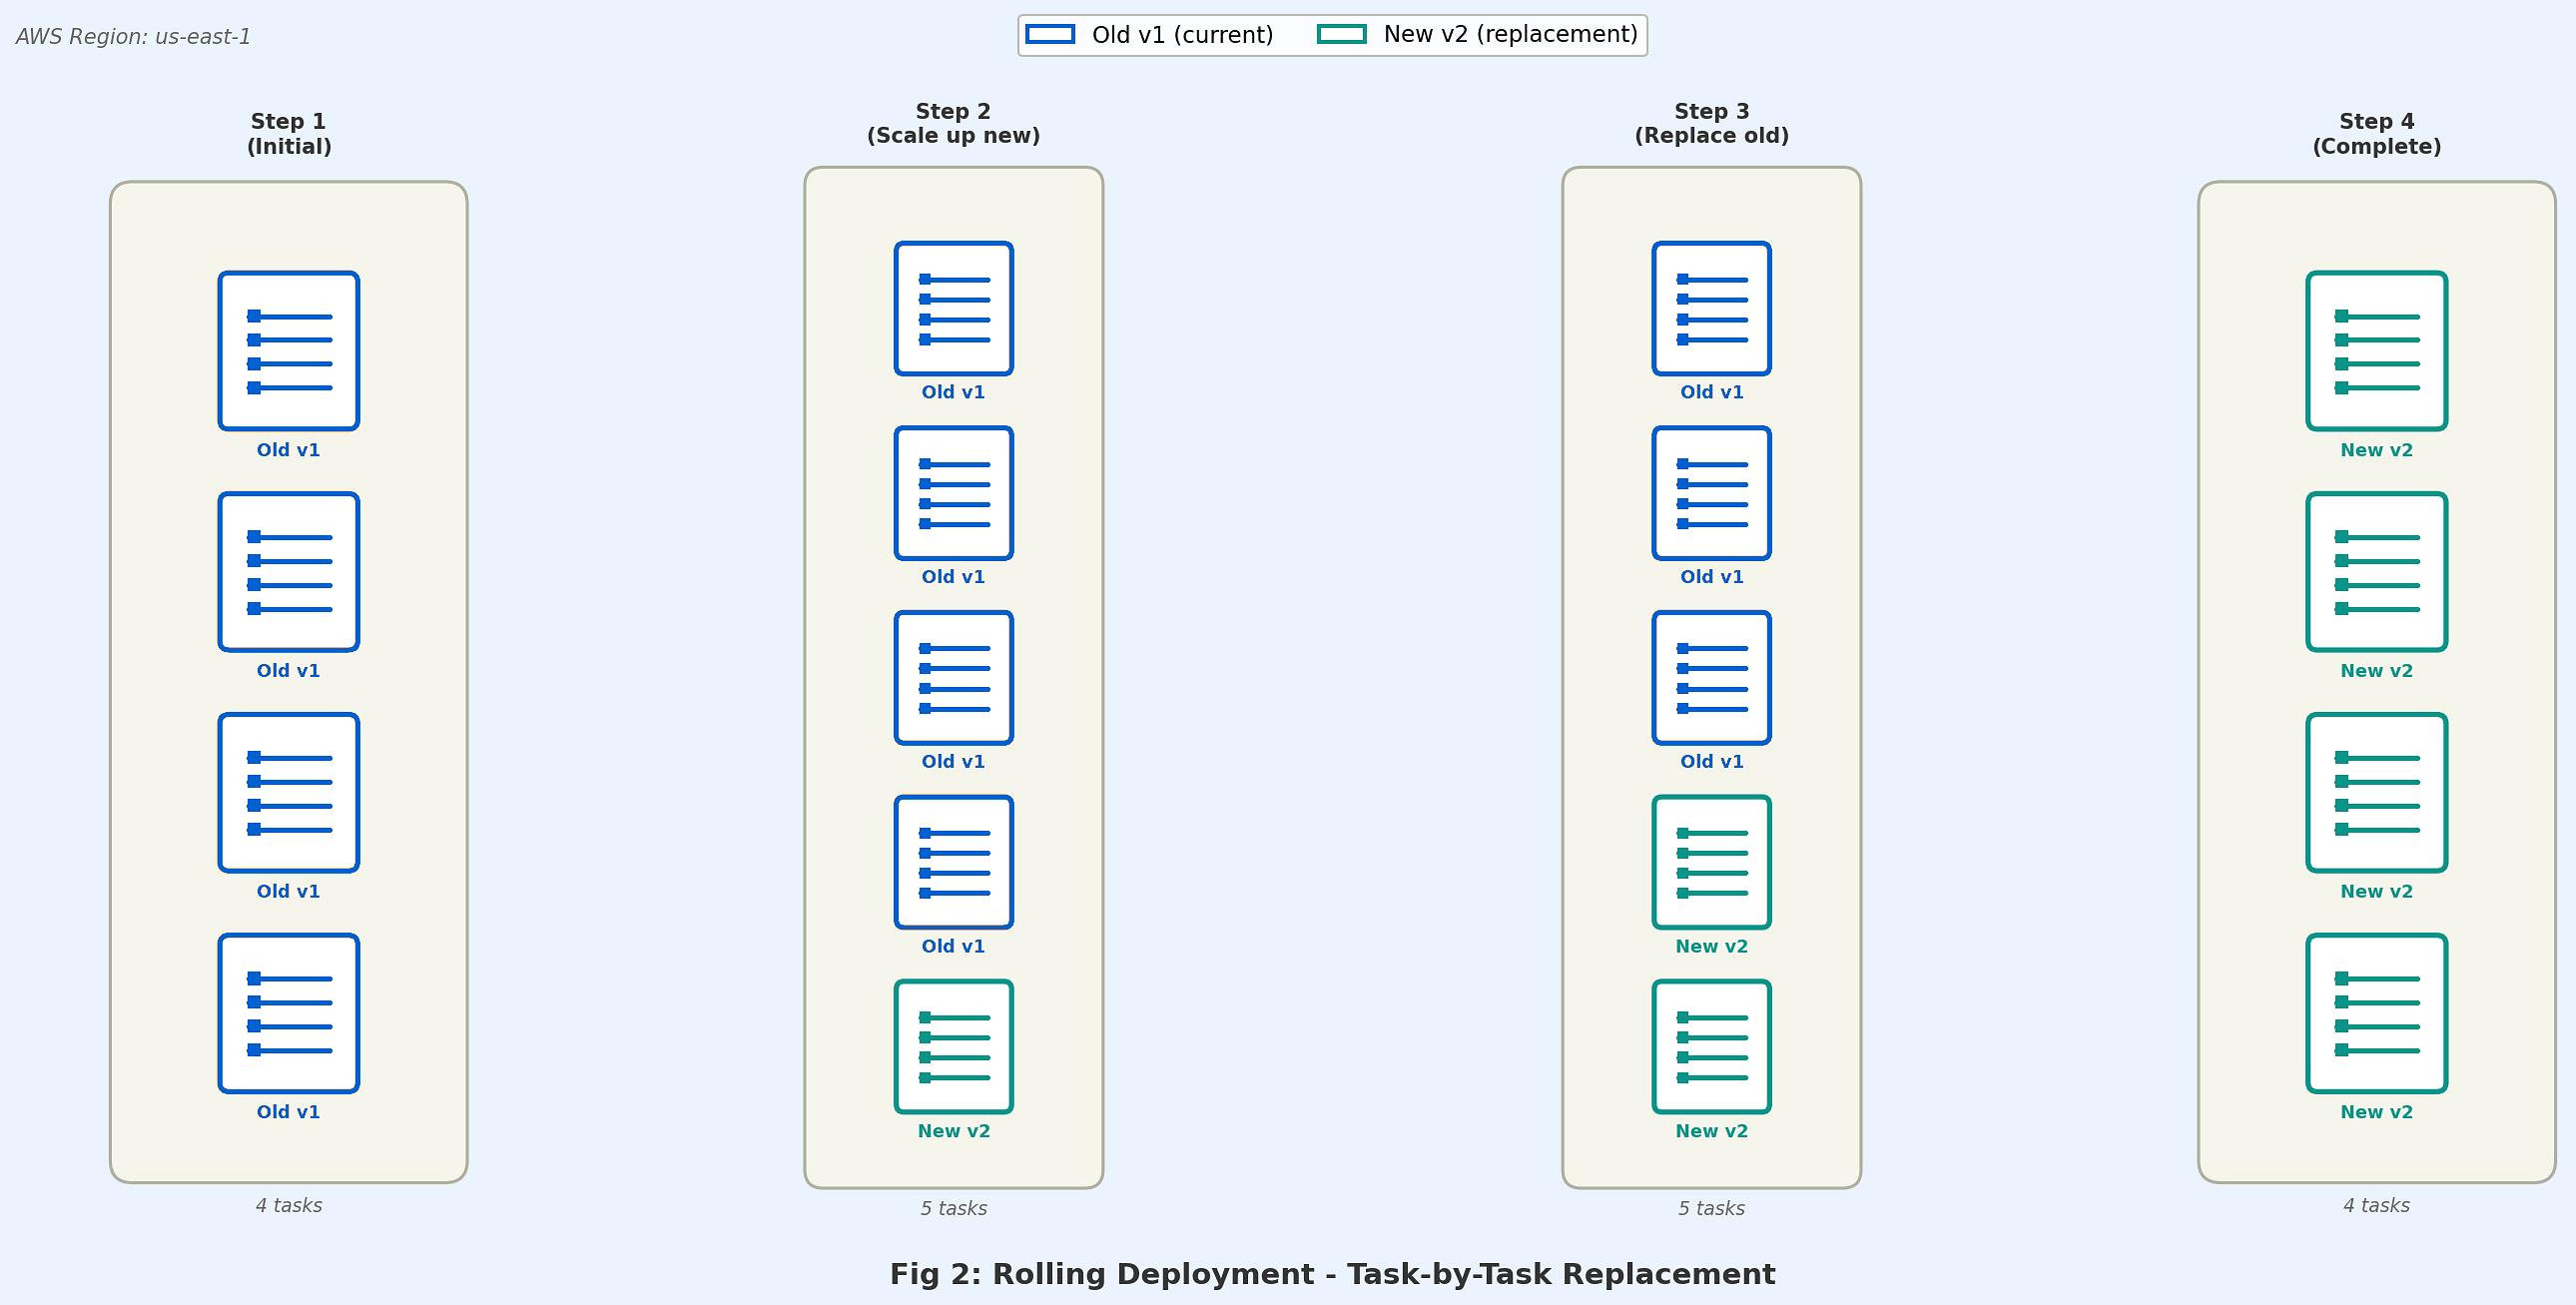
Consider rolling deployments for cost-sensitive deployments where you want to avoid duplicate infrastructure, and workloads where simplicity is preferred over fine-grained traffic control.
Blue/green: full traffic switch
Blue/green deployments create a complete replacement environment (green) alongside the existing one (blue). After validation using a test listener, traffic switches instantly from blue to green. The blue environment remains available for rollback.
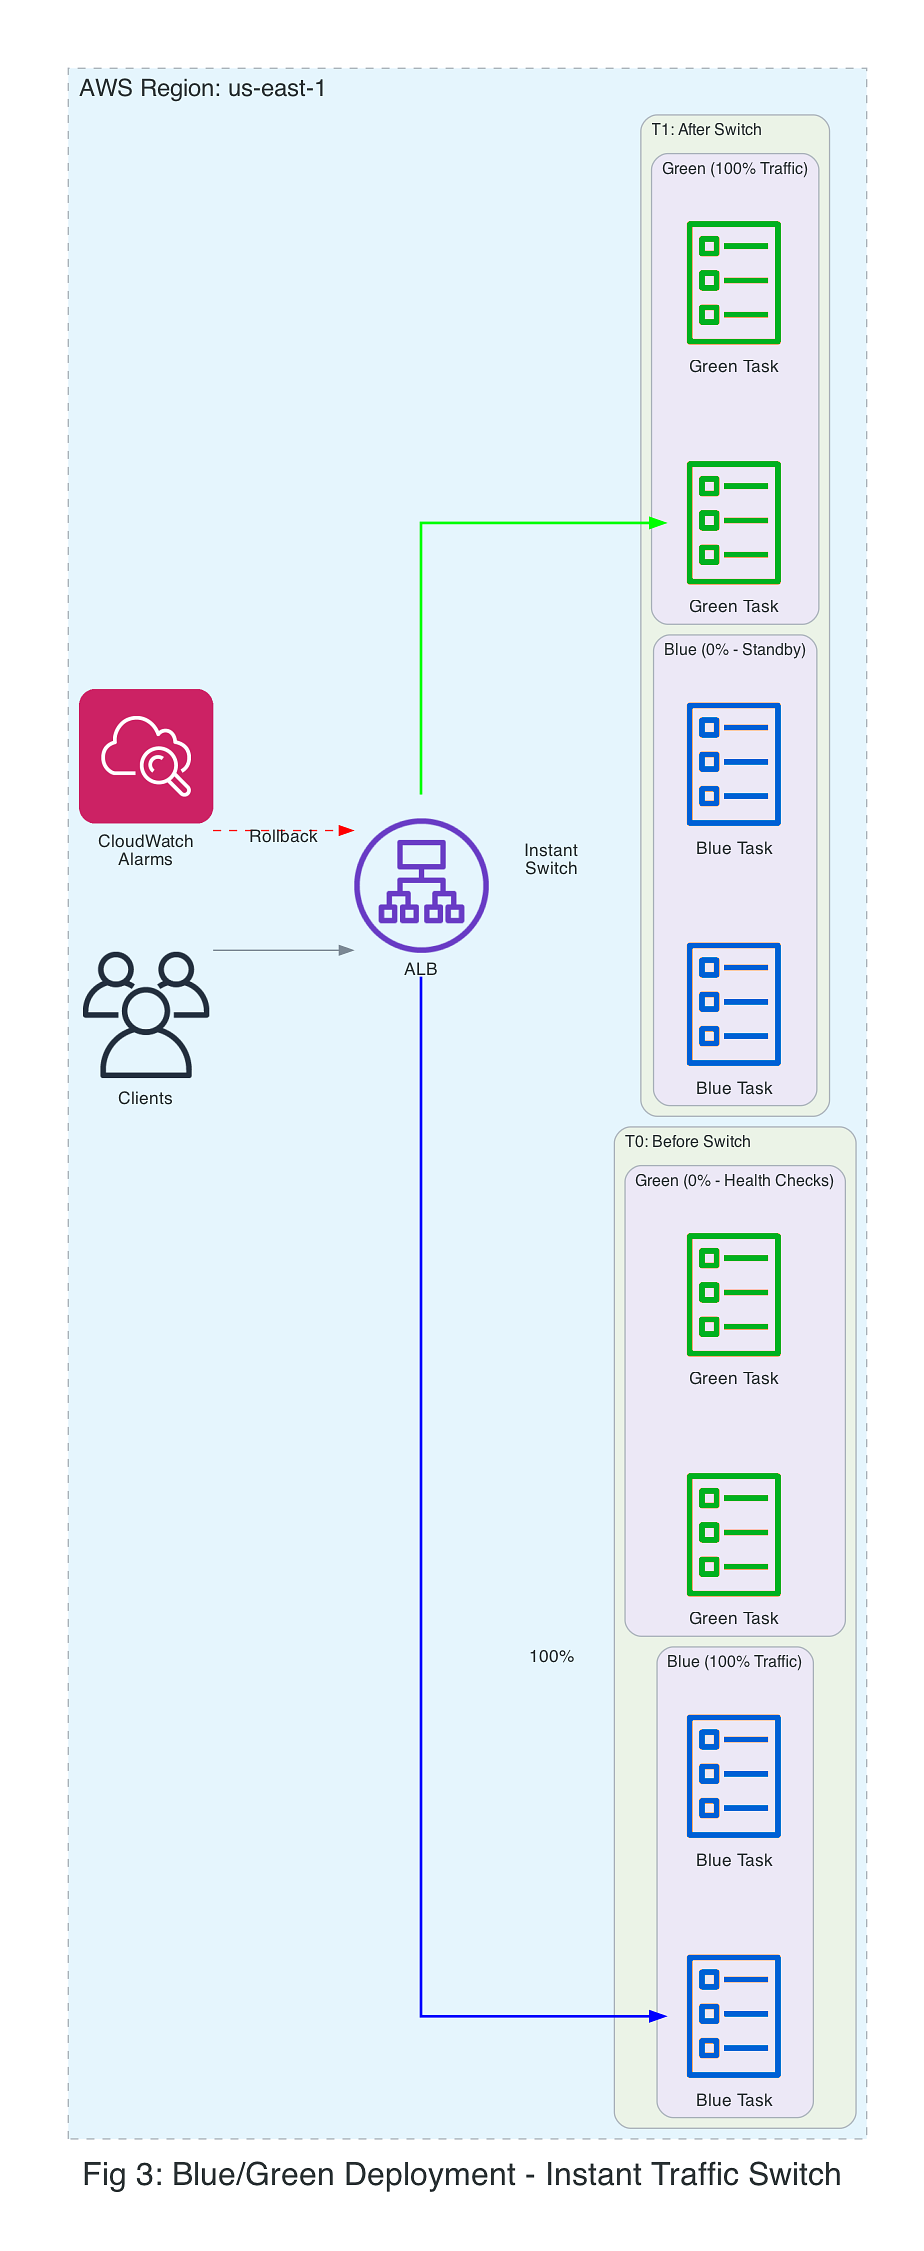
Blue/green deployments work well for database schema changes requiring synchronized cutover, major version upgrades where instant rollback is critical, and services where gradual rollout provides no additional validation benefit.
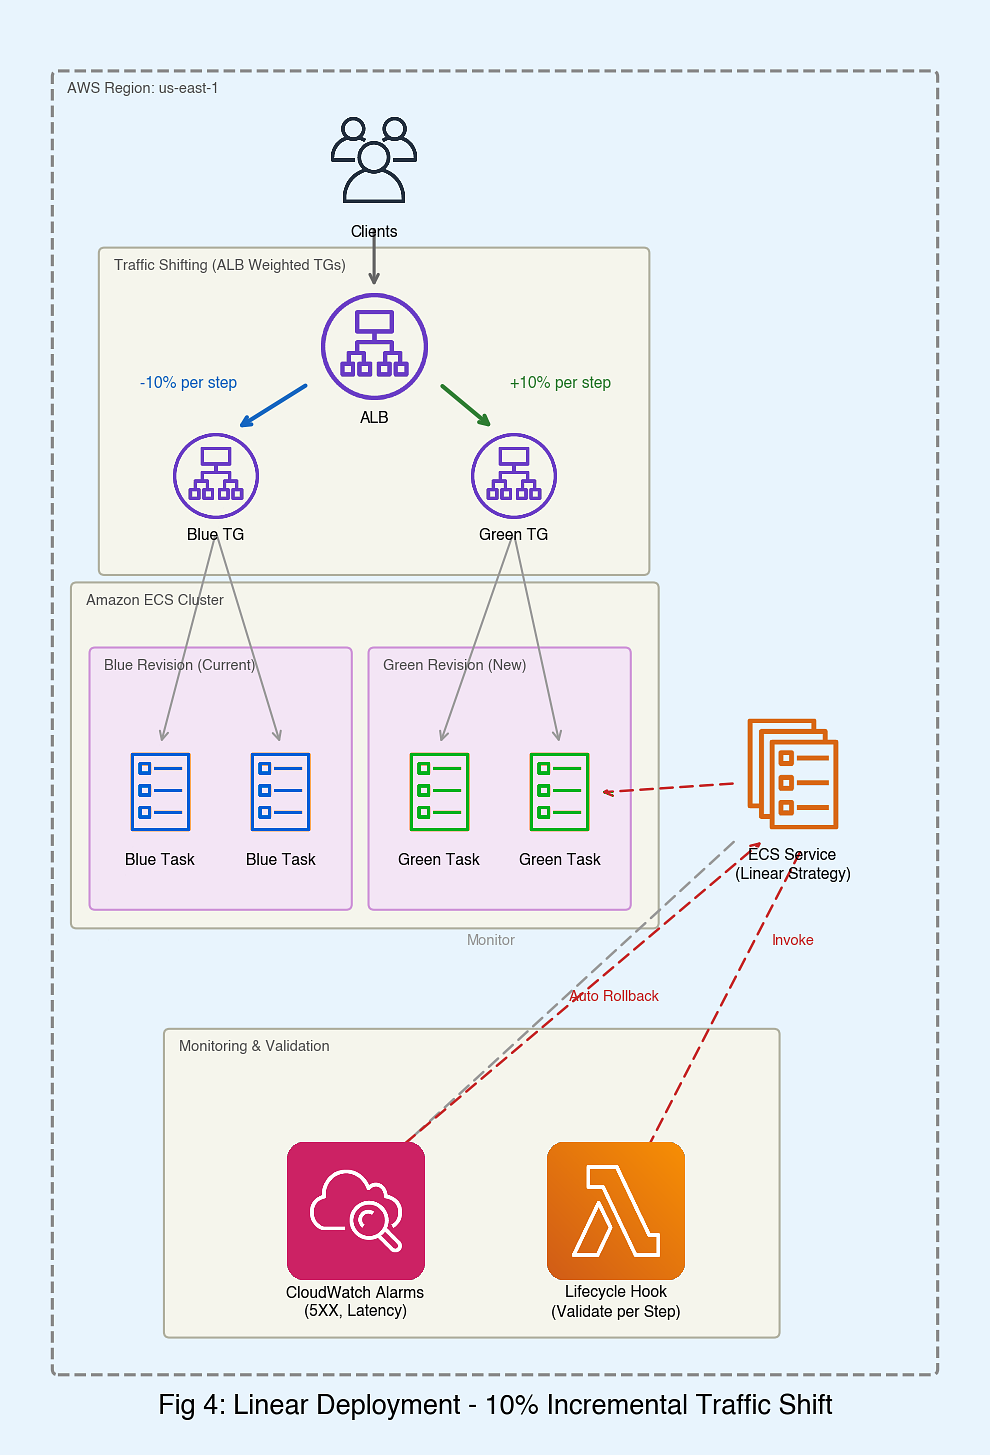
Linear: gradual shift in equal increments
Linear deployments shift traffic in equal increments, with a configurable bake time at each stage. If CloudWatch alarms breach or health checks fail, the deployment automatically rolls back.
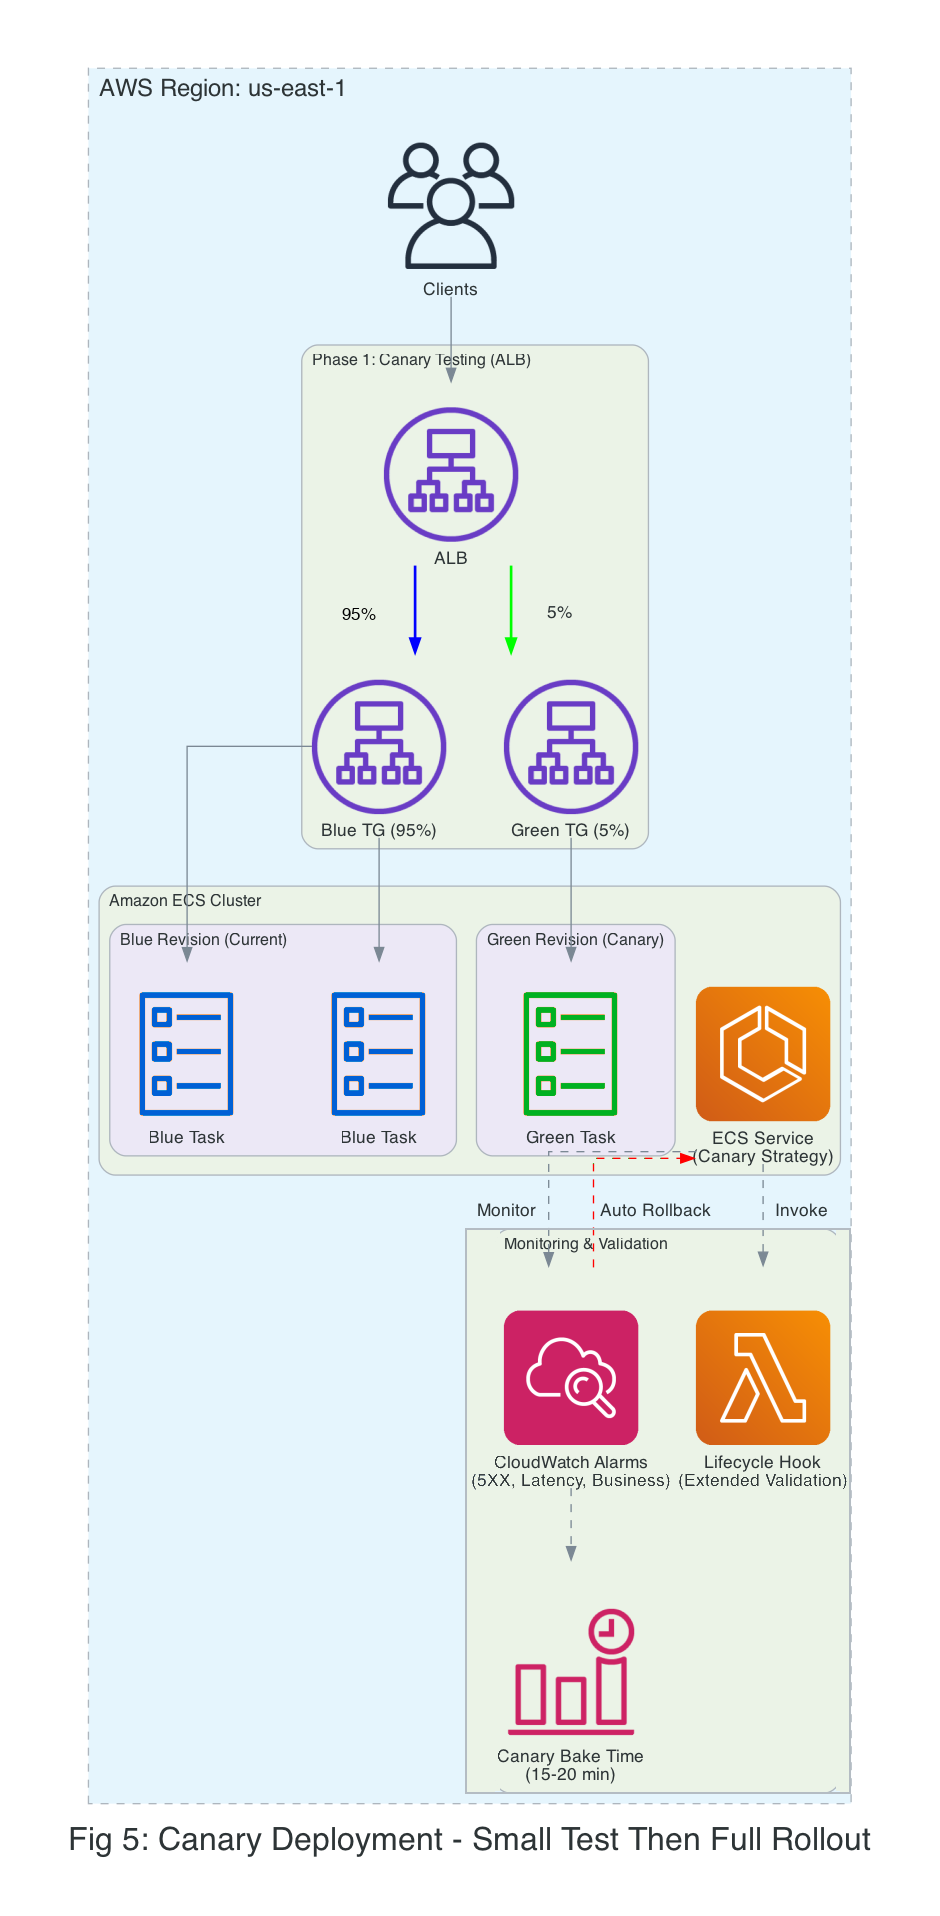
Canary: small traffic slice first
Canary deployments route a small percentage of traffic to the new version for an extended observation period. If validation succeeds, the remaining traffic shifts in a single step.
Choosing your rollout strategy
The following table compares all four Amazon ECS deployment strategies to help you decide which approach fits your workload.
| Strategy | Traffic Control | Rollback Speed | Cost Impact | Best For |
| Rolling | No control | Slow (redeploy) | Low | Cost-sensitive workloads, simplicity over traffic control |
| Blue/green | Instant switch | Instant | High (2x resources) | Critical updates, DB migrations |
| Linear | Gradual increments | Fast (traffic shift) | Medium | APIs, microservices |
| Canary | Small test first | Fast (traffic shift) | Medium | Changes requiring careful validation, machine learning models |
Observability and rollbacks
Amazon ECS provides several mechanisms to monitor deployments and automatically roll back when issues arise.
Amazon CloudWatch alarms for automated failure detection
You can associate CloudWatch alarms with your Amazon ECS service for automatic rollback. If an alarm enters the ALARM state, the deployment rolls back.
Common alarm metrics include:
- Error rate: HTTPCode_Target_5XX_Count, HTTPCode_Target_4XX_Count
- Latency: TargetResponseTime (p50, p99, p99.9)
- Availability: UnHealthyHostCount, HealthyHostCount
- Custom metrics: Application-specific business metrics published to Amazon CloudWatch
Lifecycle hooks
Lifecycle hooks let you run custom validation logic at specific points during the deployment. You can use AWS Lambda functions to implement hooks for:
- Pre-deployment validation: Verify prerequisites before creating new tasks
- Post-deployment testing: Run automated tests against the new revision
- Custom health checks: Validate application-specific health criteria
- Integration testing: Test interactions with downstream dependencies
Hooks can return IN_PROGRESS to indicate ongoing validation, SUCCEEDED to proceed, or FAILED to trigger rollback.
Bake time configuration
The deployment bake time is a buffer period after traffic shifting completes, during which the old (blue) revision remains running. This gives you instant rollback by shifting traffic back, without redeploying tasks.
Consider the following bake time configuration:
- Most workloads: Set a baseline bake time that covers your typical health check intervals and allows enough time for error rates and latency metrics to surface in CloudWatch alarms.
- Workloads requiring extended observation: Increase the bake time for workloads with longer feedback loops, such as batch processing, async workflows, or services where downstream effects take time to manifest.
- Cost vs. safety tradeoff: Longer bake times increase costs (running both revisions) but improve rollback capability. Choose based on your service's mean time to detect (MTTD) failures.
Prerequisites
Before starting either walkthrough, verify that you have the following:
- An Amazon ECS cluster (AWS Fargate or Amazon Elastic Compute Cloud (Amazon EC2))
- An Application Load Balancer or Network Load Balancer with two target groups configured
- A task definition for your application
- A running Amazon ECS service configured with a load balancer and advancedConfiguration (two target groups and a production listener rule), along with an IAM role for traffic shifting. For the linear walkthrough, create a service named my-web-service; for the canary walkthrough, create a service named payment-service. See Creating an Amazon ECS linear deployment and Creating an Amazon ECS canary deployment for instructions.
- AWS Command Line Interface (AWS CLI) installed and configured
- Appropriate AWS Identity and Access Management (AWS IAM) permissions for Amazon ECS, Elastic Load Balancing, and Amazon CloudWatch
- An IAM role (for example, ecsBlueGreenRole) that allows Amazon ECS to manage load balancer target group weights during traffic shifting
- For the canary walkthrough: custom Amazon CloudWatch metrics for business logic validation (optional)
Walkthrough: linear strategy implementation
In this walkthrough, you deploy a sample application using the linear deployment strategy with automatic rollback capabilities.
Step 1: Create CloudWatch alarm for 5XX errors
# Create alarm for 5XX errors across both target groups
aws cloudwatch put-metric-alarm \
  --alarm-name my-service-5xx-errors \
  --alarm-description "Trigger on high 5XX error rate across both target groups" \
  --metrics '[
    {
      "Id": "blue5xx",
      "MetricStat": {
        "Metric": {
          "Namespace": "AWS/ApplicationELB",
          "MetricName": "HTTPCode_Target_5XX_Count",
          "Dimensions": [
            {"Name": "TargetGroup", "Value": "targetgroup/blue/xxx"},
            {"Name": "LoadBalancer", "Value": "app/my-load-balancer/xxx"}
          ]
        },
        "Period": 60,
        "Stat": "Sum"
      },
      "ReturnData": false
    },
    {
      "Id": "green5xx",
      "MetricStat": {
        "Metric": {
          "Namespace": "AWS/ApplicationELB",
          "MetricName": "HTTPCode_Target_5XX_Count",
          "Dimensions": [
            {"Name": "TargetGroup", "Value": "targetgroup/green/xxx"},
            {"Name": "LoadBalancer", "Value": "app/my-load-balancer/xxx"}
          ]
        },
        "Period": 60,
        "Stat": "Sum"
      },
      "ReturnData": false
    },
    {
      "Id": "total5xx",
      "Expression": "SUM([blue5xx, green5xx])",
      "Label": "Total 5XX Errors",
      "ReturnData": true
    }
  ]' \
  --evaluation-periods 2 \
  --threshold 10 \
  --comparison-operator GreaterThanThreshold
Step 2: Create alarm for high latency
Create an alarm for high response time across both target groups.
# Create alarm for high latency across both target groups
aws cloudwatch put-metric-alarm \
  --alarm-name my-service-high-latency \
  --alarm-description "Trigger on high response time across both target groups" \
  --metrics '[
    {
      "Id": "blueLatency",
      "MetricStat": {
        "Metric": {
          "Namespace": "AWS/ApplicationELB",
          "MetricName": "TargetResponseTime",
          "Dimensions": [
            {"Name": "TargetGroup", "Value": "targetgroup/blue/xxx"},
            {"Name": "LoadBalancer", "Value": "app/my-load-balancer/xxx"}
          ]
        },
        "Period": 60,
        "Stat": "Average"
      },
      "ReturnData": false
    },
    {
      "Id": "greenLatency",
      "MetricStat": {
        "Metric": {
          "Namespace": "AWS/ApplicationELB",
          "MetricName": "TargetResponseTime",
          "Dimensions": [
            {"Name": "TargetGroup", "Value": "targetgroup/green/xxx"},
            {"Name": "LoadBalancer", "Value": "app/my-load-balancer/xxx"}
          ]
        },
        "Period": 60,
        "Stat": "Average"
      },
      "ReturnData": false
    },
    {
      "Id": "maxLatency",
      "Expression": "MAX([blueLatency, greenLatency])",
      "Label": "Max Response Time",
      "ReturnData": true
    }
  ]' \
  --evaluation-periods 2 \
  --threshold 1.0 \
  --comparison-operator GreaterThanThreshold
Step 3: Configure the linear strategy
Update your Amazon ECS service to use linear deployment with CloudWatch alarm integration. This also enables deployment circuit breakers for automatic rollback.deployment circuit breakers
# Configure linear deployment strategy with CloudWatch alarm integration
aws ecs update-service \
  --cluster production-cluster \
  --service my-web-service \
  --deployment-configuration '{
    "deploymentCircuitBreaker": {
      "enable": true,
      "rollback": true
    },
    "strategy": "LINEAR",
    "linearConfiguration": {
      "stepPercent": 10,
      "stepBakeTimeInMinutes": 5
    },
    "alarms": {
      "alarmNames": [
        "my-service-5xx-errors",
        "my-service-high-latency"
      ],
      "enable": true,
      "rollback": true
    }
  }'
Step 4: Deploy a new version
Trigger a deployment by forcing a new deployment of the existing task definition:
# Trigger a deployment by forcing a new deployment of the existing task definition
aws ecs update-service \
  --cluster production-cluster \
  --service my-web-service \
  --force-new-deployment
Step 5: Monitor rollout progress
Monitor deployment progress in real time using the DescribeServiceDeployments and DescribeServiceRevisions APIs, which provide detailed information about traffic shifting status, rollout state, and revision details.
# List service deployments to get the deployment ARN
aws ecs list-service-deployments \
  --service arn:aws:ecs:region:account:service/production-cluster/my-web-service

# Get detailed deployment status including traffic shifting progress
aws ecs describe-service-deployments \
  --service-deployment-arns arn:aws:ecs:region:account:service-deployment/production-cluster/my-web-service/xxx

# Get details about a specific service revision
aws ecs describe-service-revisions \
  --service-revision-arns arn:aws:ecs:region:account:service-revision/production-cluster/my-web-service/xxx
Step 6: Observe traffic shifting
During the deployment, traffic shifts in 10% increments every 5 minutes:
Time    Blue (Old)    Green (New)    Status
0:00    100%          0%             Deployment started
0:05    90%           10%            Step 1 complete
0:10    80%           20%            Step 2 complete
0:15    70%           30%            Step 3 complete
...
0:45    0%            100%           Deployment complete
If Amazon CloudWatch alarms breach during deployment, Amazon ECS automatically pauses the deployment, shifts traffic back to the stable (blue) revision, terminates the new (green) tasks, and marks the deployment as FAILED.
Step 7: Verify rollout status
Check the deployment completed successfully:
# Check deployment status
aws ecs describe-services \
--cluster production-cluster \
--services my-web-service \
--query "services[0].deployments[?status=='PRIMARY'].rolloutState" \
--output text
Step 8: Verify alarm state
Confirm no alarms are in ALARM state:
# Confirm no alarms in ALARM state
aws cloudwatch describe-alarms \
--alarm-names my-service-5xx-errors my-service-high-latency \
--query "MetricAlarms[*].[AlarmName,StateValue]" \
--output table
Walkthrough: canary strategy implementation
This walkthrough deploys an update using the canary strategy.
Step 1: Create CloudWatch alarm for HTTP errors
Create an alarm for HTTP 5XX errors using metric math across both target groups.
# Create alarm for 5XX errors across both target groups (blue and green)
aws cloudwatch put-metric-alarm \
  --alarm-name payment-service-errors \
  --alarm-description "Trigger on high 5XX error rate across both target groups" \
  --metrics '[
    {
      "Id": "blue5xx",
      "MetricStat": {
        "Metric": {
          "Namespace": "AWS/ApplicationELB",
          "MetricName": "HTTPCode_Target_5XX_Count",
          "Dimensions": [
            {"Name": "TargetGroup", "Value": "targetgroup/blue/xxx"},
            {"Name": "LoadBalancer", "Value": "app/my-load-balancer/xxx"}
          ]
        },
        "Period": 60,
        "Stat": "Sum"
      },
      "ReturnData": false
    },
    {
      "Id": "green5xx",
      "MetricStat": {
        "Metric": {
          "Namespace": "AWS/ApplicationELB",
          "MetricName": "HTTPCode_Target_5XX_Count",
          "Dimensions": [
            {"Name": "TargetGroup", "Value": "targetgroup/green/xxx"},
            {"Name": "LoadBalancer", "Value": "app/my-load-balancer/xxx"}
          ]
        },
        "Period": 60,
        "Stat": "Sum"
      },
      "ReturnData": false
    },
    {
      "Id": "total5xx",
      "Expression": "SUM([blue5xx, green5xx])",
      "Label": "Total 5XX Errors",
      "ReturnData": true
    }
  ]' \
  --evaluation-periods 2 \
  --threshold 5 \
  --comparison-operator GreaterThanThreshold
Step 2: Create alarm for business metrics
Create a business metric alarm for application monitoring:
# Business metric alarm (custom)
aws cloudwatch put-metric-alarm \
  --alarm-name payment-transaction-failure-rate \
  --metric-name TransactionFailureRate \
  --namespace CustomApp/Payments \
  --statistic Average \
  --period 300 \
  --evaluation-periods 1 \
  --threshold 0.5 \
  --comparison-operator GreaterThanThreshold
Step 3: Configure the canary strategy
Configure the canary with a small initial traffic percentage and an extended bake time:
# Configure canary deployment strategy with CloudWatch alarm integration
aws ecs update-service \
  --cluster production-cluster \
  --service payment-service \
  --deployment-configuration '{
    "deploymentCircuitBreaker": {
      "enable": true,
      "rollback": true
    },
    "strategy": "CANARY",
    "canaryConfiguration": {
      "canaryPercent": 5,
      "canaryBakeTimeInMinutes": 20
    },
    "alarms": {
      "alarmNames": [
        "payment-service-errors",
        "payment-transaction-failure-rate"
      ],
      "enable": true,
      "rollback": true
    }
  }'
Step 4: Deploy new version
Trigger a deployment by forcing a new deployment of the existing task definition:
# Trigger a deployment by forcing a new deployment of the existing task definition
aws ecs update-service \
  --cluster production-cluster \
  --service payment-service \
  --force-new-deployment
Step 5: Observe canary traffic pattern
During canary deployment, traffic shifts in two phases:
Phase 1: Canary testing (20 minutes)
Time    Blue (Old)    Green (New)    Status
0:00    100%          0%             Canary deployment started
0:01    95%           5%             Canary phase - monitoring
0:05    95%           5%             Canary phase - monitoring
0:10    95%           5%             Canary phase - monitoring
0:15    95%           5%             Canary phase - monitoring
0:20    95%           5%             Canary validation complete

Phase 2: Full rollout (if canary succeeds)
0:21    0%            100%           Full traffic shift
0:21    0%            100%           Deployment complete
Step 6: Verify rollout status
Check the deployment completed successfully:
# Check deployment status
aws ecs describe-services \
--cluster production-cluster \
--services payment-service \
--query "services[0].deployments[?status=='PRIMARY'].rolloutState" \
--output text
Step 7: Verify alarm state
Confirm no alarms are in ALARM state:
# Confirm no alarms in ALARM state
aws cloudwatch describe-alarms \
--alarm-names payment-service-errors payment-transaction-failure-rate \
--query "MetricAlarms[*].[AlarmName,StateValue]" \
--output table
Best practices
This section provides guidance on configuring alarms and setting bake times for your deployments.
Amazon CloudWatch alarm configuration
Consider configuring two tiers of alarms: critical alarms that trigger automatic rollback, and warning alarms for monitoring only. Set thresholds and evaluation periods based on your application's baseline performance and acceptable error rates.
Critical alarms (immediate rollback):
- HTTPCode_Target_5XX_Count
- TargetResponseTime (p99)
- UnHealthyHostCount
Warning alarms (monitor, don't roll back):
- TargetResponseTime (p50)
- RequestCount (anomaly detection or percentage decrease)
- CPUUtilization
Bake time guidelines
Canary bake time:
- Low risk: shorter bake time
- Medium risk: moderate bake time
- High risk: extended bake time
Deployment bake time:
- Set a baseline that exceeds your service's mean time to detect (MTTD) failures
- This gives you instant rollback without redeployment
Clean up resources
To avoid ongoing charges, delete all resources created during the walkthroughs. Load balancers and running Amazon ECS tasks are the primary cost drivers.
Warning: The –force flag immediately stops all running tasks without draining connections. This causes service disruption. Make sure no active traffic is being served and back up any necessary data before proceeding.
# Delete the linear walkthrough ECS service
aws ecs delete-service \
--cluster production-cluster \
--service my-web-service \
--force

# Delete the canary walkthrough ECS service
aws ecs delete-service \
--cluster production-cluster \
--service payment-service \
--force

# Delete CloudWatch alarms for linear walkthrough
aws cloudwatch delete-alarms \
--alarm-names my-service-5xx-errors my-service-high-latency

# Delete CloudWatch alarms for canary walkthrough
aws cloudwatch delete-alarms \
--alarm-names payment-service-errors payment-transaction-failure-rate

# Delete target groups (after service deletion completes)
aws elbv2 delete-target-group \
--target-group-arn arn:aws:elasticloadbalancing:region:account:targetgroup/blue/xxx
aws elbv2 delete-target-group \
--target-group-arn arn:aws:elasticloadbalancing:region:account:targetgroup/green/xxx

If you created the following resources specifically for this walkthrough and no longer need them, delete them:

# Delete the ECS cluster
aws ecs delete-cluster \
--cluster production-cluster

# Delete the load balancer
aws elbv2 delete-load-balancer \
--load-balancer-arn arn:aws:elasticloadbalancing:region:account:loadbalancer/app/my-load-balancer/xxx

# Deregister task definitions
aws ecs deregister-task-definition \
--task-definition my-task-definition:1

# Delete the IAM role
aws iam delete-role \
--role-name ecsBlueGreenRole
Conclusion
In this post, we showed you how to configure linear and canary deployment strategies in Amazon ECS with CloudWatch alarms for automatic rollback, providing native gradual rollout support with automated safety.
Next steps
To get started, try the linear deployment strategy with a non-production service first. Experiment with different step percentages and bake times to find optimal settings. After validating linear deployments, adopt canary deployments for your most sensitive services.
These strategies are available today in commercial AWS Regions. For pricing details, see the Amazon ECS pricing page.
For more information, see the Amazon ECS Developer Guide.
Additional resources
- For more information about deployment types and configuration options, see Amazon ECS deployment strategies documentation.
- For more information about automatic rollback mechanisms, see Amazon ECS deployment circuit breaker.
- For more information about traffic distribution during deployments, see Elastic Load Balancing weighted target groups.
Cloud native application challenges: installing the walking skeleton
Manning's Platform Engineering book excerpt introduces the 'walking skeleton' pattern for validating Kubernetes deployment pipelines before building full functionality.
Summary
Decoder
Original Article
Remote Cache CDC: Reusing Bytes
BuildBuddy's content-defined chunking stops Bazel from re-uploading entire binaries when only a few bytes changed, cutting cache transfers 40% in benchmarks.
Summary
Deep Dive
Decoder
Original Article
The goal: move the changed bytes, not the whole output.
BuildBuddy's Remote Cache uses Content-Defined Chunking (CDC) to make large build outputs behave more incrementally. When a binary, bundle, package, or archive is mostly unchanged, BuildBuddy can reuse chunks it has already seen instead of re-uploading or re-downloading the entire file.
In our Bazel chunking implementation PR, we observed 40% less data uploaded and a 40% smaller disk cache when benchmarked on BuildBuddy's own repo. To enable client-side CDC with BuildBuddy, use Bazel 8.7 or 9.1+ and pass --experimental_remote_cache_chunking.
Setting the Scene
The next frontier for build caching is not just skipping actions. It is skipping bytes.
Build caching has come a long way. Instead of rebuilding the world after every edit, Bazel and remote caching let teams reuse action outputs across machines and CI jobs. In practice, builds have moved from something closer to O(size of repo) toward O(size of change).
But "size of change" can be misleading. What really matters is the size of the transitive actions affected by the edit. A small source change can still ripple into many binaries, packages, bundles, and other large outputs, even when only a small part of each output actually changes.
That invalidation is expected. Build systems should rerun an action when its inputs change. The remote-cache problem is what happens next: the cache sees a new digest and moves the whole blob, even if that blob is mostly the same bytes as the previous version.
Transitive Actions
Linking, bundling, packaging, and archiving are where this shows up most often. They combine many transitive inputs into one output.
That makes them different from actions that operate on a small, direct set of files. A typical compile action might compile one source file using a smaller set of direct inputs. A transitive action, on the other hand, often consumes the accumulated outputs of many dependencies and produces one final binary, bundle, package, or archive.
In Bazel rules, this often shows up as a rule collecting files through a transitive depset and passing that accumulated set into a single action. For example, a simplified compile action might look like this:
ctx.actions.run(
    inputs = [src] + direct_headers,
    outputs = [obj],
    executable = compiler,
    arguments = ["-c", src.path, "-o", obj.path],
)
A bundling or packaging action often looks more like this:
transitive_inputs = depset(
    direct = direct_files,
    transitive = [dep[MyInfo].files for dep in ctx.attr.deps],
)

ctx.actions.run(
    inputs = transitive_inputs,
    outputs = [bundle],
    executable = bundler,
    arguments = ["--output", bundle.path],
)
That second shape is where small source changes can fan out into large output changes. The source edit might only change a small sequence of bytes in the final output, but the output digest is still new.
Without CDC, the cache treats that as a completely new blob, even when most of the binary, bundle, package, or archive is byte-for-byte identical to the previous version. If many final outputs depend on that changed input, they can all get new digests.
For remote caching, the expensive part is not just that the output is large. It is that the output is large and mostly similar to something the cache already has, but the whole-blob digest is new.
That creates two problems:
- Uploads and downloads move the whole blob, even when only a small part changed.
- Storage keeps another whole blob, even when most bytes are duplicates.
One workaround is to disable remote caching for these actions. That avoids uploading huge outputs when the expected cache hit is not worth the write cost, but it creates a different problem: the action now has to run every time. It can also make the action harder to move to remote execution, because RBE depends on moving action inputs and outputs efficiently.
So the build avoids one expensive cache write, but gives up reuse entirely.
A small source change can invalidate the final transitive action.
Case study: Go tests
A common example is a shared go_library, say foo, that is imported by many other libraries: bar1, bar2, through barN. Each bar library may also have its own go_test.
An implementation-only change in foo might only rebuild foo's own GoCompilePkg action. The downstream compile actions can often still hit cache because Go compilation depends on direct dependency export data, like foo.x, not the full transitive archive graph.
Linking is different. Each go_test needs a test binary, produced by a GoLink action, and that link action consumes the transitive set of Go archives, like foo.a. If foo.a changes, many downstream test binaries can get new digests even when their source and compile actions did not change. Finally, the TestRunner action needs that test binary as an input in order to run it.
That means one small source edit can create many new test binary digests. Those test binaries are often large, and many of them are mostly the same bytes as before. Without CDC, each one is still transferred and stored as a new whole blob.
Treating This as an Output Problem
One option would be to make the actions themselves incremental: incremental linking, runtime linking, smarter bundling, smarter packaging, and so on. But this is usually very difficult, and requires extensive changes to the linkers and tools themselves.
And even if we solved that for one tool, we would still need separate solutions for GoLink, C++ linkers, JavaScript bundlers, app packagers, generated archives, and every other action that can produce a large output. That does not scale.
Instead, we can treat this as a generic output problem: these actions create large files, where only a small amount of content is changing. With Content-Defined Chunking (CDC), we can leave the actions themselves untouched, while still getting many of the wins of making those actions incremental.
Content-Defined Chunking
CDC is a repeatable process for splitting a file into chunks based on its contents rather than fixed byte offsets.
The TL;DR is: run a rolling hash over a small window of bytes, and split when the hash matches a rare pattern. The hash behaves randomly enough that this happens only occasionally, but the process is still deterministic: the same content produces the same chunk boundaries.
If you want chunks around 512 KiB on average, choose a pattern that has about a 1 in 512 KiB chance of matching at each byte. If the pattern does not match, shift the window and try again. Over time, this gives you the average chunk size you wanted while keeping the boundaries content-defined.
Smaller chunks improve deduplication but increase metadata overhead and RPC cost, so CDC implementations balance chunk size against efficiency.
For a toy example, imagine the rolling window is 4 bytes wide and we split whenever the hash of that 4-byte window ends in 00. Suppose the windows bbbb and cccc both happen to match that pattern (the exact hash values do not matter):
original:  aaaabbbbccccdddd
windows:       bbbb
                   cccc
cuts:      aaaa|bbbb|cccc|dddd
If we insert a few bytes inside bbbb, the nearby windows change, so that chunk changes:
updated: aaaabbXXbbccccddddBut once the rolling window moves past the inserted bytes and reaches cccc again, it sees the same 4-byte sequence as before. That sequence produces the same hash, so the algorithm finds the same cut point again. The later chunks can keep the same boundaries and hashes.
Real CDC uses a larger rolling window and a much rarer split pattern, but the idea is the same.
This means that a large file with a few bytes added or removed somewhere in the file usually only changes the nearby chunk(s). Once the rolling window moves past the changed bytes and reaches unchanged content again, it starts seeing the same byte sequences as before, so it finds the same future cut points.
One common CDC algorithm is FastCDC. The FastCDC presentation slides are also a helpful visual overview.
Only the changed chunk needs to be uploaded again.
How does this benefit remote caching?
If an action creates a large output, like GoLink or CppLink, a small input change may still produce a new output that is mostly identical to the previous one.
With CDC, the cache can split that output into chunks and discover that many of them already exist. Instead of uploading the whole output again, it uploads only the missing chunks.
This works especially well for CI and developer builds, where nearby commits often produce outputs that are mostly similar. Once a chunk has been uploaded, future builds can reuse it across related outputs.
Most of the output can still map to chunks that already exist in the cache.
Results
In this recent window, CDC deduplicated about 85% of written bytes across eligible BuildBuddy cache writes. In other words, most large-output writes were already present as reusable chunks, so only the remaining changed chunks needed to be uploaded.
Over this two-week window, CDC skipped uploading ~300 TiB of duplicate chunk data on the write path, with peaks over 4 TiB per hour. This comes from write-side chunk deduplication across BuildBuddy-managed cache writes and executor output uploads. Total network savings should be higher, since this does not include read-side savings when chunks are served from disk caches, regional caches, or executor file caches.
In production, CDC has already skipped hundreds of TiB of duplicate chunk uploads. Because BuildBuddy stores less duplicate data, effective cache retention has also improved.
The Bazel implementation PR benchmarked 50 commits of the BuildBuddy repo and saw about 40% less data uploaded, about 40% smaller disk cache, and faster builds in that benchmark.
BuildBuddy currently applies chunking to blobs larger than 2 MiB. In one test, only about 4.2% of objects were above that threshold, so most blobs are not chunked.
Within that eligible subset, CDC deduplicated about 85% of written bytes. Across all cache traffic, overall savings are typically in the 20 to 40% range.
As a rule of thumb, CDC works best for outputs that are large and byte-stable across revisions. Linking and packaging tend to be good fits, and most large outputs we see reuse most of their bytes. Bundling is also a good fit when the output is not compressed, obfuscated, or randomized.
Compression is not terrible, but it usually causes more churn. Compressed formats like tar.gz archives and Docker image layers are often less chunkable because a small input change can rewrite more of the compressed byte stream. The key property is byte-level similarity, not the file extension.
Implementation
To make this work end to end, the change lands in three places:
- Remote APIs define the shared
SplitBlob/SpliceBlobprotocol so clients and caches can talk about chunks. - BuildBuddy implements the server-side cache behavior and executor-side chunked uploads and downloads.
- Bazel implements the client-side combined cache path so the local disk cache and remote cache can share chunks.
Remote APIs: Split and Splice
To make CDC useful for remote caching, clients and servers need a way to talk about chunks instead of only whole blobs. This is especially useful when the network is the bottleneck: users on slow networks, VPNs, or with high latency to the cache should not need to upload or download a whole large output when most of its chunks already exist somewhere.
Instead, the client can discover how a blob maps to chunks, check which chunks are already available locally, and transfer only the missing pieces.
This is where SplitBlob and SpliceBlob come in.
SplitBlob is the read-side API. Given the digest of a large blob, the client asks the cache if it already knows the chunk layout for that blob. If it does, the client can download only the chunks it does not already have.
SpliceBlob is the write-side API. After an action creates a large output, Bazel or the executor uploads any missing chunks and tells the cache how to reconstruct the full blob from those chunks. The cache stores that reconstruction metadata so future SplitBlob calls for the same blob digest can return the chunk layout.
The read path becomes:
- Call
SplitBlobto get the chunk layout for a large blob. - Check which chunks are already present in the local cache.
- Download the missing chunks with
ReadorBatchReadBlobs.
The write path is the reverse:
- After producing a large output, the client or executor runs it through the CDC algorithm to compute chunk boundaries and chunk digests.
- It calls
FindMissingBlobsto check which chunks the cache is missing. - It uploads only the missing chunks with
WriteorBatchUpdateBlobs. - It calls
SpliceBlobto store the reconstruction metadata.
With this model, chunks are stored as normal CAS blobs under their own digests. The reconstruction metadata is keyed by the original large blob digest, so future SplitBlob calls can start from the digest they already know and discover the chunk layout.
This also helps distribute storage more evenly. Instead of treating one very large object as an indivisible cache entry, the cache can store and serve smaller chunks across the CAS like any other blob.
SplitBlob is the read-side API; SpliceBlob is the write-side API.
Bazel Combined Cache
Bazel implements CDC in the combined cache, which coordinates remote cache and disk cache reads and writes.
When the remote cache advertises chunking support, Bazel creates chunked upload and download paths. Large blobs above the server-provided threshold use the chunked path; smaller blobs keep using the normal cache path.
One important implementation detail is that Bazel does not need to keep a second copy of every chunk in memory. The output already exists on disk, so the uploader can use the original file as the source for chunk data and stream the needed byte ranges during upload.
The client can keep byte ranges in the original file instead of a second copy of every chunk.
BuildBuddy Implementation
BuildBuddy implements CDC on the server side and in executors.
Server Side
The server side implements SplitBlob and SpliceBlob. Chunks are stored as normal CAS entries keyed by their chunk digest, while the reconstruction metadata is stored separately under a key derived from the original blob digest. When SpliceBlob is called, BuildBuddy verifies that the chunks exist and that concatenating them produces the original blob digest.
Because this happens behind the cache APIs, BuildBuddy can reduce transfer for large reads and writes while keeping existing unchunked cache paths working. The server-side cache path can skip chunks that already exist, move the chunks that are missing, and transfer those chunks in parallel.
Executors
Executors can upload large action outputs as chunks directly. The executor walks outputs normally, uses the negotiated chunking parameters to compute chunk digests for large files, calls FindMissingBlobs, and uploads only the missing chunks. The uploader can read the needed byte ranges from the original file and upload chunks concurrently, instead of keeping a second full copy in memory.
This means CDC can help on multiple hops: Bazel client to BuildBuddy, executor to BuildBuddy, and internal server-side cache traffic. Native Split/Splice-aware clients get end-to-end chunked transfers, while existing clients can still use the normal cache APIs.
Availability
Bazel support for CDC was introduced in bazelbuild/bazel#28437, and remote cache CDC is available in Bazel 8.7 and 9.1+.
Bazel clients using BuildBuddy can opt in to local client-side upload/download savings with:
bazel build //... --experimental_remote_cache_chunkingBuildBuddy servers currently have CDC enabled for large files flowing through the server-side cache path. Self-hosted executor users should run BuildBuddy executor v2.261.0 or newer for full CDC benefits. No executor config is required; CDC-eligible execution requests enable it automatically.
Closing
CDC makes remote caching better at what developers actually do all day: make small changes to large codebases that sometimes produce large outputs. Instead of uploading and downloading the same bytes again and again, BuildBuddy and Bazel can now reuse the chunks that did not change, significantly cutting down on cache transfer.
Try it today with Bazel 8.7 or 9.1+ by setting --experimental_remote_cache_chunking on your BuildBuddy cache-enabled Bazel builds.
Further Reading and References
Bazel and BuildBuddy:
- Bazel implementation PR
- Recommended Bazel performance flags
- BuildBuddy remote build execution
- Bazel remote caching
Remote APIs:
- Remote Execution API: SplitBlob and SpliceBlob
- Remote APIs PR adding the original SplitBlob and SpliceBlob APIs
- Remote APIs PR updating SplitBlob and SpliceBlob
- Remote APIs PR adding cache chunking settings
Content-defined chunking:
Create Custom MCP Catalogs and Profiles
Docker tackles AI tool sprawl by packaging MCP server catalogs as OCI container artifacts, letting enterprises distribute approved tools through Docker Hub with the same access controls they use for images.
Summary
Deep Dive
Decoder
Original Article
Custom MCP Catalogs and Profiles: Advancing Enterprise MCP Adoption
We're excited to announce the general availability of Custom Catalogs and Profiles for managing Model Context Protocol (MCP) servers. These two complementary capabilities fundamentally change how teams package, distribute, and manage AI tooling.
Custom MCP Catalogs let organizations curate and distribute approved collections of MCP servers. MCP Profiles enable individual developers to easily build, run, and share their MCP tools and configurations across projects and teams.
In this post, we'll walk through how to create your own custom catalog – building on and improving our previous approach. We'll also introduce Profiles, a new primitive that lets you define portable, named groupings of MCP servers. Profiles are designed to solve several practical use cases today, while giving us a foundation to expand in the future.
Creating custom catalogs with Docker
As organizations adopt MCP, we consistently hear the same need: teams need a way to curate a trusted list of MCP servers, including internally built servers.
To address these needs, we built Custom Catalogs. Instead of every team member searching for MCP servers across the open internet, organizations can publish and distribute catalogs that define approved servers. This allows developers to centrally discover and use trusted MCP servers within organizational boundaries.
Custom Catalogs can reference servers from Docker's MCP Catalog, community sources, and custom MCP servers developed internally, bringing flexibility, control, and trust together in a single experience. We will show you how to do that with a Custom Catalog.
Step-by-step: Building and sharing a custom MCP catalog
In this example, we will create a Custom Catalog containing servers from the Docker MCP Catalog and an MCP server we created ourselves from the CLI. Then we will show you how to use Docker Desktop to import the catalog.
All the functionality we will show can be exercised through the CLI, while a subset of primarily user-centric features can be exercised through Docker Desktop.
Here, we will use my personal Docker Hub ID roberthouse224 in the commands, but you should adapt to use your information where appropriate (e.g. pushing an image).
Step 1: Creating my custom MCP server and pushing it to Docker Hub
We built a reference server called roll-dice (GitHub Repository). It is a regular MCP server that communicates over stdio and can be built as a Docker image. The image has already been built and pushed to Docker Hub.
We can create the metadata that describes the server including where the image can be found and save it to a file named mcp-dice.yaml to be used when creating our catalog.
name: roll-dice
title: Roll Dice
type: server
image: roberthouse224/mcp-dice@latest
description: An mcp server that can roll dice
Step 2: Creating a catalog that includes servers from the Docker MCP Catalog alongside a server you have built yourself
Now we can create a custom catalog containing servers from the Docker MCP Catalog and the MCP server we created ourselves.
docker mcp catalog create roberthouse224/our-catalog \
--title "Our Catalog" \
--server catalog://mcp/docker-mcp-catalog/playwright \
--server catalog://mcp/docker-mcp-catalog/github-official \
--server catalog://mcp/docker-mcp-catalog/context7 \
--server catalog://mcp/docker-mcp-catalog/atlassian \
--server catalog://mcp/docker-mcp-catalog/notion \
--server catalog://mcp/docker-mcp-catalog/markitdown \
--server file://./mcp-dice.yaml
Step 3: Verifying the MCP servers in the custom catalog
We can now list our catalogs and see the catalog that we created
docker mcp catalog list
We can also inspect the contents of the catalog
docker mcp catalog show roberthouse224/our-catalog --format yaml
Step 4: Share the catalog
At the moment our custom catalog only lives on our machine. But what we have – and this is really powerful – is an immutable OCI artifact containing our trusted MCP servers that can be easily shared.
We can push our catalog to a container registry, in this example we're using Docker Hub. Now, anyone that has access to your organization's namespace can access the catalog.
docker mcp catalog push roberthouse224/our-catalog
Using a custom MCP catalog
Now that our custom catalog has been shared, colleagues can import it from within Docker Desktop (or from the cli using docker mcp catalog pull).
Import the catalog from Docker Desktop by selecting "Import catalog," and then specifying the OCI reference in the dialog.
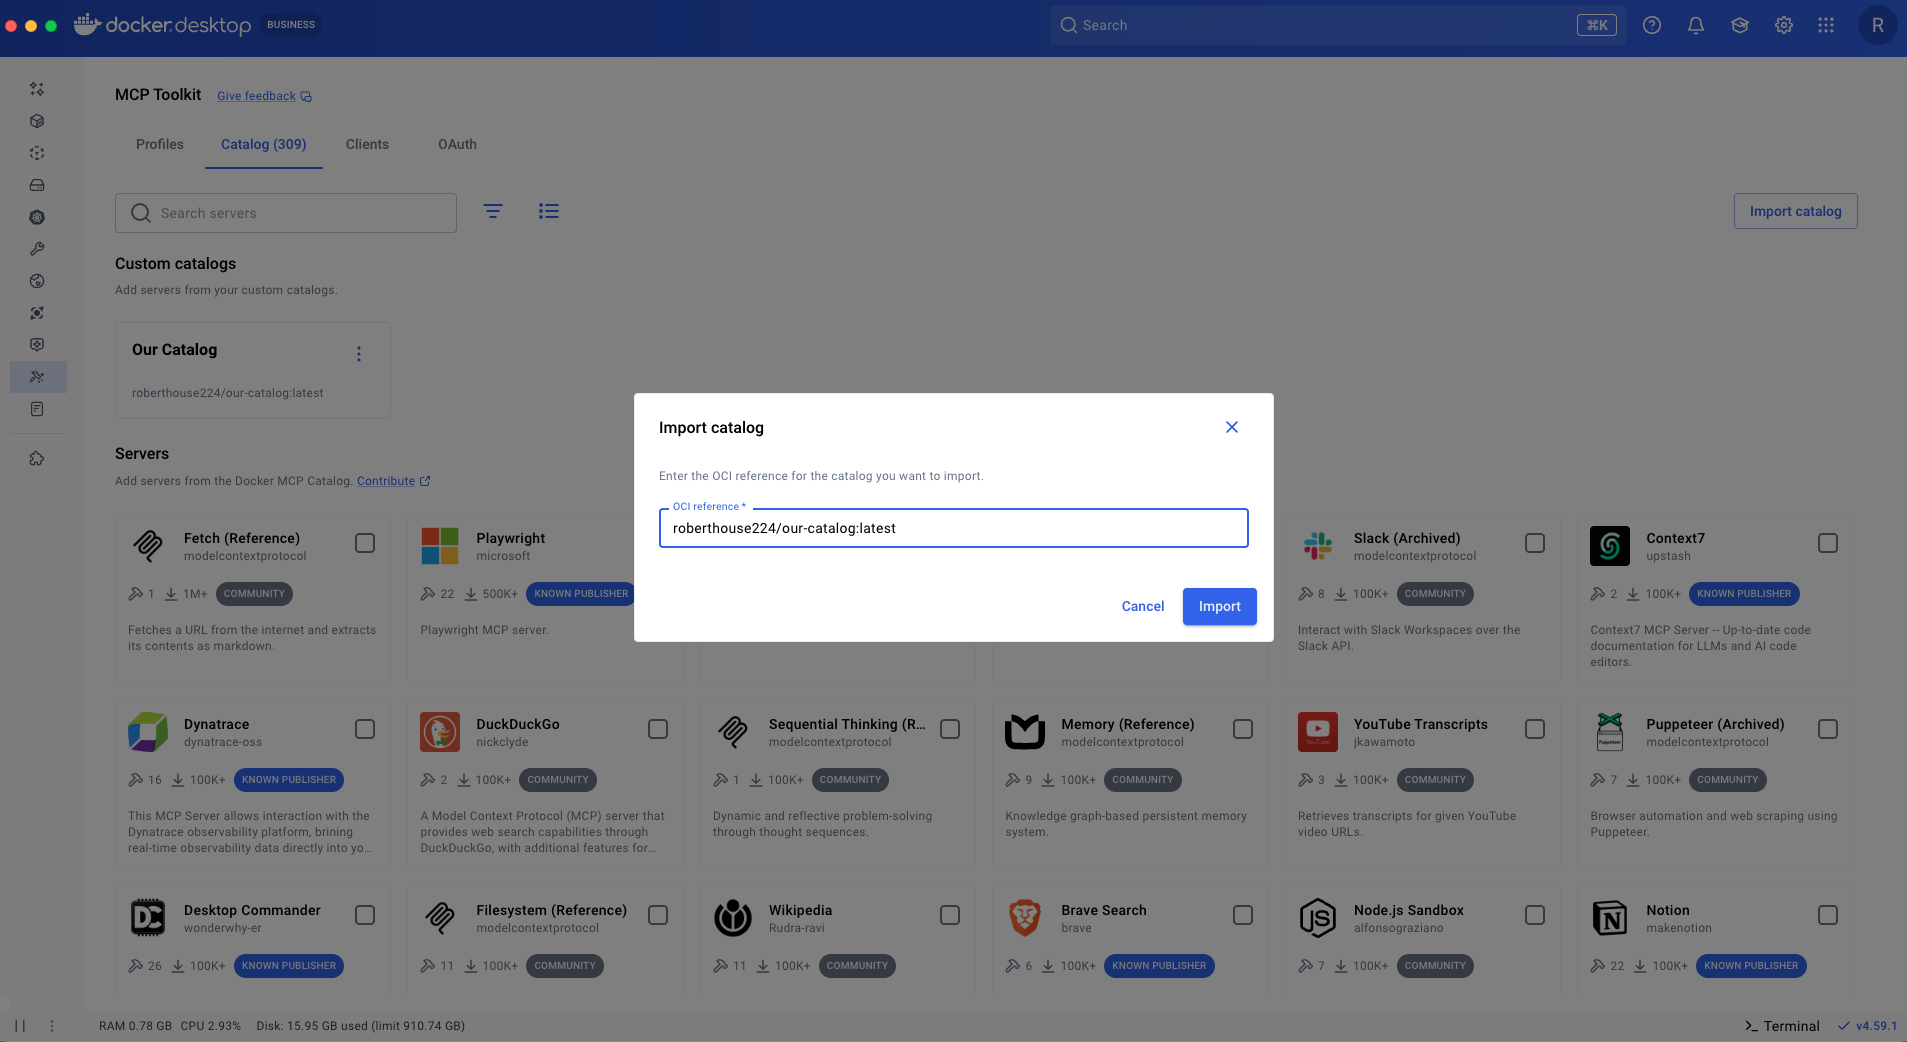
The catalog is now browsable. You can double click into the catalog and see all of the servers contained within it. Notice the custom MCP server that we added named "Roll Dice."
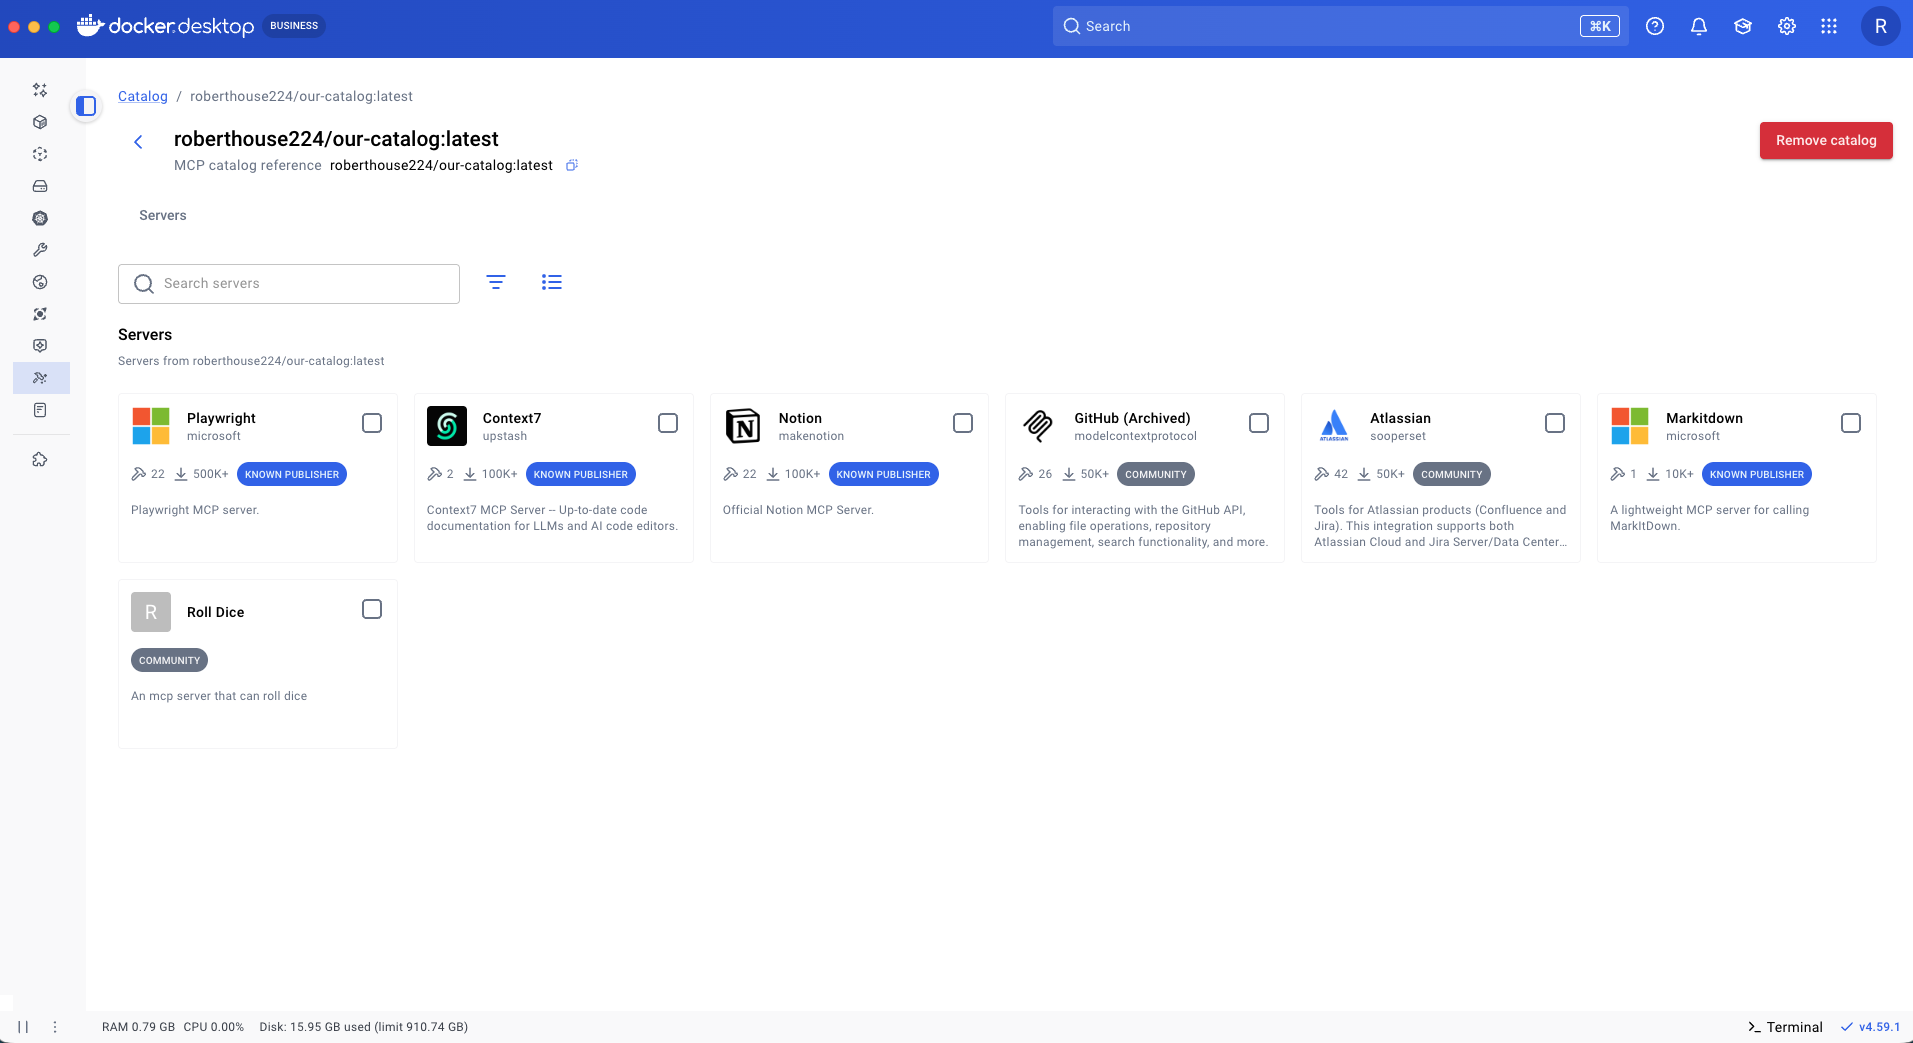
To make this a private catalog all you need to do is manage access to the repository the way you always have for container images – no new infrastructure to manage or systems to learn.
This is exactly what Jim Clark was describing in his post Private MCP Catalogs and the Path to Composable Enterprise AI.
This simple pattern can be extended to support more complex use cases. For example, you might use a private container registry instead of Docker Hub, or connect to a remote MCP server over streamable HTTP you host yourself rather than running a containerized server as shown in the example.
Now that we have a shareable custom catalog of trusted MCP servers we can shift focus to how individuals can effectively leverage MCP servers from the catalog we built in their workflows.
Using Profiles to create and share MCP Workflows
With MCP Profiles, developers can organize workflows efficiently and maintain separate server collections and configurations for different use cases. Profiles can be shared across teams, enabling collaboration on server setups and ensuring consistent configurations for teams working within the same projects or contexts.
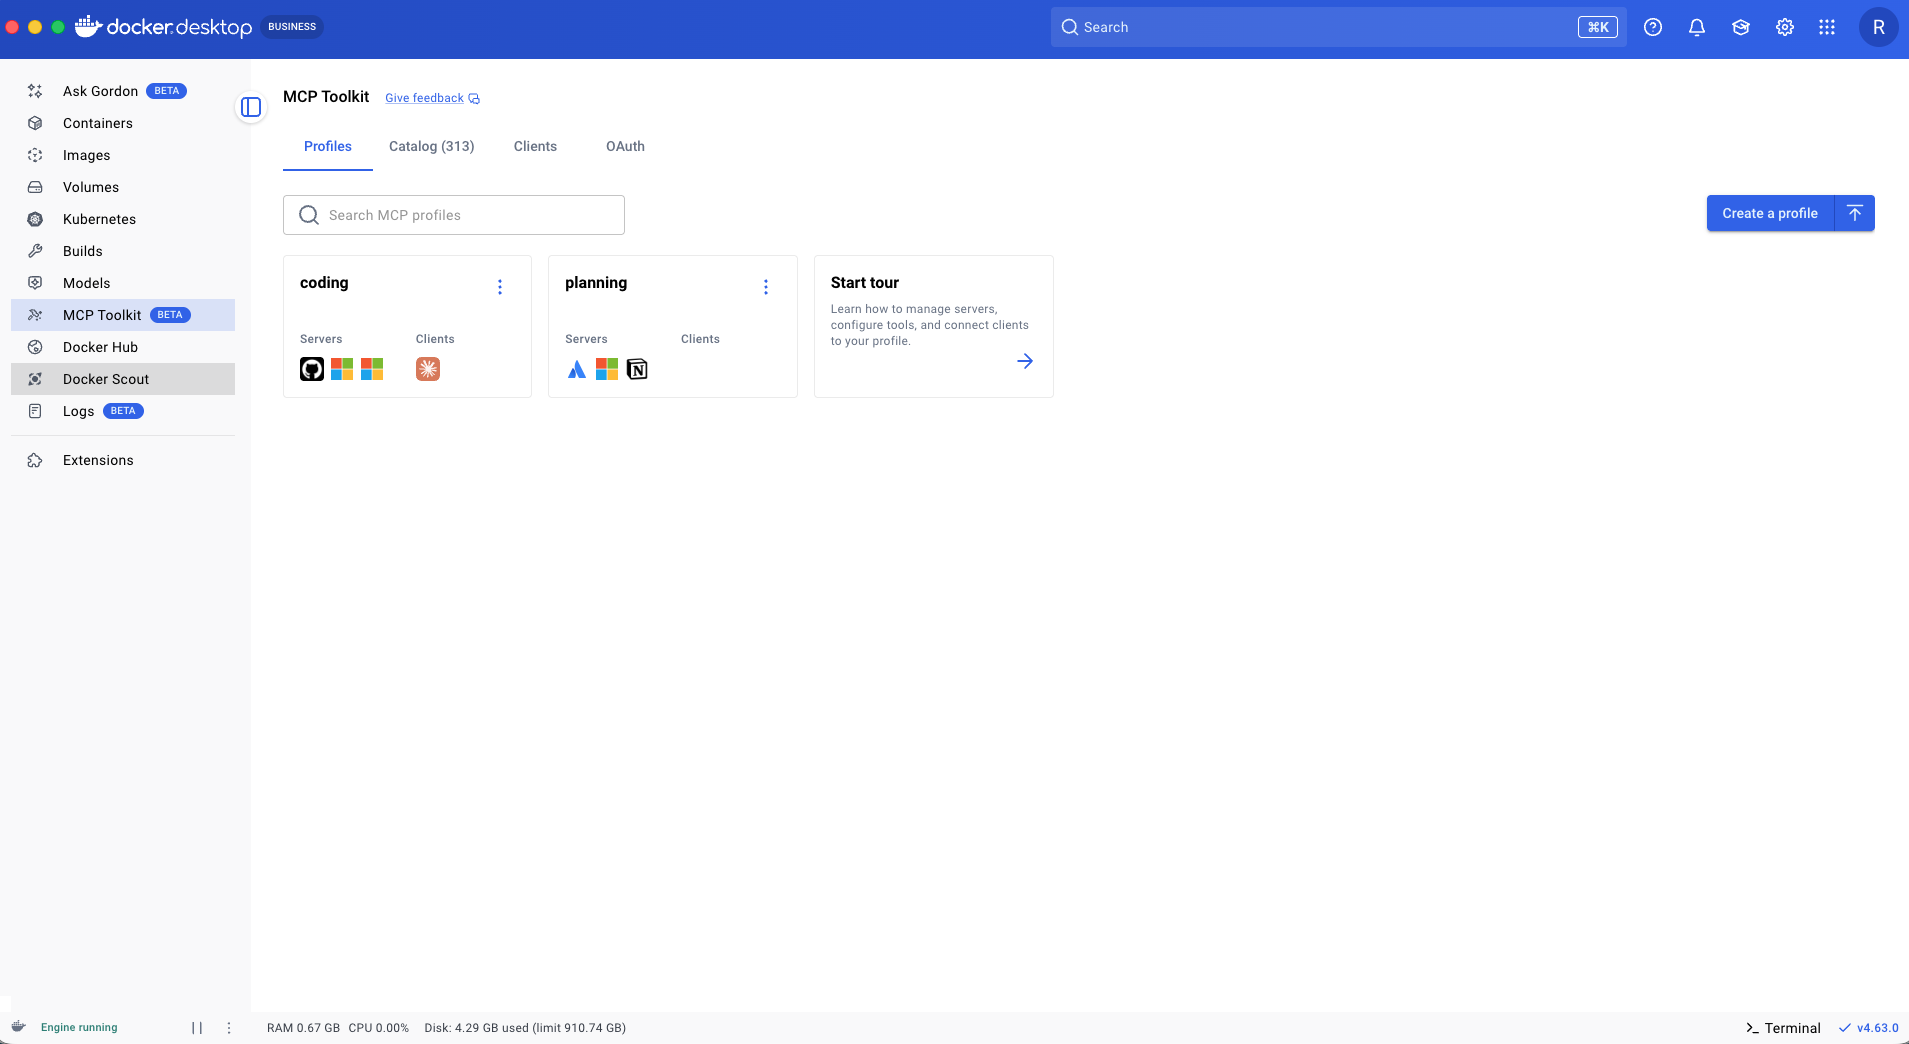
Switch between Profiles
At a basic level, a Profile is a named grouping of MCP servers that can be connected to an agent session. This makes it straightforward to define different Profiles for different ways of working.
Now let's see an example in action.
We create a profile named coding and another named planning. We browse our custom catalog, select the MCP servers that we want (e.g. Playwright, GitHub, and Context7) then select the "Add to" drop down, and select "New profile".
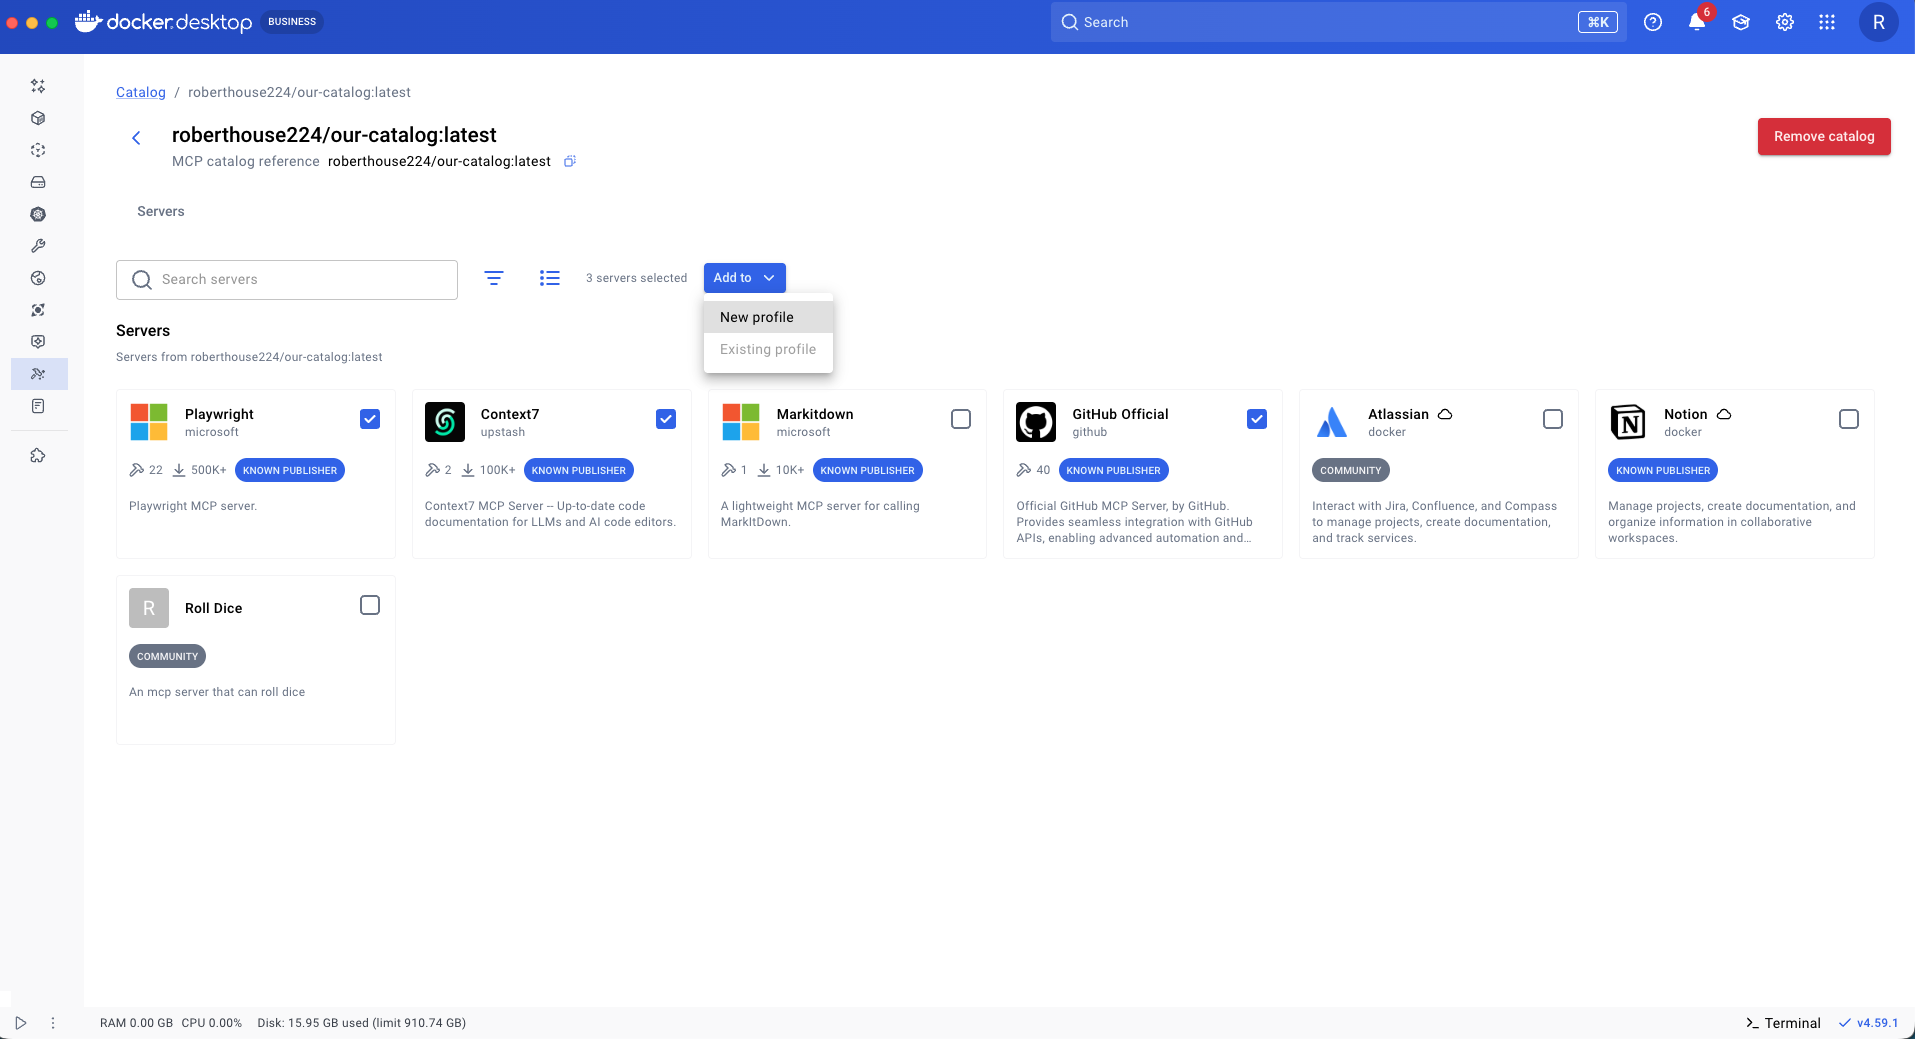
Give the profile a name, select the client you want to connect to, and select "Create".
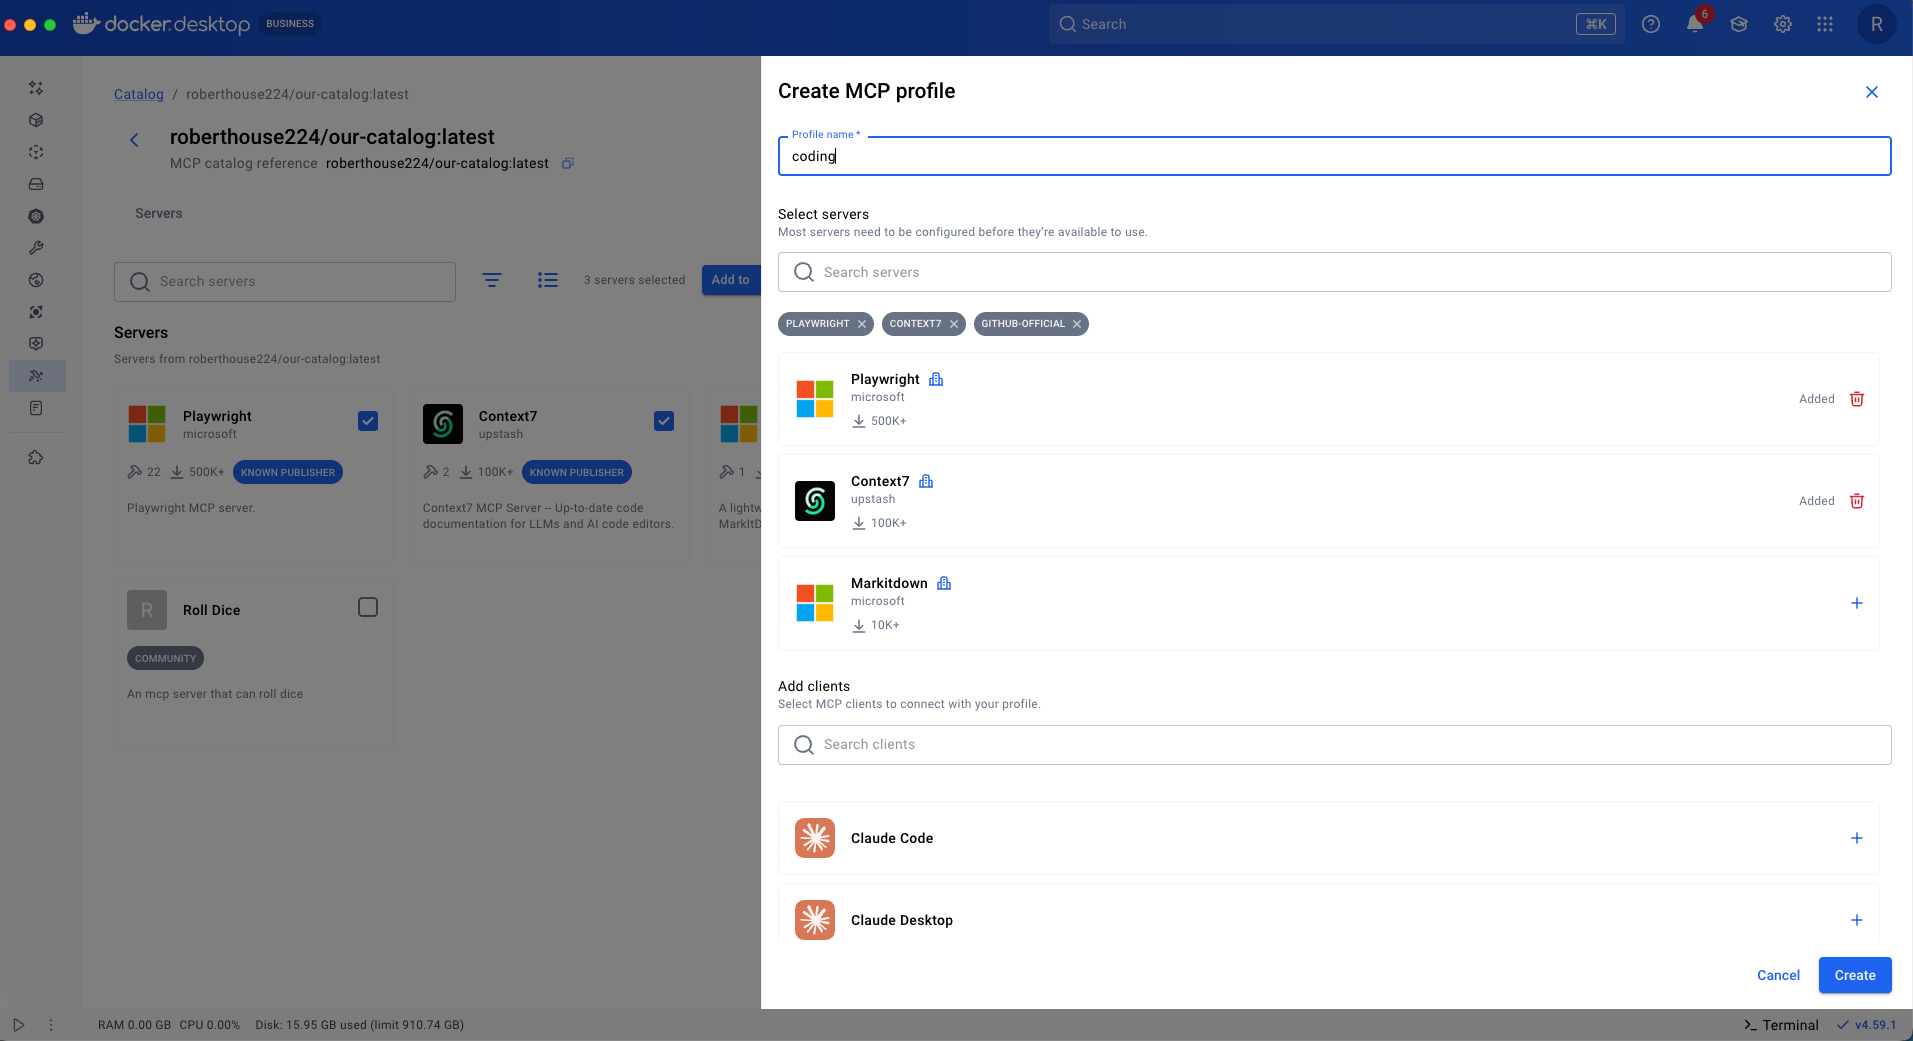
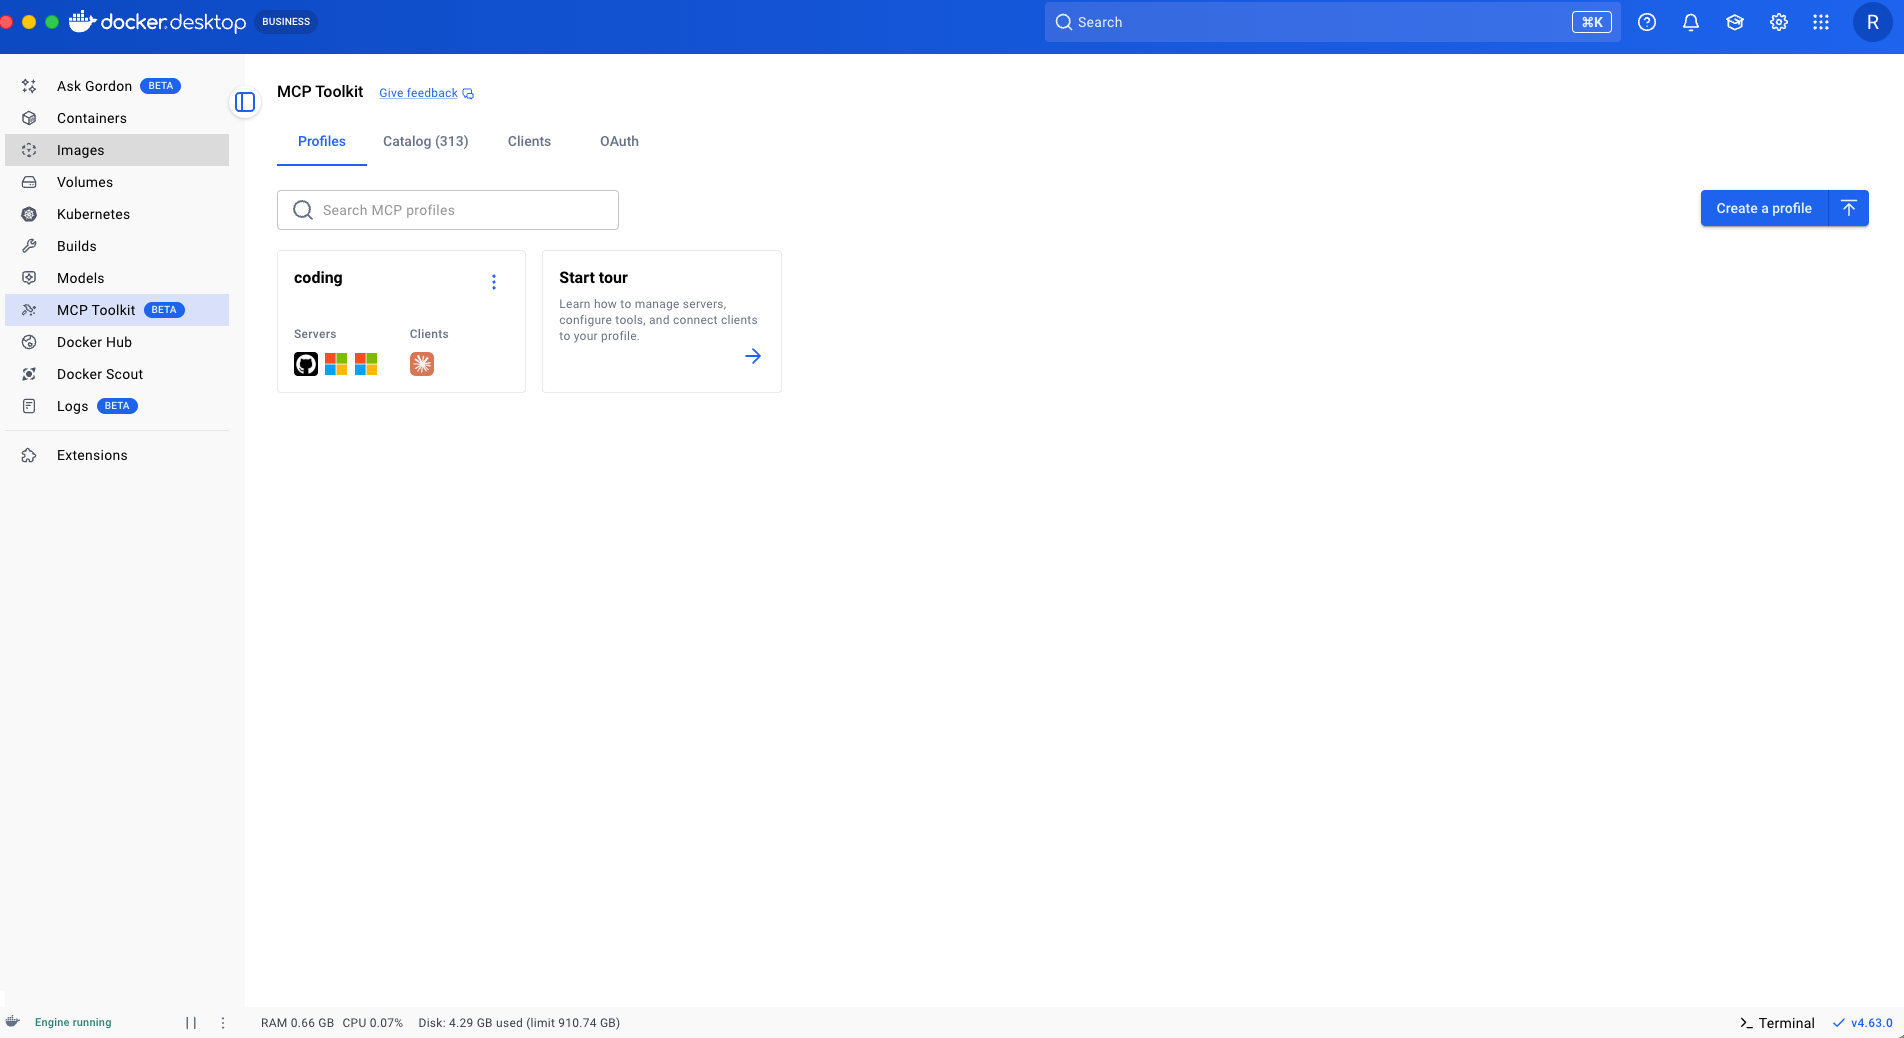
From the Profiles tab, we can see the profile we just created. Our client is connected and our tools are ready to use.
Next we create a profile named planning with servers relevant to planning (e.g. Atlassian, Markitdown, Notion).
Navigate back to "our-catalog" (if not already there), select the servers relevant to planning, and select "Add to" -> "New profile." Give the profile a name (e.g. planning). Then select "Create" to create the planning profile without a client. Specifying the client is optional.
Now we have two profiles that mirror two modes of working. When we switch to planning mode we only want the tools from our planning profile to be in context. To do that, we can easily reassign our client to the planning profile.
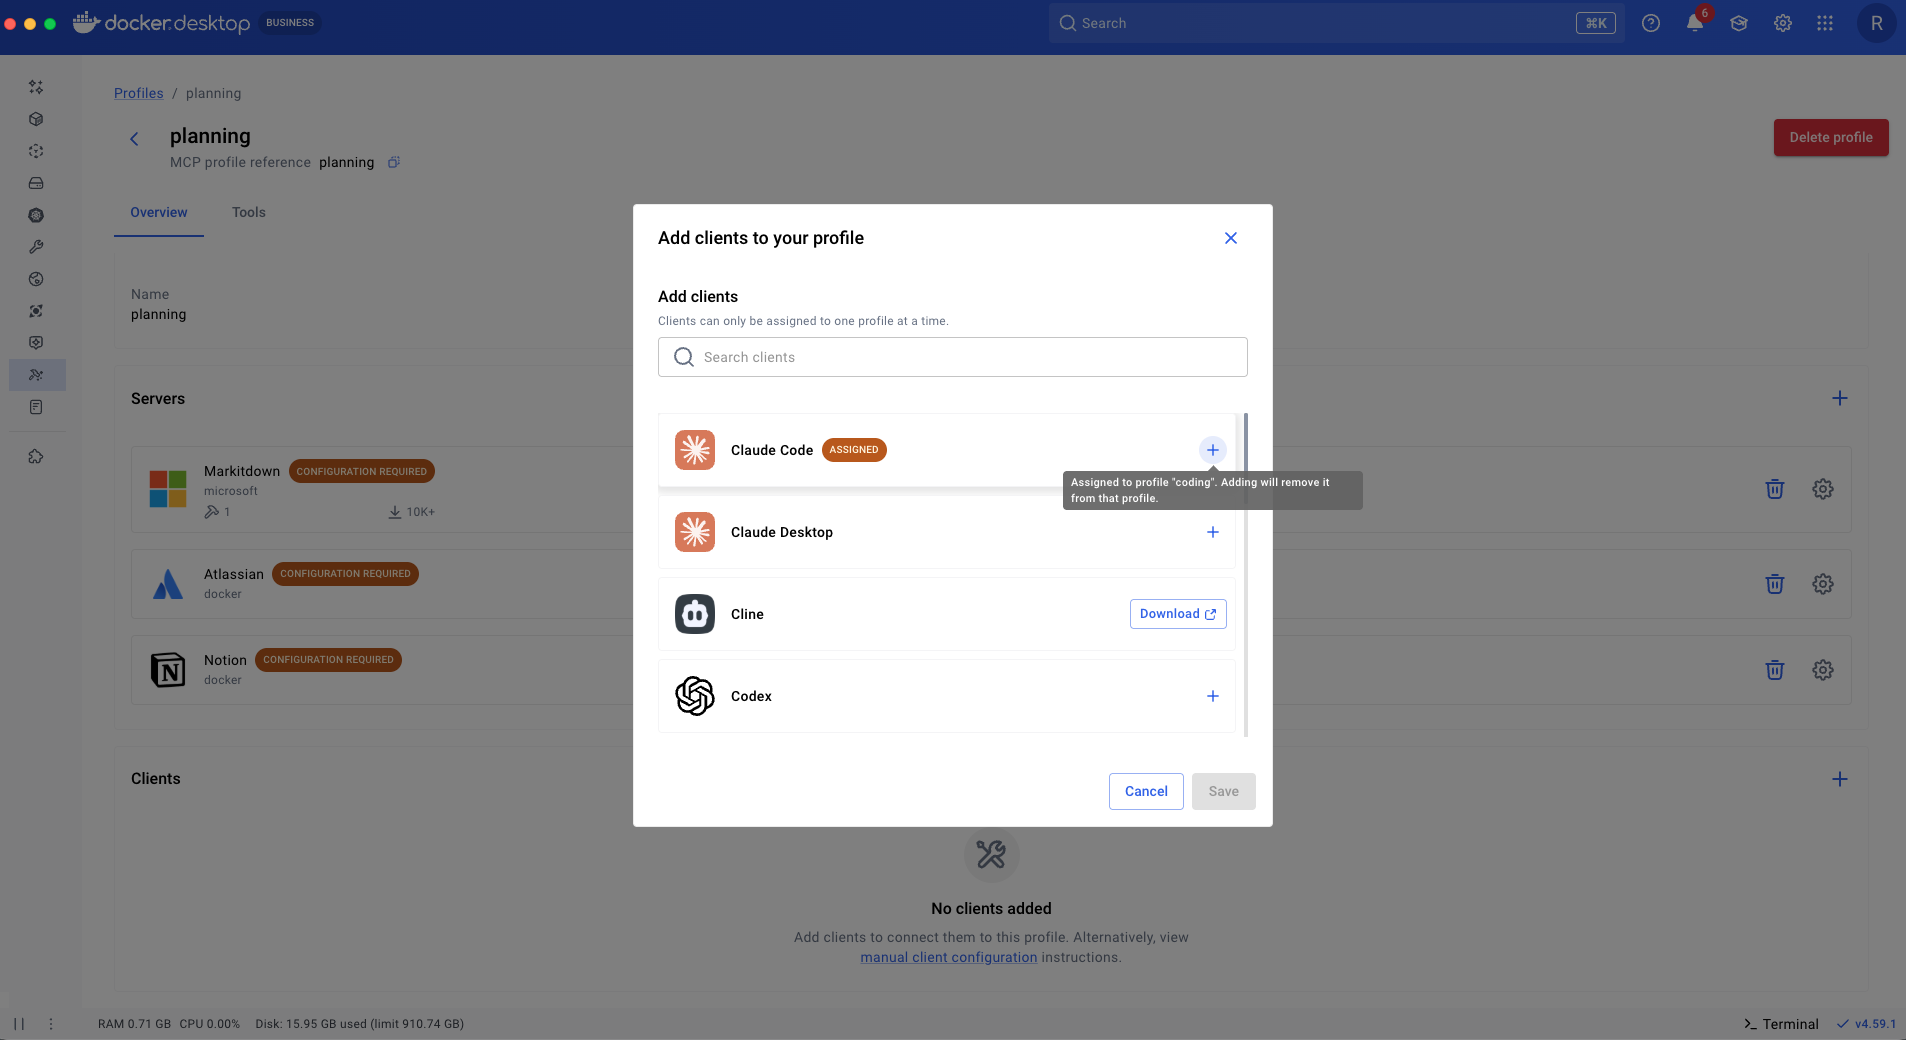
If we go back to coding mode, we just reassign our client back to the coding profile. You can have any number of Profiles that mirror your many ways of working and easily switch between them, keeping only the tools you care about in context.
This will work with any agent, not just Claude Code. Profiles provide a truly portable way to manage your MCP server setups and avoid vendor lock-in.
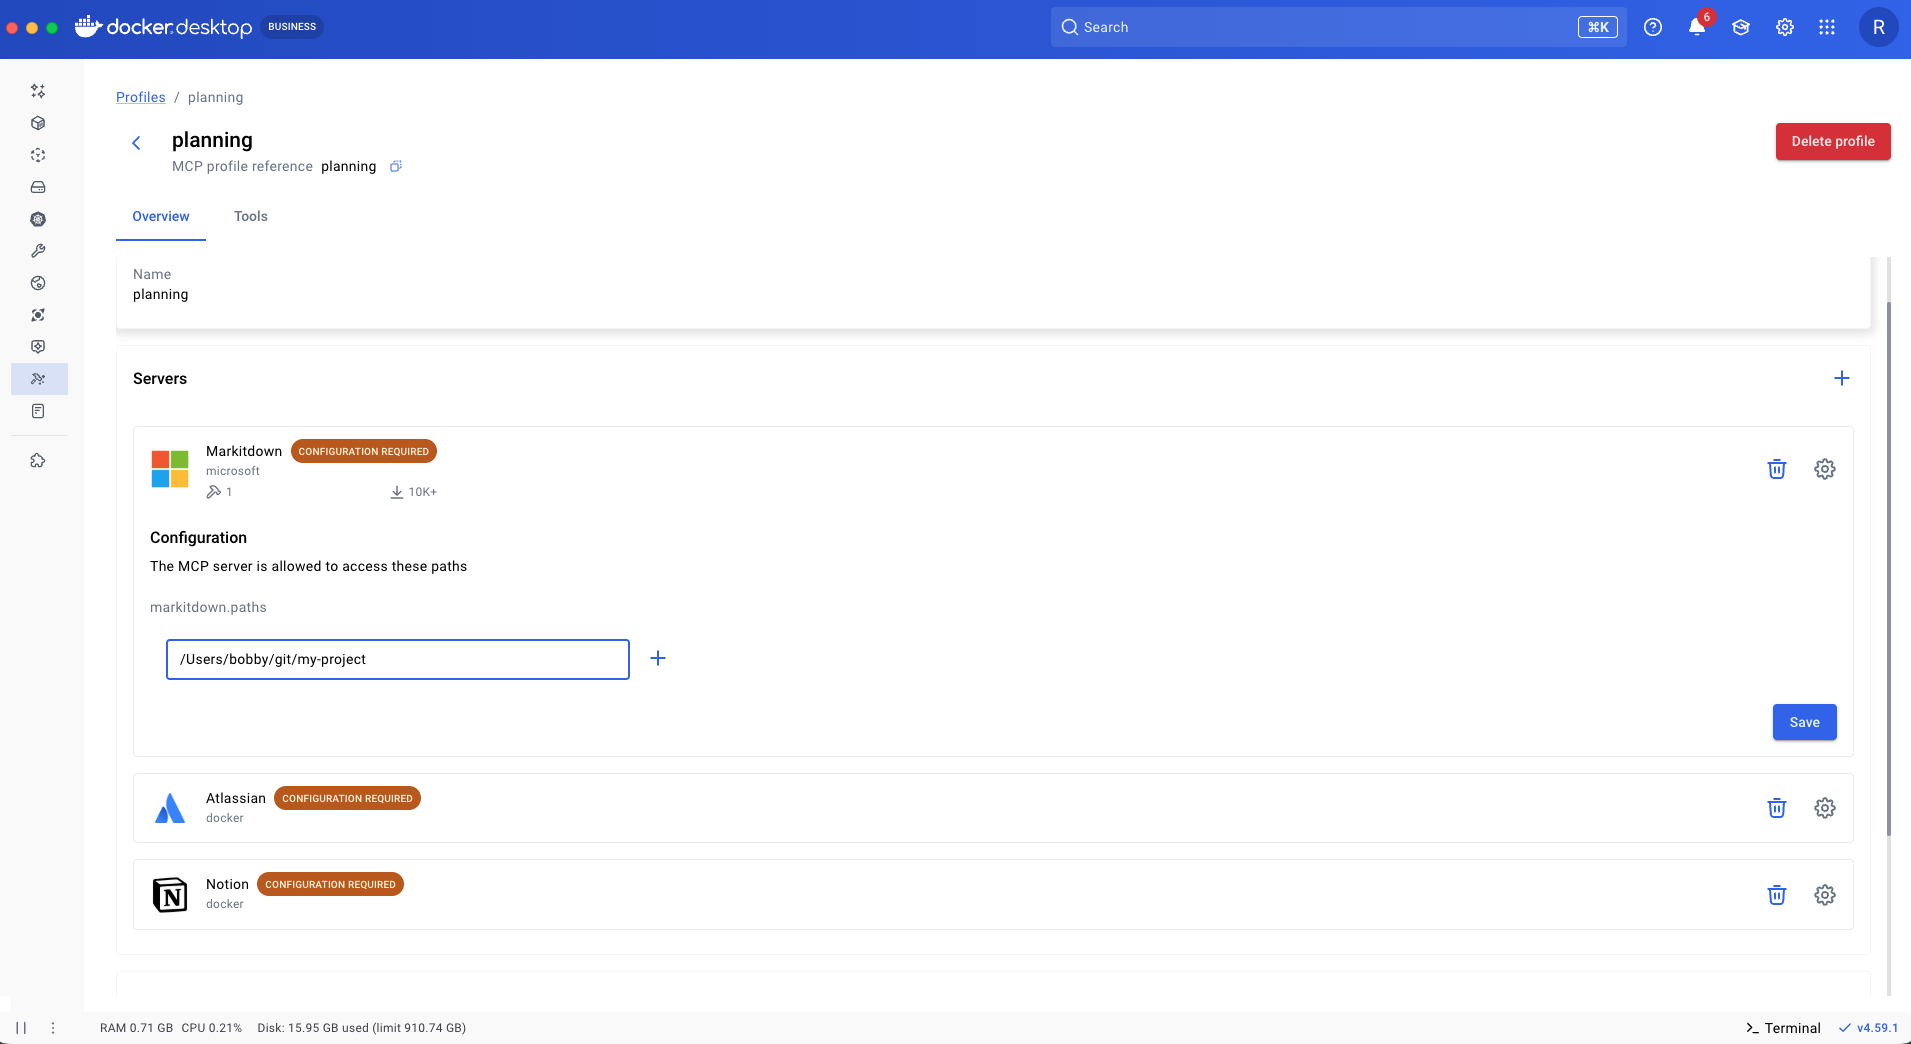
Persist configuration
You can avoid repeatedly configuring MCP servers by using a Profile. Profiles add a persistence layer for MCP server configurations. When an MCP server exposes configurable options, you can define them once in a Profile and reload them as needed, avoiding repeated configuration.
In this example, we are specifying which paths Markitdown can access.
Context windows can easily fill up when the MCP servers you use export a lot of tools. With Profiles you can specify which tools are enabled, making sure only the tools you need for a specific task are used.
Here we enable the get_me tool from the GitHub MCP server and disable all the others. All the other tools will not show up in our agent session or contribute to the context window.
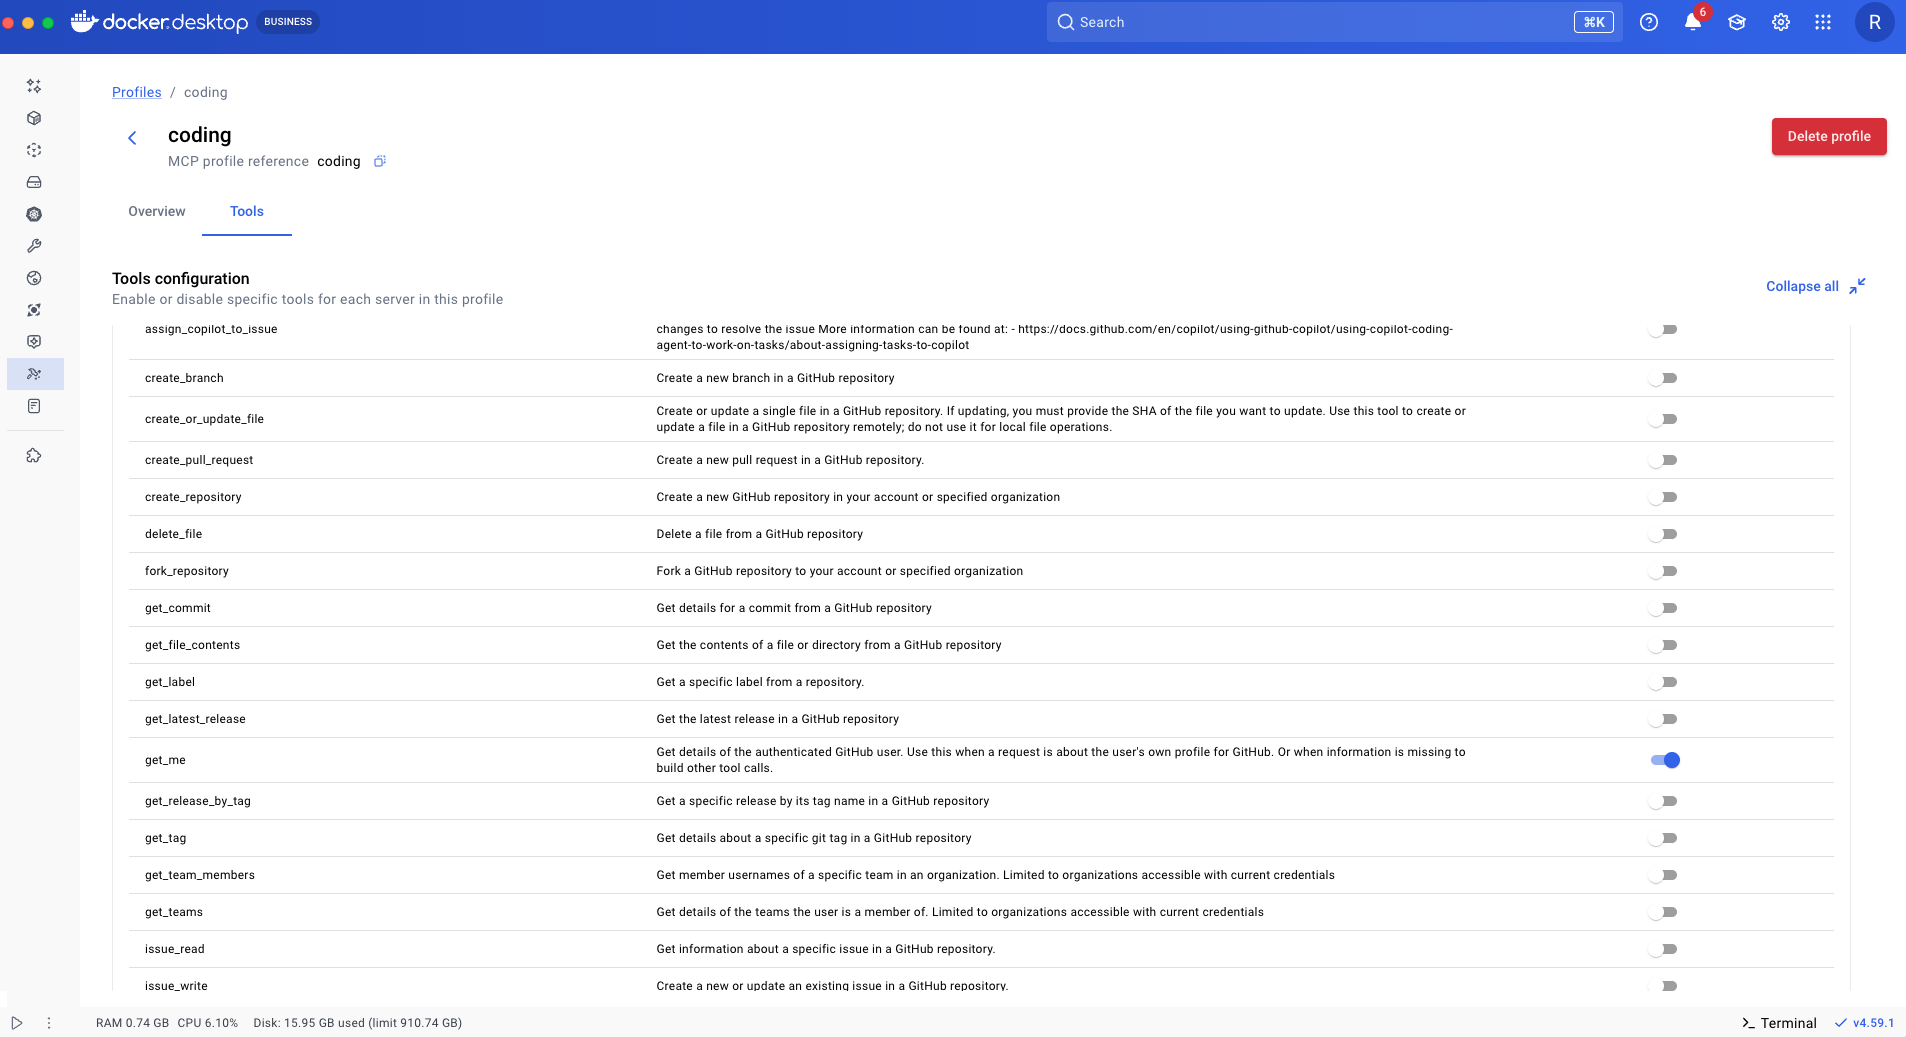
This model of saved configuration becomes far more powerful for MCP servers you build in-house. By exposing richer configuration options, you can reuse the same server across projects, reconfigure its behavior per context, and achieve more predictable outcomes.
Share Profiles
Identifying MCP servers and configurations that work well for a project doesn't need to be repeated by every team member. Once you've found a setup that works, share it with the rest of the team.
To share a Profile you can push it as an OCI artifact to a container registry just like we did with our custom catalog. Just provide a name for it along with an OCI reference.
➜ ~ docker mcp profile push coding [your-namespace]/codingFor someone to pull it down, all they have to do is issue the corresponding pull command.
➜ ~ docker mcp profile pull [your-namspace]/codingAlthough the example above demonstrates sharing Profiles across a team, the concept extends naturally to agents as well. An agent skill could, for instance, reference a Profile and pull in the required MCP servers and their configurations as dependencies.
Conclusion and What's Next
As MCP adoption grows, the challenge isn't access to tools — it's coordination. Teams need a way to standardize what's trusted and supported without constraining how individuals actually work. Custom Catalogs and Profiles are designed to solve exactly that problem.
Custom Catalogs: shared foundation
Custom Catalogs allow platform and admin teams to define approved MCP servers, bundle internal and public tooling together, and distribute those choices as a single, portable artifact. This creates clarity and consistency while significantly reducing the cost of discovery and evaluation.
Profiles: supercharge workflow
Profiles give individual developers a lightweight way to assemble, configure, and reuse MCP servers for specific contexts like coding, planning, or research. Profiles persist configuration, limit context to what matters, and make effective setups easy to share across teams.
Together, these primitives separate:
- What an organization recommends (via Custom Catalogs)
- How people work day to day (via Profiles)
This separation enables a healthy balance. Platform teams can publish "golden paths" that establish standards and guardrails, while developers retain the freedom to adapt, experiment, and compose profiles that fit their needs.
The result is a system that is portable, composable, and scalable — making MCP easier to adopt, safer to manage, and more effective as it grows across an organization.
What's Next?
Custom Catalogs and Profiles are the foundation for managing MCP at scale, and we're just getting started. Next, we're focused on extending these primitives to support stronger governance, better reuse, and more advanced agent workflows:
- Governance and policy controls to restrict MCP usage to approved Custom Catalogs and trusted server sources
- Improved discoverability and sharing for both Catalogs and Profiles, making proven setups easier to find and reuse across teams
- Expanded Profile-scoped secrets and configuration, providing a more secure and flexible alternative to project-level
mcp.jsonfiles - Clear best practices for Profiles, including saving dynamic MCP server configurations for reuse and pairing Profiles with emerging workflow optimizations like agent skills
Getting started with Custom Catalogs and Profiles
If you have Docker Desktop 4.56 you are already using Catalogs – our Docker MCP Catalog is now distributed as an OCI artifact and Profiles are supported starting with Docker Desktop 4.63. Try creating your first Profile by exploring the MCP Toolkit in Docker Desktop.
Learn more
- Dive into our documentation on Custom Catalogs and Profiles to get started quickly.
- Explore Docker's MCP Catalog and Toolkit on our website.
- Ready to go hands-on? Open Docker Desktop or the CLI and start using MCP to streamline and automate your development workflows.
AWS Security Agent now supports full repository code reviews
AWS Security Agent now analyzes entire repositories for architectural vulnerabilities that pattern-matching misses, auto-generating line-specific fixes for free during preview.
Summary
Deep Dive
Decoder
Original Article
Our billing pipeline was suddenly slow. The culprit was a hidden bottleneck in ClickHouse
ClickHouse query planning, not execution, became Cloudflare's billing bottleneck as part count hit 160k per replica despite stable per-query scans.
Summary
Deep Dive
Decoder
Original Article
Our billing pipeline was suddenly slow. The culprit was a hidden bottleneck in ClickHouse
At Cloudflare, we are heavy users of ClickHouse, an open source online analytical processing (OLAP) database. Every day, we make millions of calls to ClickHouse to determine how much users should be billed for their usage of Cloudflare products. If we don't finish those jobs in a timely fashion, the invoices become very difficult to reconcile.
This pipeline powers hundreds of millions of dollars in usage revenue, fraud systems, and more, so being delayed has major downstream implications.
Which is why it was a big problem when the daily aggregation jobs in ClickHouse – responsible for ensuring Cloudflare's bills go out – had slowed way down, following a migration. All the usual suspects looked clean: I/O, memory, rows scanned, parts read. Everything we would normally check when a ClickHouse query is slow appeared to be normal.
This is the story of how we discovered a hidden bottleneck buried deep within ClickHouse's internals, and the three patches we wrote to fix it.
The setup: a petabyte-scale analytics platform
We use ClickHouse to store over a hundred petabytes of data across a few dozen clusters. To simplify onboarding for our many internal teams, we built a system called "Ready-Analytics" in early 2022.
The premise is simple: instead of designing new tables, teams can stream data into a single, massive table. Datasets are disambiguated by a namespace, and each record uses a standard schema (e.g., 20 float fields, 20 string fields, a timestamp, and an indexID).
In ClickHouse, the way data is sorted is crucial to query performance. This is where the indexID comes into play. It's a string field, which forms part of the primary key, meaning that every individual namespace can have its data sorted in a way that is optimal for the queries the owners of that namespace expect to be running. Altogether, we end up with a primary key that looks like this: (namespace, indexID, timestamp).
This system is popular, with hundreds of applications using it. It had already grown to more than 2PiB of data by December 2024, and an ingestion rate of millions of rows per second. But it had one critical flaw: its retention policy.
The problem: one retention policy to rule them all
Cloudflare has been using ClickHouse for many years, since before it had native Time-to-Live (TTL) features. Consequently, we built our own retention system based on partitioning. The Ready-Analytics table was partitioned by day, and our retention job simply dropped partitions older than 31 days.
This "one-size-fits-all" 31-day retention was a major limitation. Some teams needed to store data for years due to legal or contractual obligations, while others needed only a few days. This restriction meant these use cases couldn't use Ready-Analytics and had to opt for a conventional setup, which has a far more complex onboarding process.
We needed a new system that allowed per-namespace retention.
The solution: a new partitioning scheme
We considered two main approaches:
- A Table-per-Namespace: This would naturally solve the retention problem but would require significant new automation to manage thousands of tables on demand.
- A New Partitioning Key: We could change the partitioning key from just
(day)to(namespace, day).
We chose the second option. This would allow our existing retention system to continue managing partitions, but now with per-namespace granularity.
We knew this would increase the total number of data parts in the table, but we made a key assumption: since every query is filtered by a specific namespace, the number of parts read by any single query shouldn't change. We believed this meant performance would be unaffected.

This shows how we changed the partitioning, allowing us to cheaply drop data for a single namespace
This new system also allowed us to build a sophisticated storage management layer. Using the max-min fairness algorithm, we could set a target disk utilization (e.g., 90%) and automatically "share" available space. Namespaces using less than their fair share would cede their unused capacity to those that needed more. This allowed us to confidently run our clusters at 90% utilization.
We began the migration in January 2025. Using ClickHouse's Merge table feature, we combined the old and new tables, writing all new data to the new partitioned table while the old data aged out.
The mystery: when billing starts to break
Two months later, in late March 2025, our billing team reported that their daily aggregation jobs were slowing down. These jobs are time-critical; if they don't finish, bills don't go out. The jobs were getting progressively slower, and we were approaching a deadline.
We investigated, but none of the usual suspects were to blame. I/O was fine. Memory was fine. The metrics for individual queries showed they were not reading more data or more parts than before. Our initial assumption seemed correct, yet the system was grinding to a halt.
It took several days before we even had a theory. Finally, we made a plot of query duration against the total part count in the cluster. The correlation was undeniable.

Average SELECT Query Durations on the Ready Analytics ClickHouse Cluster, showing progressive performance degradation.

Linear Growth in Total Data Part Count per Table Replica, following the new (namespace, day) partitioning scheme.
But why? If we weren't reading the extra parts, why did their mere existence slow us down?
The investigation: hunting bottlenecks with flame graphs
We turned to ClickHouse's built-in trace_log to generate flame graphs. This is a built-in table that records traces from the running ClickHouse server. It not only includes traces of what code is being executed, but it associates these with specific users, query IDs and other metadata, meaning you can filter down to quite precise sets of events if necessary. In our case, we wanted to look specifically at leaf SELECT queries. This was easy thanks to the available metadata in this table.
The first CPU-based flame graph quickly confirmed our suspicion: a huge amount of time was being spent in query planning. This is the phase before execution when ClickHouse decides which parts to read.
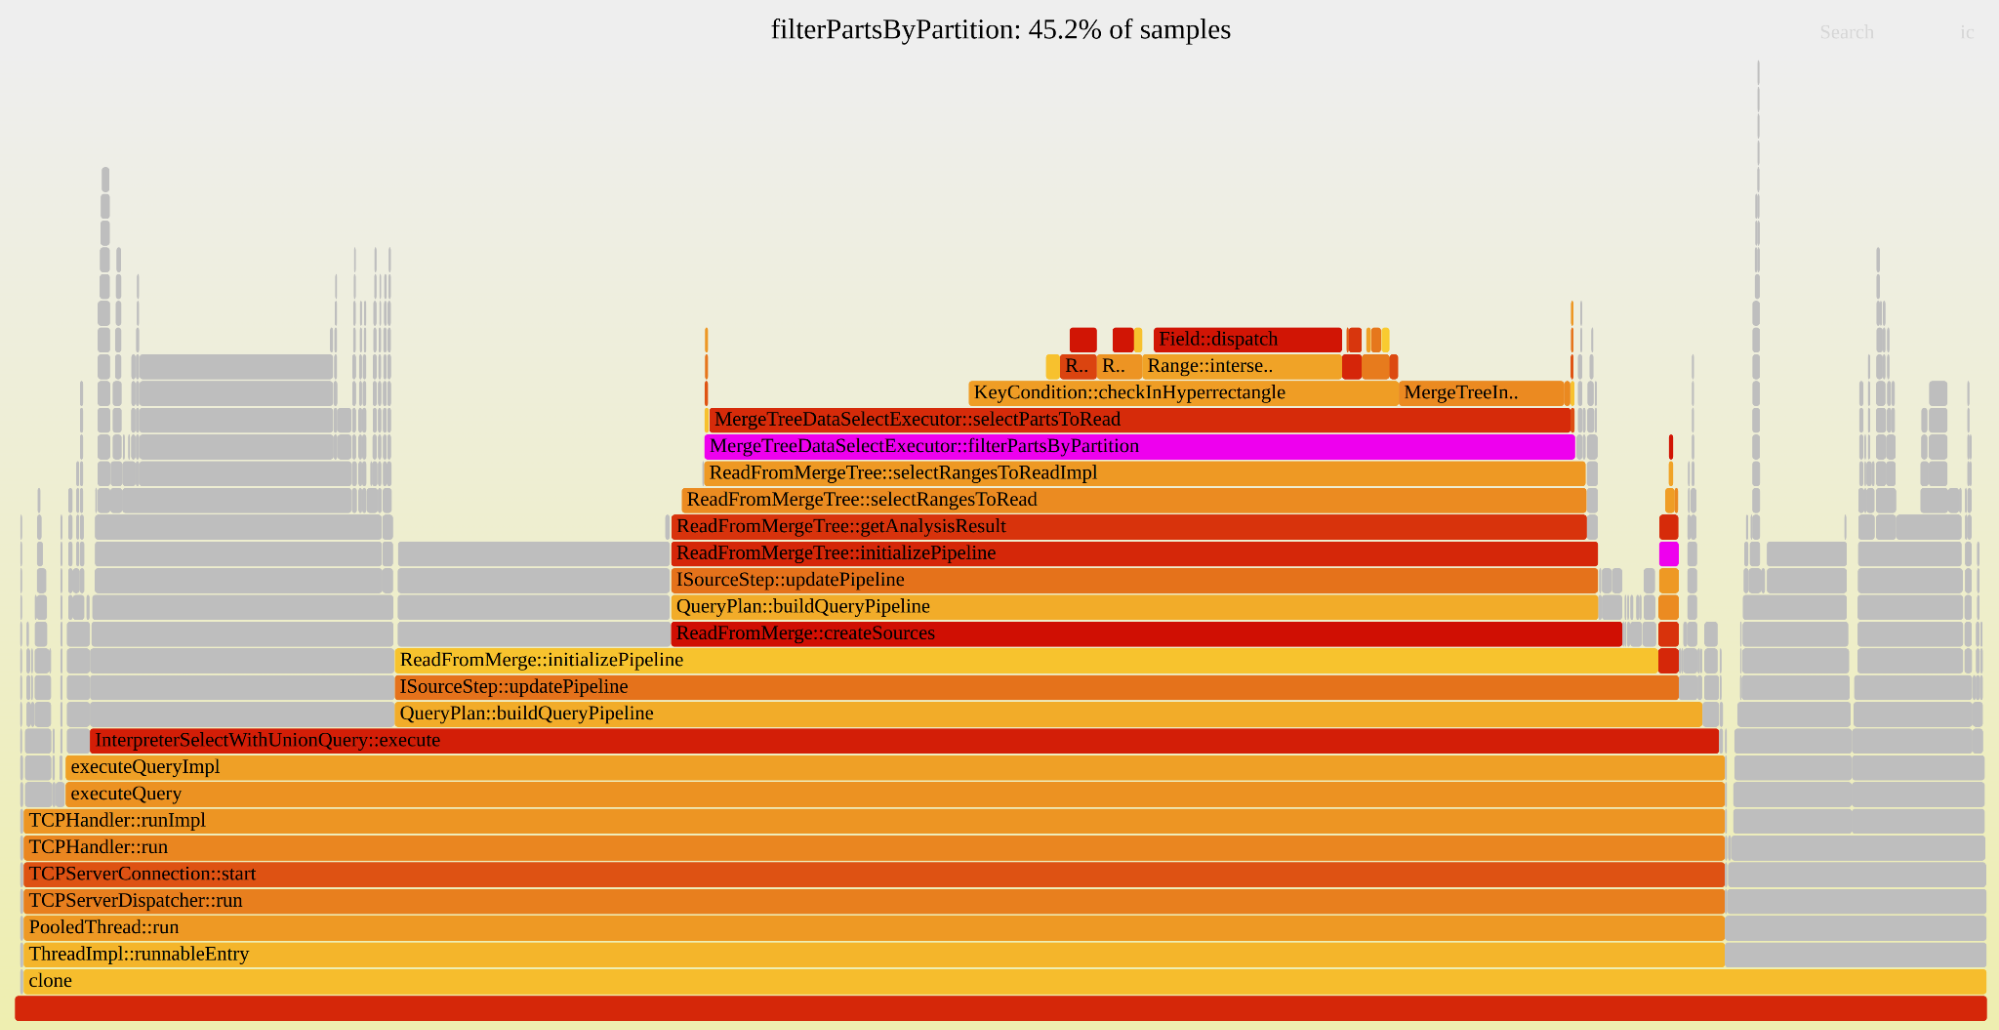
Flame graph showing that 45% of leaf query CPU time is spent filtering a vector of parts based on the partition ID
The flame graph was clear: 45% of the sampled CPU time was being spent in a single function called filterPartsByPartition.
Our first attempt at a fix was a small patch to this exact code path. The planner evaluates heuristics to prune parts, and we believed they weren't being evaluated in the optimal order for our table. Our patch changed the order, yielding a small 5% improvement. We were on the right path, but we'd missed the real problem.
We had been generating "CPU" traces, which only sample active threads. We switched to "Real" traces, which sample all threads, including those that are inactive or waiting. The new flame graph was a revelation.

Flame graph showing that more than half of leaf query duration is spent waiting for a mutex that protects the list of active parts
The problem wasn't CPU-bound work; it was massive lock contention. More than half of our query duration was spent waiting to acquire a single mutex (MergeTreeData) that protects the table's list of parts. To plan a query, every single thread had to:
- Acquire an exclusive lock on this mutex.
- Make a complete copy of the list of all parts in the table.
- Release the lock.
- Filter that list down to the relevant parts.
With tens of thousands of parts and hundreds of concurrent queries, they were all just standing in a single-file line.
The fixes: a trio of patches
This insight helped us plan a series of optimizations to alleviate these hotspots. As with all the patches we make to ClickHouse, we try to make them generic, and eventually get them contributed to the upstream codebase. This makes it easier for us to maintain our fork, and means the community benefits from the changes we make too!
Optimization 1: use a shared lock
The query planner doesn't modify the parts list; it just reads it. It had no business using an exclusive lock.
The Fix: We modified the code to acquire a shared lock (std::shared_lock) instead. This allowed all query planners to enter the critical section concurrently.
The Result: A massive, immediate drop in query duration. The lock contention vanished.

Immediate Impact of the Shared Lock Optimization (Optimization 1) on Average SELECT Query Durations, demonstrating the resolution of lock contention.
Optimization 2: stop copying the vector
Performance was significantly better, but still not back to baseline. We went back to the trace log and made another 'Real' flame graph.

Flame graph showing that we spend a quarter of leaf query duration copying the vector of all parts, and another quarter filtering through it (copying again).
The new flame graph showed the bottleneck had simply moved. Now, time was being spent copying the giant vector of parts, even with the shared lock. Intuitively, copying a vector sounds cheap, but when it contains tens of thousands of elements, and you do it hundreds of times a second, it adds up.
The Fix: We deferred the copy entirely. We created a "shared copy" of the parts list. Read-only operations (like query planning) just read from this copy. Any operation that modifies the set of parts (like a new insert) regenerates the cache. Planners now only copy the filtered list of parts they actually need.
The Result: Another significant performance improvement.

Further Performance Improvement After Rolling Out the Vector Copy Optimization (Optimization 2).
After seeing these massive savings internally, we decided to bring these changes to the community. After some small design iterations with the maintainers at ClickHouse Inc., we got the changes merged under PR #85535. They have been available since ClickHouse version 25.11.
Optimization 3: binary search for parts
We're still not done. As part counts grow, performance still degrades, just much more slowly. The correlation with part count was still there. Coming back to this after a few months, a new flame graph (looking the same as Figure 3) shows the time is spent in the filtering code path (the one we tried to fix first). This code performs a linear scan over all parts, evaluating predicates against each one. Over a few months, we were back to select durations from before the optimizations.
But we know this list of parts is sorted by the partitioning key. Remember that the first column of the partition key is namespace, which the vast majority of queries filter on, because it identifies the "tenant." How can we make use of this?
The Fix: We implemented a binary search based on the namespace part of the partition ID. This works because the vector is sorted, so you can filter out a lot of the entries without actually looking at them. This is particularly effective since the namespace is the first part of that sorting key. After this first-pass of binary search, we have a much smaller range of parts we need to examine, and for those we still step through each one, applying the same logic as before to exclude parts based on other conditions.
The Result: After deploying this patch in March 2026, query durations dropped by 50% (see Figure 8). More importantly, this finally breaks correlation of query durations with the number of parts. Unfortunately, this solution doesn't generalize that well for arbitrary query conditions (e.g. conditions such as namespace in (5,10)). We are looking into more generic approaches like extending the query condition cache to cover part filtering.
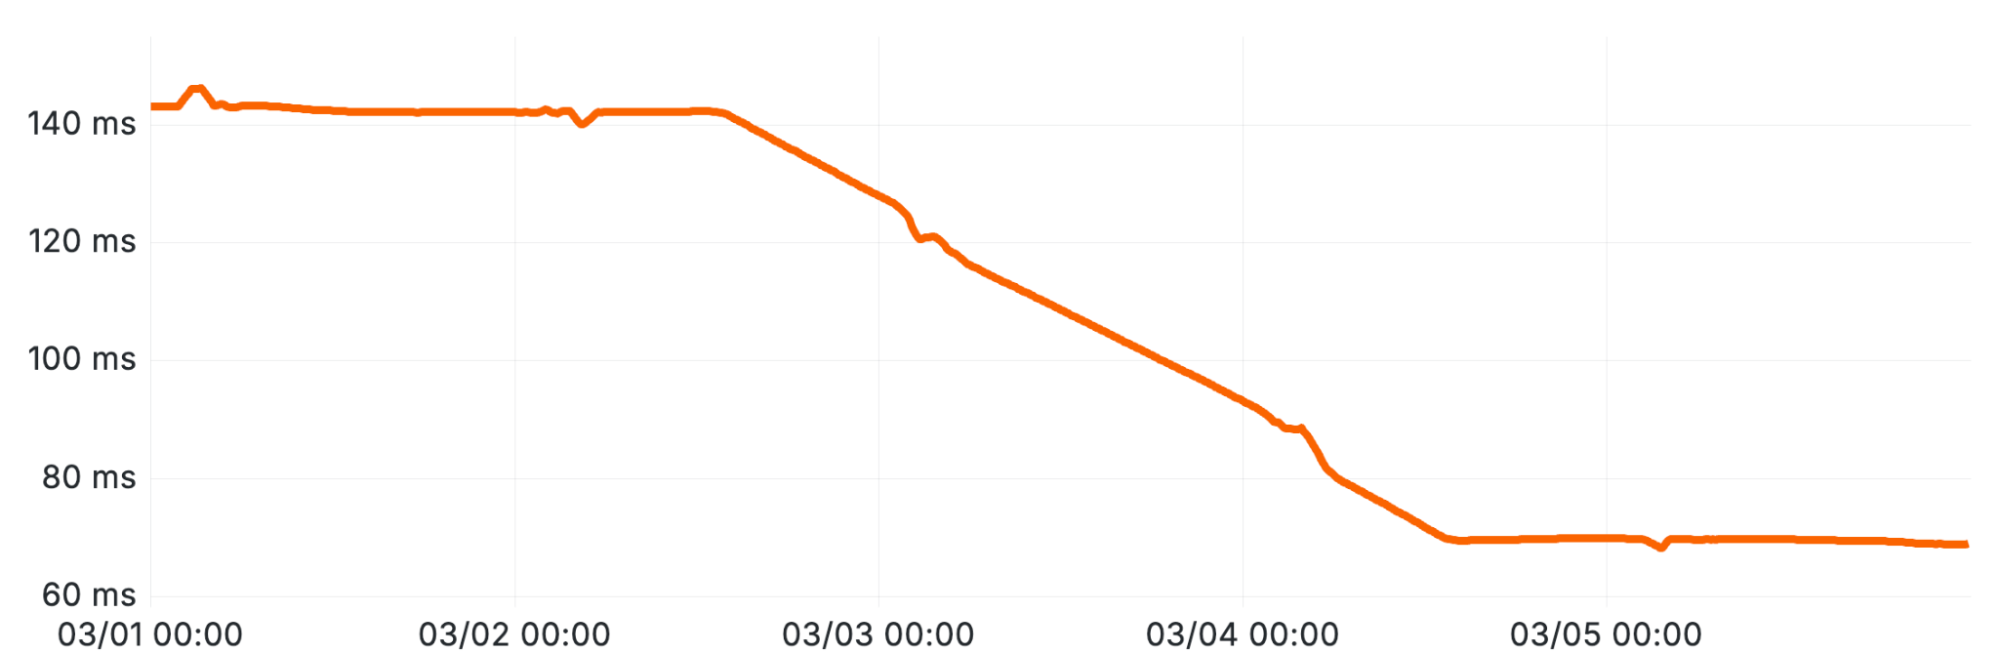
Sustained Latency Reduction Following the Implementation of Binary Search for Part Pruning (Optimization 3).
An uneasy truce
These optimizations resolved the immediate crisis with the billing system. But this journey exposed the deep, non-obvious costs of our partitioning choice.
Other problems remain. In this blog post we've only described the problems increasing part counts had on our select durations, but it has also caused problems for ZooKeeper, which tracks metadata for all the parts in ClickHouse. Perhaps one day we'll tell the story of the 100 gigabyte ZooKeeper cluster.
We've bought ourselves significant breathing room, but the fundamental question remains: Was this partitioning scheme the right long-term choice? Or will we eventually need to bite the bullet and move to a different architecture? For now, our patches are holding, but the experience was a clear example of how even a well-planned change can fall victim to incorrect assumptions.
When the billing team first reported this problem we had 30,000 parts per replica. The part rate never stopped growing, and a year later we hit 160k parts per replica, but query durations have been stable thanks to the optimizations we made here.
AWS Outage May 2026: Lessons for Database Disaster Recovery
A 20-hour data center overheating event in AWS US-EAST-1 on May 7-8 took down Coinbase, FanDuel, and CME, proving Multi-AZ can't protect single-zone latency-optimized workloads from physical failures.
Summary
Deep Dive
Decoder
Original Article
Viaduct 1.0 and the Future of Airbnb's Data Mesh
Airbnb open-sourced Viaduct 1.0, a GraphQL-based data mesh that uses multi-tenant modules to avoid the operational complexity of federation.
Summary
Deep Dive
Decoder
Original Article
The Modern Data Stack is Overcomplicated: Data Ingestion
Solo data engineers should use managed connectors despite high costs - time saved from building pipelines can drive 2-5x revenue growth.
Summary
Deep Dive
Original Article
Welcome to ORDER BY Jungle
Adding a minus sign to ORDER BY switches PostgreSQL's parser from SQL-92 rules checking SELECT aliases first to SQL-99 checking FROM first.
Summary
Deep Dive
Decoder
Original Article
Exploring schema evolution with ontology-driven propagation
dltHub replaces brittle column allowlists with plain-English ontologies where Claude classifies each new column by sampling values, catching phone_number but passing UUID fields automatically.
Summary
Deep Dive
Decoder
Original Article
INTRO
Schema evolution is the part of data engineering that looks rudimentary until it isn't. A developer adds a column. Your analytics view doesn't know about it. If the new column contains PII, you've silently expanded your exposure surface. Either way, someone has to notice and fix it manually.
The design: describe the access policy in plain language, encode it as a natural-language ontology, and use that ontology as the runtime policy applied column by column. Code produces what only code can easily produce - row counts, cardinality ratios, value samples. The LLM reads the ontology and applies it to those measurements. The ontology is the source of truth for both behavior and audit. Edit it in English; and the next rebuild adapts.
The ontology encodes the policy in plain English
Four steps:
- Write a prompt: describe the access policy in plain English
- Generate an ontology: pass the prompt to an LLM to encode the policy as structured rules
- Apply the policy at runtime: for each column, an LLM reads the ontology and decides based on the column's name, dtype, cardinality, and a sample of values
- Analytics-safe data: only columns that pass reach the output

Step 1 - prompt:
I'm building a DuckDB analytics view over a fintech dataset. The schema evolves at any time — new columns can arrive without warning. I need an ontology that encodes the access policy as plain-English subject — predicate — object triples. No CamelCase, no identifier syntax — write it the way you'd write rules for a colleague who hasn't seen the codebase. Group claims under a shared subject with bullets when the subject repeats. Collapse parallel claims into a single list when the same predicate applies to several subjects. Keep the file short and scannable.

The ontology will be applied two ways: a deterministic interpreter handles crisp cases (name patterns, dtypes, cardinality), and an LLM handles ambiguous cases by sampling values. Write rules that work for both readers.

Keep it concise, essential rules only, no exhaustive type enumerations.

Define:
- The view's goal: expose analytics-safe columns, exclude PII and high-cardinality text unless the content is verifiably non-personal, adapt automatically on schema change
- Which column classes pass and which are rejected
- PII fragments — representative examples across name, contact, financial, and identity categories
- A cardinality threshold of 3% (a text column is high-cardinality if more than 3 in 100 values are unique)
- A runtime escalation rule: for high-cardinality text whose name doesn't match a PII fragment, inspect a sample of values; pass if values are identifiers, codes, or non-personal descriptions; reject if values contain personal information
- That new columns are evaluated automatically by the same rules with no code change needed
The ontology it produced:
The view:
- exposes analytics-safe columns
- excludes PII columns
- excludes high-cardinality text columns unless their values are verifiably non-personal
- adapts automatically when the schema changes

Columns that pass: numeric, boolean, date, low-cardinality text.
Columns that are rejected: PII, high-cardinality text containing personal information.

A column is PII if its name contains a fragment like:
- name, full_name, first_name, last_name, username
- email, email_address, phone, phone_number, mobile, address, city, zip, postal_code
- card_number, iban, account_number, routing_number, cvv, pan
- ssn, passport, national_id, tax_id, dob, date_of_birth, ip_address, device_id

A text column is high-cardinality if more than 3% of its values are unique.

For high-cardinality text columns whose name does not match a PII fragment:
- inspect a sample of values
- the column passes if its values are identifiers, codes, machine-generated strings, or non-personal descriptions
- the column is rejected if its values contain personal information: names, contact details, financial identifiers, free-form text describing individuals, or anything resembling the PII categories above

New columns:
- are evaluated by the same rules
- require no code change to be classified
- inherit the policy of their column class
Two layers - what things are (taxonomy) and what to do with them (relationships). The taxonomy defines what makes a column PII, what name fragments flag it, what threshold marks text as high-cardinality. The relationships sit on top: what the view exposes, what it excludes, when to escalate to value inspection. Together, that's the ontology. Readable by a human auditor and by an LLM making runtime decisions.
The policy holds when the schema changes
I added the ontology to Claude Code, which already had the pipeline scripts in context, and asked it to write the view logic. The full setup is documented in the notebook.
The code:
import json
import anthropic

client = anthropic.Anthropic(api_key=api_key.value)
MODEL = "claude-sonnet-4-6"

def llm_decide(name, dtype, cardinality, sample):
    # Retry loop for model stability
    for _ in range(3):
        try:
            response = client.messages.create(
                model=MODEL,
                max_tokens=200,
                system=(
                    f"You enforce this data access policy:\n\n{ontology_text}\n\n"
                    "Decide if a column is analytics-safe. Reply with JSON only, no markdown: "
                    '{"decision": "pass" or "reject", "reason": "<one sentence>"}'
                ),
                messages=[{
                    "role": "user",
                    "content": (
                        f"Column name: {name}\n"
                        f"Dtype: {dtype}\n"
                        f"Cardinality ratio: {cardinality:.1%}\n"
                        f"Sample values: {sample}"
                    ),
                }],
            )
            out = json.loads(response.content[0].text)

            # Ensure the model sticks to the allowed ontology decisions
            if out.get("decision") in ["pass", "reject"]:
                return out["decision"], out["reason"]
        except:
            print(f"  Retrying {name} due to invalid LLM output...")
            continue

    # Fail-closed posture for safety
    return "reject", "classification_failed_after_retries"

def build_safe_view(pipeline_name: str, raw_table: str, safe_view: str):
    con = dlt.attach(pipeline_name).dataset().ibis()
    tbl = con.table(raw_table)
    total = tbl.count().execute()

    safe_columns = []
    for col_name, dtype in zip(tbl.schema().names, tbl.schema().types):
        if col_name.startswith("_dlt_") or col_name == "_id":
            continue
        cardinality = tbl[col_name].nunique().execute() / total
        sample = tbl.select(col_name).limit(20).execute()[col_name].tolist()
        decision, reason = llm_decide(col_name, dtype, cardinality, sample)
        marker = "✓ PASS  " if decision == "pass" else "✗ REJECT"
        print(f"  {marker}  {col_name}  ← {reason}")
        if decision == "pass":
            safe_columns.append(col_name)

    con.create_view(safe_view, tbl.select(safe_columns), overwrite=True)
    print(f"\nVIEW '{safe_view}' created — {len(safe_columns)} columns: {', '.join(safe_columns)}")
Two runs: 5 columns first, then 5 more. The question was whether the policy would handle new columns without code changes - including the case where column names don't tell the full story.

It held. Numeric columns passed, PII fragments were rejected. The case that shows why the LLM is doing the evaluation: user_ref clears the name-fragment check and shows 100% cardinality - it even sounds like it could reference a person. Pure cardinality-based rejection would discard it. The LLM sampled the values, saw UUIDs, and passed it as non-personal.
Run 1: pipeline loaded, view built from policy:
| Column | Result | Reason (as inferred) |
|---|---|---|
| id | ✓ Pass | Numeric surrogate key with no personal information |
| transaction_volume_30d | ✓ Pass | Numeric — transaction count aggregates with no PII characteristics |
| kyc_status | ✓ Pass | Low-cardinality text — non-personal status values (expired, verified, failed, pending) |
| full_name | ✗ Reject | PII — name fragment confirmed by sample values |
| ✗ Reject | PII — email fragment, values are personal email addresses |
Run 2: same policy, 5 new columns:
Four resolved immediately from name and dtype. One required value inspection.
| Column | Result | Reason (as inferred) |
|---|---|---|
| fraud_risk_score | ✓ Pass | Numeric — machine-generated risk scores with no PII characteristics |
| outstanding_balance_usd | ✓ Pass | Numeric — aggregate balance amounts, not a PII identifier |
| risk_tier | ✓ Pass | Low-cardinality text — non-personal risk tier labels (low, medium, high, critical) |
| user_ref | ✓ Pass | High-cardinality text — all sampled values are machine-generated UUIDs, non-personal |
| phone_number | ✗ Reject | PII — phone fragment confirmed by sample values |
v1 columns unchanged → 3 pass, 2 rejected as before. Cumulative: 7 pass | 3 rejected.
phone_number caught by the fragment rule immediately.
user_ref went to the LLM: 100% cardinality, no PII keyword - values resolved it. No view code changes between runs.
What the ontology actually bought
The policy is the contract, not the column list. A SELECT allowlist tells you what's currently safe. An ontology tells you why it's safe. That distinction matters when the schema changes: the ontology stays valid, the allowlist goes stale.
The code produces row counts, cardinality ratios, value samples - things code can produce easily. The LLM reads the natural-language ontology and applies it to those measurements per column. Neither is doing the other's job.
Changing the policy is a one-line edit. Add driver_license to the PII fragment list. The next run catches it. This calls the LLM per column per rebuild. That's fine for view-build cadence - you're not running it per request, and it's batchable in production. The example runs with Claude Sonnet 4.6 via the Anthropic API - swap in any model that supports JSON output. Log the decisions and the reasons. The audit trail is in the model's output; persist it. Fix the sampling to be random rather than limit(20) if row order in your table is non-random.
The limits worth knowing
This works for what it claims to work for. It doesn't solve everything.
Name-fragment matching catches PII by column name. A non-PII-looking name clears that check - value inspection covers the high-cardinality text case, but a numeric column encoding a sensitive inference (a risk score, a derived identifier) passes regardless: the ontology treats numeric as safe. The cardinality rule catches high-entropy strings, but a small-vocabulary column could still contain sensitive values. Cross-column re-identification isn't addressed at all.
When to use this
If your policy decomposes to pure pattern matches and counts - substring on names, dtype allowlist, a threshold - skip the LLM and run the same ontology through a small deterministic interpreter. We didn't, because high-cardinality text is the case where names lie and only inspecting the values resolves it. Pick the executor that matches your policy's edge.
The ontology tells you what safety means. A column list tells you what's currently safe. One expires when the schema changes, the other doesn't. Because the policy is separate from the code, improving it doesn't touch the pipeline.
What Matters in Production RAG
RAG tutorials produce working demos, but production systems serve stale content and wrong answers without document registries or chunk-level tracing.
Summary
Deep Dive
Decoder
Original Article
MinIO's MemKV promises 95% better GPU utilization by ending AI recompute tax
MinIO's MemKV moves context from NVMe over 800GbE RDMA to GPUs, claiming 95% better utilization by eliminating recompute tax
Summary
Deep Dive
Decoder
Original Article
Context pruning: cut LLM tokens without losing quality
LLMs degrade with longer context windows, but selective token pruning achieves 20x compression while often improving output quality and cutting costs 73%.
Summary
Deep Dive
Decoder
Original Article
Your AI agent deletes critical data: Who is responsible?
A Replit agent deleted a live production database during a code freeze, and 88% of organizations cannot roll back agent actions without system disruption.
Summary
Deep Dive
Decoder
Original Article
Figma Stock Jumps as First-quarter Revenue Surges 46% on AI Monetization Traction
Figma validated AI monetization: 75% of enterprise users continued paying after hitting AI credit limits, driving 46% revenue growth to $333M.
Summary
Deep Dive
Decoder
Original Article
Lovable's AI Built a 100% Accessible Site – Or Did It?
A conference site built with Lovable scored 100% on Axe accessibility tests but failed screen reader testing with focus traps and mismatched labels.
Summary
Deep Dive
Decoder
Original Article
Lovable's AI built a 100% accessible site – or did it?
We wanted to get an indication of how accessible AI-built sites are at the moment. So I let my colleague Daniel try out a site built with Lovable, using the screen reader on his iPhone. And we recorded it all so you can come along for the ride!

Background about the site
First off: the way the site was built was pretty mind blowing to me.
A friend of mine, an AI-enthusiast, built it only using his smartphone during bus rides to and from work. The fact that you can now build a functional, high-fidelity site into existence while commuting is pretty cool. And you could argue that this is a form of accessibility, making it possible for many more people to build sites and apps.
But yeah, in brief, the site was for a dev conference. It included information about speakers, dates, venue and that sort of stuff. It also included a way secure your tickets and pay for them. So not a super complex site, but still not just a basic one-way info site.
It was built with Lovable and has some third party integrations, for instance in the checkout flow. Accessibility had been prompted to be a priority, but no more detailed requirements regarding that was given.
On paper the site was perfect. It got a 100% accessibility score in Lovable's Speed tool, that runs Axe. By the way: great to see that Lovable has an accessibility tool like this built in!
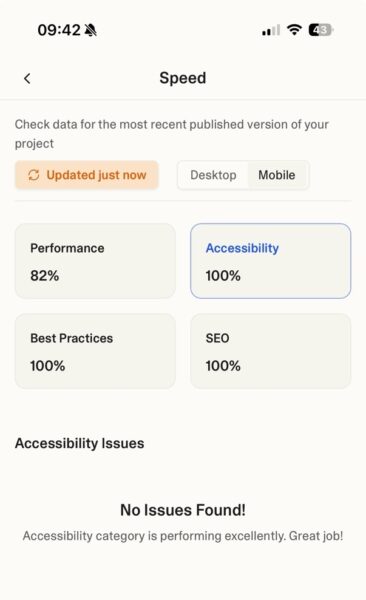
But how did it work in real life, for an actual assistive tech user? I'll give a hint: it wasn't 100%…
The issues
Getting stuck behind components
Let's look at some of the issues, and I'll begin with the most critical ones.
One of the most frustrating experiences for a screen reader user is when the visual layer and the code layer lose sync. When the menu was open, the screen reader kept reading content underneath it.
Check out the video if you can, but I'll summarise it (and others videos later on) after the clip if you for some reason can't want to watch it.
Basically, the video shows the menu being open, but the screen reader focusing on some object behind the meny. Which obviously causes confusion:
I thought I was in the menu, but it announced the thing I read before from the start page… probably underneath the menu, right? So that was weird!
This "ghosting" effect happened again with the ticket modal.
Here Daniel initally uses swipe navigation, where swiping right moves to the next item. It's a common way of navigating when you're in new interfaces, or for less tech savvy users. Using swipe navigation, he gets stuck behind the modal.
However, he manages to force focus into the modal when he switches to navigating by touch. Basically dragging his finger across the screen and having what's underneath his finger read to him.
Far from everyone will figure out that they need to switch ways of navigating, and like Daniel mentions at the end, some users will have keyboards or braille displays connected and not use navigation by touch at all.
Hush! Stop screaming!
Automated security features together with a strange hidden region also caused a bit of chaos. This was the experience every time a new page opened:
So here we had two issues.
One was that there was a strange, hidden region at the top of the page saying "Notification alt+t".
However, the most frustrating one was that the screen reader began automatically announcing "Cloudflare integrity" and "Verify if you are a human" repeatedly.
For a user trying to get an overview of a site, having a security bot interrupt your flow is the digital equivalent of a megaphone going off in a library.
This is a great example of the issues you can run into if you follow guidelines, but don't test for the actual experience. The Cloudflare component does update its content, and then having it in a live-region is the general rule of thumb. However, in this specific case it hurts the screen reader experience tremendously, as you probably noted in the video.
Lost in the single-page application (SPA)
Because the site was built as an SPA, "navigating" to a new page didn't actually trigger a traditional page load. When that's the case, focus needs to be controlled so it lands in the proper place when new pages load. However, on this site, screen reader focus wasn't handled well:
Focus was never managed… my screen reader tried to figure out what happened there so it put focus in that visual area where I pressed the link.
The result? Daniel landed on a heading halfway down the page, missing all the content above it.
When "Toggle Menu" tells you nothing
The first thing Daniel reacted to was the menu button. The button was labelled "Toggle menu", so it wasn't unlabelled (a common issue). So that's good!
But there's a better way to make menu-buttons accessible: using the aria-expanded attribute to indicate if the menu is expanded or collapsed. Let's see Daniel's reaction!
As Daniel noted:
It still says toggle menu… I'm not sure if it works because it doesn't announce if I have expanded something.
So it wasn't the least accessible menu button we've come across, but not the best either.
On top of this, if you use the site in landscape mode or on small devices, it's not possible to scroll to the bottom menu options:
Missing heading levels
Headings allow screen reader users to jump between sections and understand the hierarchy of information. The AI-built site, however, sometimes skipped heading levels:
So the site skipped from Level 1 directly to Level 3. For a screen reader user this can feels like pages have been ripped out of a book—you simply don't know if you've skipped vital information.
This was probably the most surprising failure on the site, since automatic tools easily can find and test for skipped heading levels.
Label mismatch
I don't have a video for this next one, but there's a "Get tickets" button.

The visual text is 'Get tickets', but it has an aria-label="Register for tickets". This means that the accessible name and the visual name don't match.
Why is this an issue? Well, mainly because some motor impaired users will use voice control to navigate a site. They will say the visible name of the button, like "Click get tickets," and if the accessible name doesn't include that phrase, nothing happens.
This is a clear requirement in WCAG: 2.5.3 Label in name and quite straight forward to test for. So come on AI, you should catch these sorts of things in the future!
Language Confusion
Finally, the language switcher, was inaccessible.
It just says 'en button' and 'sv button'… I can't tell which one is which really.
Additionally, the site didn't include the proper lang attributes for the content that switched language, meaning the screen reader wouldn't know to switch to the correct voice for the content.
Again, this is something that's easily testable and the guidelines around it are super clear, so I was expecting more.
Summary
Daniel summarises his thoughts:
Here's the gist of his quote in text:
In short, it felt okay to read content. But as soon as there was interactive content…there were some problems. Some more severe than others. So there's still room for improvement to be kind.
Fixing issues from the sofa
So I think we can agree that the site wasn't 100% accessible.
I do, however, want to end on a positive note.
Maybe the most exciting part of this experiment wasn't the errors we found, but how fast they disappeared.
After I shared this feedback during a talk, there was a 10 minute q&a. While that was going on, the site creator sat in a sofa and fixed many of these issues using his smartphone. Including some of the more difficult issues regarding focus management and the leaking menus and modals. Very cool!
So with a human expert in the loop, AI tools are more likely to be able to create accessible sites.
However, at least 99.9% of the sites created with these tools will not have an accessibility specialist involved, nor will the site creator have prompted that accessibility is important. So I'm hoping that Lovable and similar tools work hard to make the out-of-box interfaces they build accessible by default. That would be an awesome achievement, however, we seem to be far from that place at the moment.
ChatGPT Personal Finance
OpenAI launched ChatGPT personal finance for Pro users, connecting actual bank accounts to enable natural language queries over transaction data.
Summary
Original Article
Gemini app rolling out ‘Extended' thinking level, new 3rd-party app integrations
Google's Gemini app is adding an 'Extended' thinking level, catching up to Claude's thinking mode and ChatGPT's o1 reasoning features.
Summary
Decoder
Original Article
Codex will soon be able to control other desktop devices via Computer Use
OpenAI is developing Computer Use for Codex that operates on locked Macs, potentially clashing with Apple's security model.
Summary
Decoder
Original Article
OpenAI appears to be quietly extending the reach of its Codex remote control system, working on a capability that would let the coding agent operate macOS applications through Computer Use even when a laptop is locked or asleep. The work is being positioned as a follow-up to the remote control feature that landed in the ChatGPT mobile app on May 14, which lets iPhone and Android users review outputs, approve commands, switch models, and dispatch new tasks to a Mac running the Codex desktop app.
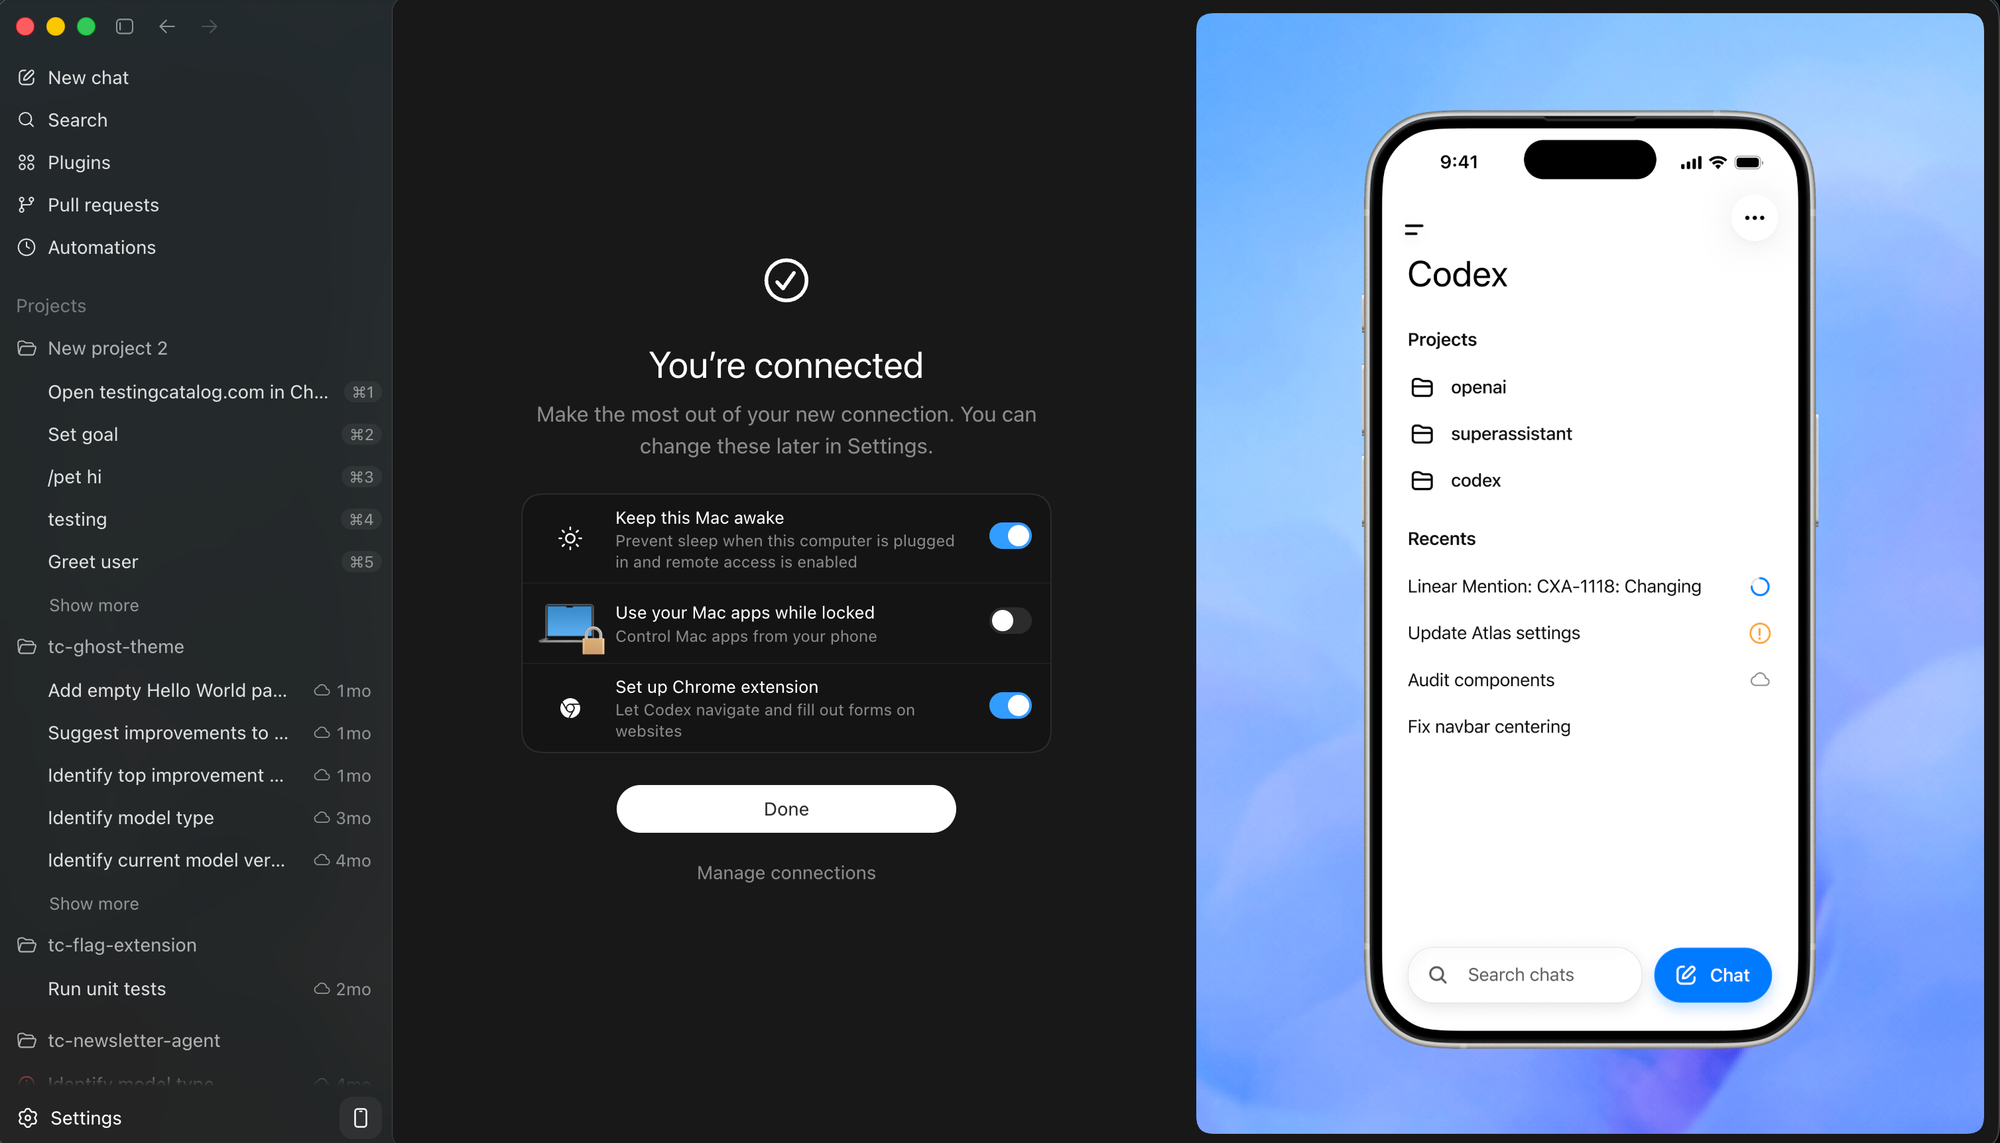
The new piece in development addresses one of the most awkward gaps in that workflow. The blocker has been Computer Use itself, which requires an unlocked, awake session to see the screen, move the cursor, and type in apps. Lifting that restriction would mean a phone could direct the agent to open a desktop app, test a GUI build, run through a simulator, or hit a data source, all without the user having to walk back to the machine to log in first.
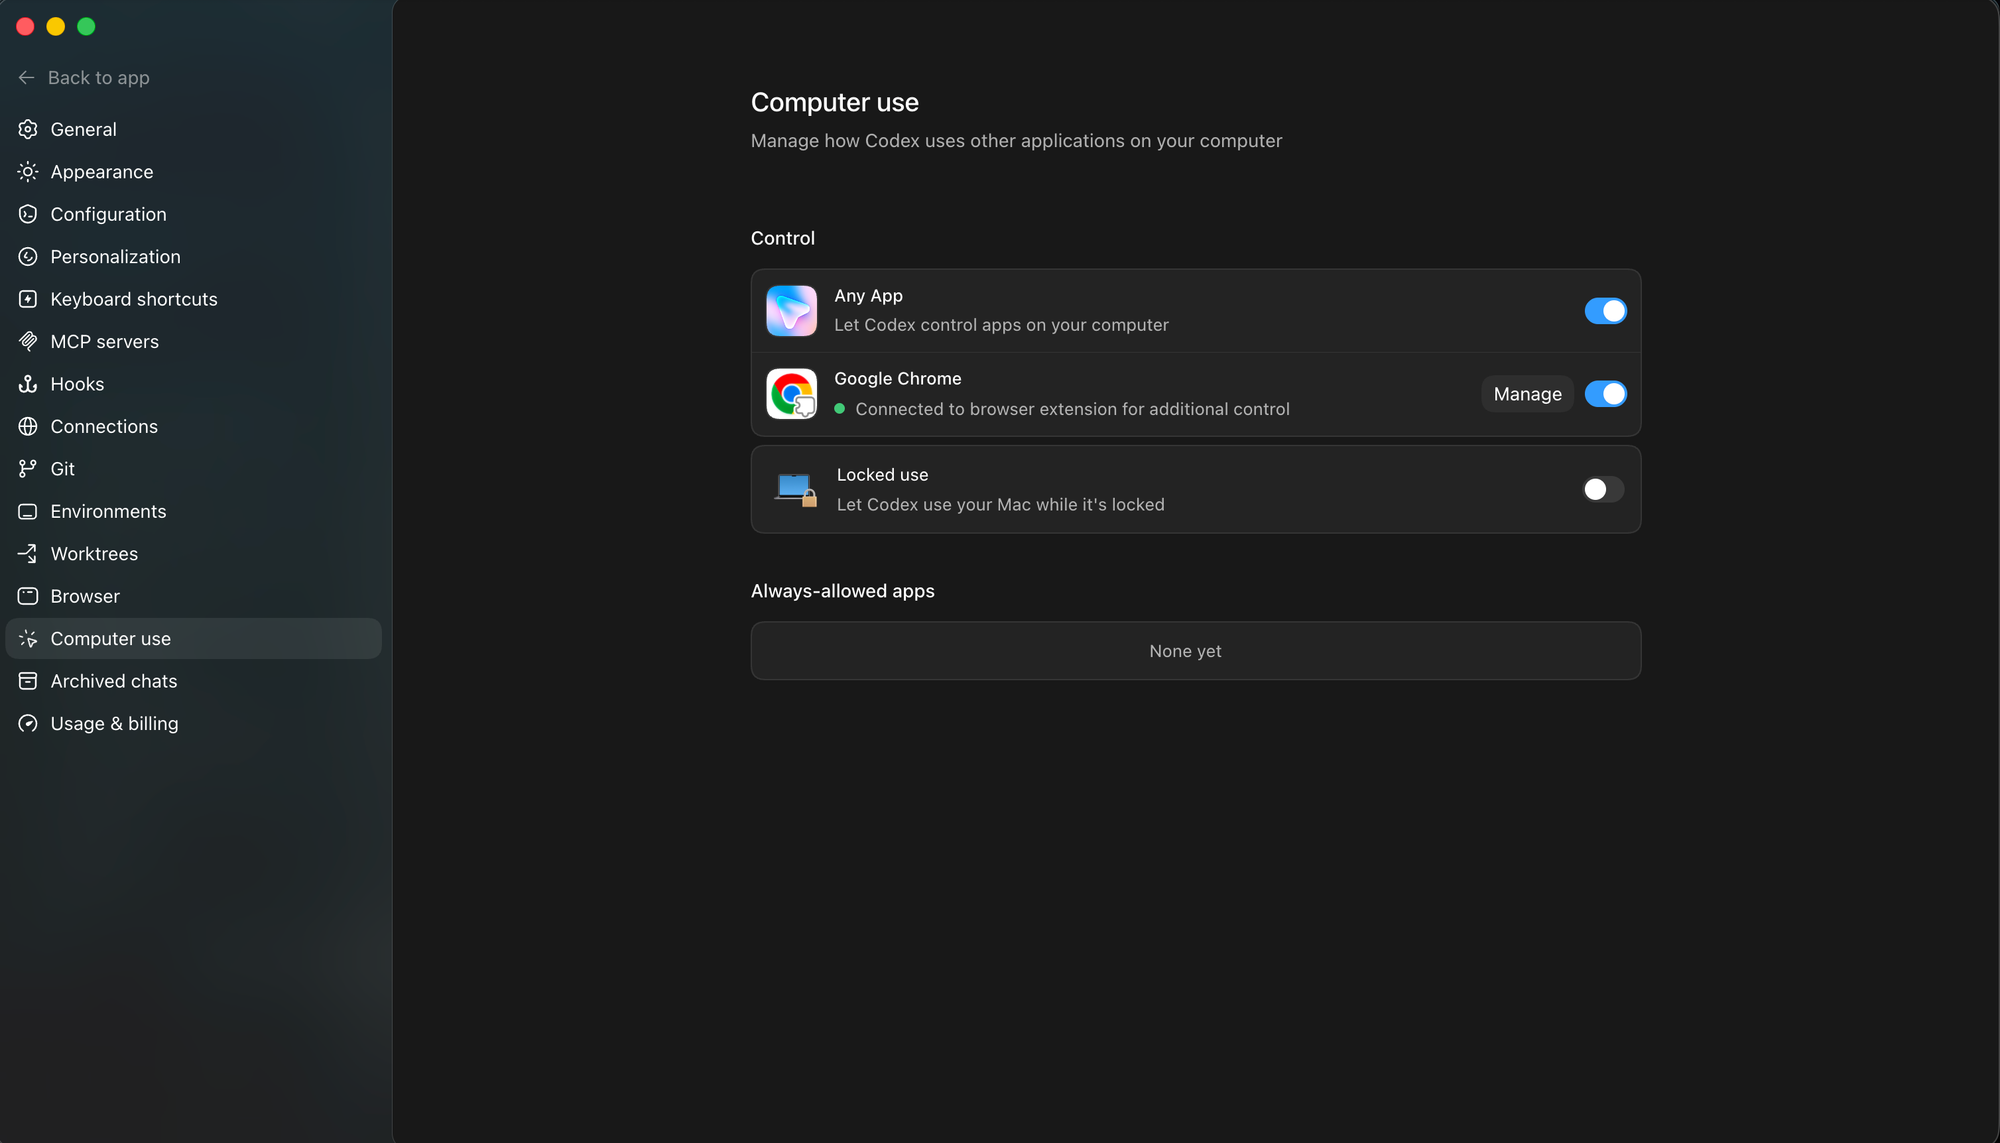
It would also close a gap with Anthropic, which shipped its own phone-to-machine control for Claude Code back in February but remains similarly constrained once a Mac locks.
How Apple reacts is the open question. Bypassing the standard expectation that a locked screen means an idle, untouchable session sits uncomfortably with macOS security defaults, and any approach that keeps a screen-driving agent active inside a locked session will likely draw attention from Cupertino. Release timing has not surfaced, but this should be read as the second beat of the same remote-control story rather than a standalone launch.
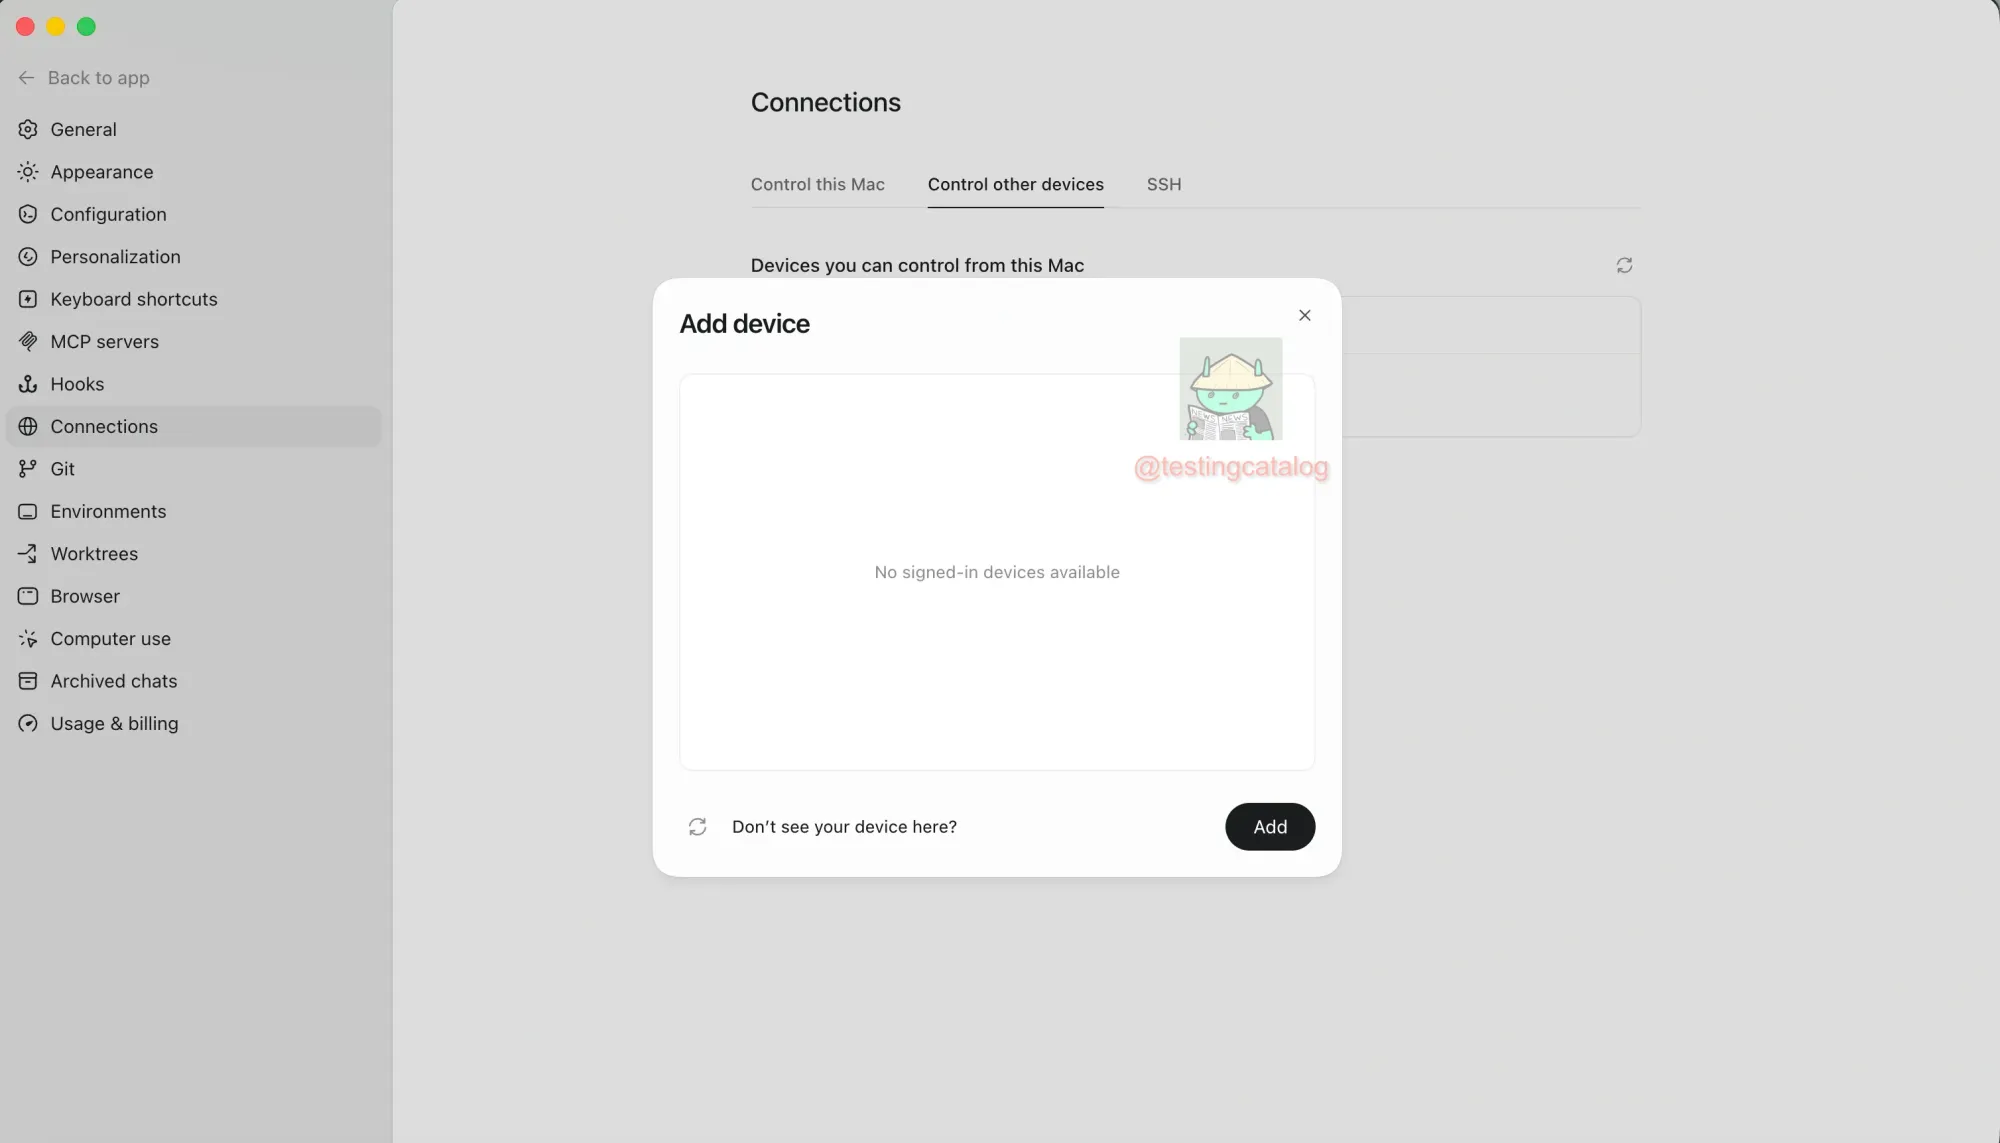
Additionally, OpenAI is exploring the possibility of connecting to and controlling other desktop devices running the Codex app. For example, you can install it on a Mac Mini and operate it directly from your main device. Based on the still-developing UI component, users will be able to connect to and operate many devices remotely.
AI economics part 2
AI labs are hitting GPU supply limits where efficiency improvements matter more than adding raw compute capacity.
Summary
Original Article
The haves and have nots of the AI gold rush
Deedy Das estimates 10,000 AI company employees hit $20M+ wealth while other engineers fear their skills are becoming obsolete.
Summary
Original Article
Runway started by helping filmmakers — now it wants to beat Google at AI
Runway, built by NYU film grads to $5.3B, pivoted to world models trained on video, betting observational data beats text for AGI.
Summary
Decoder
Original Article
AI video-generation startup Runway doesn't have the typical Silicon Valley pedigree. No Stanford founders, no ex-Google founders, no nine-figure seed round that bought them time to ignore revenue. Its three founders — two from Chile, one from Greece — met at NYU's Tisch School of the Arts and built the company in New York.
Runway also could be, depending on who you ask, one of the most consequential AI companies today. Not because of what it has built, but because of what it is trying to build next.
For the past several years, the AI industry has largely operated on the premise that intelligence lives in language. Large language models like OpenAI's ChatGPT and Anthropic's Claude reflect that bet.
Runway, alongside other competitors, is making a different one. Its founders believe the next form of AI intelligence won't be built from text, but from video and world models that learn how the world works, not just how humans describe it. That distinction sounds academic. Its implications are not.
Runway co-founder and co-CEO Anastasis Germanidis said training models directly on observational data from the world is the next frontier of AI. The companies that get there first, he argues, won't be the ones that perfected language.
"We're basically bound by our own understanding of reality," Germanidis told TechCrunch from Runway's homey sunlight-filled headquarters near Union Square.
"Language models are trained on the entire internet, on message boards and social media, on textbooks — distilling the existing human knowledge," Germanidis continued. "But to get beyond that, we need to leverage less biased data."
Founded in 2018, Runway built its reputation on video-generation models — including its latest Gen-4.5 — and AI tools that let people turn text prompts into editable, cinematic content.
Today, Runway's technology powers production workflows for filmmakers and ad agencies, and the company has signed deals with major media players like Lionsgate and AMC Networks. Its tools have even been used in films such as "Everything Everywhere All At Once."
Runway is now valued at $5.3 billion and, according to one of its founders, added $40 million in annual recurring revenue in the second quarter of 2026.
If Runway's bet that video generation is the path to world models pays off, the result will be felt from Hollywood to drug discovery. If it doesn't, Runway risks being outpaced by competitors with far deeper pockets — Google chief among them.
Taking the leap
Within the last six months, the startup has put its plan into action and expanded beyond video generation, launching its first world model in December, with plans to launch another this year. (World models are AI systems that simulate environments well enough to predict how they'll behave.)
Runway isn't alone in its pursuit of turning physics-aware video models to world models, with near-term use cases in interactive entertainment, gaming, and robotics training. Startups Luma and World Labs are on a similar trajectory, and Google has pointed its Genie world model in the same direction.
Everyone is after some version of the same thing: AI that solves humanity's hardest problems. That's far from Runway's original product, but it's the result of both emergent capabilities in the technology and founders who were predisposed to follow where it led.
For his part, Germanidis sees world models as scientific infrastructure. The more sensory data and observations you train a single model on, the closer you get to a working digital twin of the universe — one you can run experiments on faster than any lab could. Much of the scientific process is just waiting on results, he points out. If you could compress that waiting, you could compress progress itself.
"If we can build a better scientist than human scientists, we can accelerate progress in how we understand the universe and how we solve problems," Germanidis said.
The moonshot

Germanidis fell in love with programming as an 11-year-old in Athens and came to the U.S. at 18 to study neuroscience and film. He turned back to computer science, working at several Silicon Valley tech firms before deciding he'd had enough of the culture. Co-CEO Cristóbal Valenzuela, born and raised in Santiago, studied economics as an undergraduate before working in film and then software. Another Santiago native, chief innovation officer Alejandro Matamala Ortiz studied advertising and ran a design firm.
The three met in 2016 while attending NYU's ITP (Interactive Communications Program), a graduate program that Valenzuela described as an "art school for engineers."
The co-founders had all aspired to be filmmakers at certain points in their lives, according to Matamala Ortiz. So Runway started with a simple mission: Can we use AI to make everyone a filmmaker?
According to Matamala Ortiz, after releasing their first video-generation model in February 2023 — which is staggeringly unimpressive compared to what Runway is putting out today — that mission evolved into: Can we make everyone a great filmmaker?
It required growing the team to what it is today. The company has 155 workers spread across offices in New York, London, San Francisco, Seattle, Tel Aviv, and most recently, Tokyo. "But throughout this process, we learned that these models can understand how the world works, and if you scale them, they can be useful for many other different things," he added.
Things like robotics, drug discovery, and climate modeling — the kinds of problems that have stumped researchers for decades. Last year, Runway launched a robotics unit that Germanidis says has already resulted in real-world testing and deployments.
Germanidis, like others, sees the field heading toward training a single model on many different modalities — text, video, voice, and other sensors — and thinks the compounding effect is the point.
His own moonshot goal for Runway's technology, given enough time and resources, is biological world models and anti-aging research.
Whether Runway can carry its video dominance into world models is far from settled, and the competition isn't waiting around. Runway was among the first to develop AI video generation, but world models are a different race with deep-pocketed and well-respected competitors. Google, former Meta chief scientist Yann LeCun, AI's "godmother" Fei-Fei Li, and a growing field of startups are all chasing the same goal.
Kian Katanforoosh, CEO of AI skills benchmarking company Workera and a lecturer at Stanford, pointed out that no one has yet proven the jump between video intelligence and generalized reasoning via world models, but that doesn't mean it's impossible. He said that if Runway wants to turn its world model bet into reality, it will need to continue gathering resources — compute chief among them.
Runway has deals with CoreWeave and Nvidia but wouldn't confirm whether it has dedicated cluster access — the kind of guaranteed, large-scale compute that training frontier models requires.
"How are you going to build a foundational model without a cluster?" Katanforoosh asked. "I don't think anybody can do that."
Runway has raised $860 million to date, including a $315 million round in February from strategic partners like AMD Ventures and Nvidia. That's roughly in line with its most immediate competitors, Luma AI and World Labs, which have raised $900 million and $1.29 billion, respectively, according to PitchBook.
But Runway is also going up against incumbents like OpenAI, which has raised around $175 billion per CEO Sam Altman, and tech behemoth Google, whose parent company Alphabet is worth $4.86 trillion. Google is Runway's biggest threat. The company's Veo model competes directly with Runway's video-generation business, while its Genie world model targets the same longer-term territory Runway is racing toward.
Katanforoosh nodded at OpenAI, which shuttered its video platform Sora in March after burning roughly $1 million per day in compute costs with barely $2.1 million in revenue according to some estimates. His point: Resources alone don't guarantee survival. They don't guarantee it for Runway either.
Katanforoosh isn't writing Runway off. He pointed to AI audio startup ElevenLabs, which has outperformed OpenAI and Google on their own benchmarks, despite lacking the resources and pedigree of either. Runway, he argues, could follow a similar playbook.
The comparison isn't lost on Runway's founders. Valenzuela says the startup's lack of Bay Area "standardization" gives them an edge. Not only do they have diversity of thought, he contends, but without Silicon Valley ties, they had to be scrappier, lacking the war chest many of their peers have access to that would have insulated them from the need to generate revenue early.
And according to Michelle Kwon, Runway's chief operating officer, the company isn't in a rush to raise more funds, even as compute demands increase with scale.
"Their background has led them to be early, to be right more often than not, and to build a culture that moves incredibly quickly," early investor Michael Dempsey, managing partner at Compound, told TechCrunch.
For Valenzuela, that culture starts with how he sees the world in the first place. He spends whatever free time he has — not much, as a co-CEO and new father — reading books, including the Chilean poet Nicanor Parra, whom he describes as the antithesis of Pablo Neruda: less formal, less academic, holding a view that poetry belongs to the people rather than to rules.
"Rules are just rules they invented," Valenzuela said. "That's a driving force of how we do things at Runway. They say Silicon Valley is here and that's where the startups are. Why? Those are just made-up rules. Scrub them all and start again."
OpenAI Quietly Bought Voice-Cloning Startup Weights.gg, Then Folded the Team
OpenAI acquired voice-cloning startup Weights.gg, shut down the product, and dispersed the six-person team across internal groups.
Summary
Original Article
Andy Jassy Is Rewriting Amazon's Playbook for the AI Age
Andy Jassy has spent his five years as Amazon CEO cutting costs to fund expensive AI bets that now define the company's biggest challenge.
Summary
Original Article
For SpaceX, the stakes of this week's Starship rocket test flight are sky-high
SpaceX tests redesigned Starship V3 Tuesday, one day before releasing the prospectus for what could be the biggest IPO in history.
Summary
Original Article
Uber turns on Waymo as it pours $10B+ into owning robotaxi alternatives
Uber is investing $10 billion to own robotaxis after Waymo's 400,000 weekly rides showed AV operators can bypass platforms.
Summary
Original Article
Domain Knowledge Is the Leverage
Micro-level refactoring loses value as AI agents implement code faster than humans can refactor, shifting developer leverage to domain knowledge.
Summary
Original Article
incident.io launches PagerDuty Rescue Program
incident.io offers PagerDuty customers contract buyouts up to one year and 99.99% uptime as PagerDuty's net retention falls below 100%.
Summary
Original Article
Amazon Bedrock introduces new advanced prompt optimization and migration tool
AWS Bedrock now auto-optimizes prompts across 5 models at once using metric-driven feedback loops, supporting multimodal inputs like PDFs and images.
Summary
Deep Dive
Decoder
Original Article
My Thoughts on Bun's Rust Rewrite
Bun merged a Claude AI-authored 6,755-commit Rust rewrite in six days with only automated review and no human having read it.
Summary
Deep Dive
Decoder
Original Article
ducklake-sdk (GitHub Repo)
Independent Rust/Python SDK reads and writes DuckLake tables without DuckDB, integrating with Polars and Arrow.
Summary
Decoder
Original Article
Apache Arrow as Data Interchange
Apache Arrow's shared memory layout enables zero-copy data movement between Pandas, Spark, and databases, eliminating serialization bottlenecks.
Summary
Decoder
Original Article
Ten Data-backed Truths of User Experience ROI
One second of page load delay wipes out 20% of conversions, costing retailers $2.6 billion annually.
Summary
Deep Dive
Decoder
Original Article
Every extra second of friction has a measurable business cost. Carrie Webster shares ten data-backed UX facts that link user experience directly to revenue, retention, and long-term growth.
In the high-stakes economy of today, the cost of a friction-heavy interface is no longer just "lost clicks", but potentially millions in wasted engineering spend and lost business value. As a veteran UX designer who has helped build digital products since the early mobile-first era, I've watched business leaders shift from viewing design as a "cosmetic preference" to recognising that user experience is actually the primary engine of business survival.
A UX design role is as much about research and analytics as it is about pixels, and I believe that hard data is the only tool powerful enough to bridge the gap between design and the boardroom. Facts don't just advocate for the user; they prove that UX is a non-negotiable requirement for a healthy bottom line. Even in the rooms where decisions are made, UX is frequently undervalued as a 'visual' role. I've learned that the most effective way to dismantle this myth is through data.
The following ten facts represent the current reality of the digital world. These are not just "design tips"; they are the clinical, data-backed pillars for financial growth in a saturated market. Some of these facts are also commonly used by designers as best practices.
For example, I once led a B2C mobile design project, where I was able to strip 1.2 seconds off the mobile load time by reducing and removing some of the visual assets. The result was an immediate 12% lift in completed transactions, proving that in UX, every tenth of a second is a direct lever for revenue.
1. Fixing Issues In The Design Phase Is 100 Times Cheaper
One of the most compelling financial arguments for UX is the 1:100 rule. Modern studies, such as from the IBM Systems Institute and Sugue Technologies, show that fixing an error after a product has been developed and launched can be up to 100 times more expensive than fixing it during the initial design and prototyping phase.
Think of UX as "engineering insurance." By the time a developer touches the code, every interaction should have been validated. If you discover a fundamental navigation flaw after launch, you aren't just paying for the fix; you're paying for technical debt, lost developer time, and the revenue lost while users struggle with a broken flow.

2. Performance Impacts User Experience
In the current landscape, performance is the essential foundation of user experience. A beautiful interface is worthless if the user bounces before it renders. The data is uncompromising: 47% of users expect a page to load in two seconds or less, and missing this window is a financial catastrophe. A mere one-second delay can reduce conversions by 20% and satisfaction by 16%, while retail businesses lose an estimated $2.6 billion annually to slow load times. When mobile load time moves from one to three seconds, the bounce rate spikes by 32%, and by the third second, conversion rates typically plummet from 40% to 29%.
However, this volatility offers a massive lever for growth. Even a microscopic 0.1-second improvement can lift retail conversions by 8.4%, and travel site conversions by 10.1%. Improving your Largest Contentful Paint (LCP) by 31% — a benchmark 67% of websites achieved as of June 2025 — can drive a direct 8% increase in sales. As a long-time designer, I treat speed as a primary design element.
If the site isn't instantaneous, the design hasn't just failed — it effectively doesn't exist.

3. Your Site Has 50 Milliseconds to Impress Your Customers
First impressions are both visceral and aesthetic. Research indicates that users form an opinion about a website's visual appeal in approximately 50 milliseconds (0.05 seconds). That's not a lot of time! This split-second "gut-feeling" is a survival mechanism that dictates whether a user stays to explore your value proposition or bounces immediately.
In the current market, 94% of first impressions are strictly design related. If your interface feels "off" or dated, users subconsciously project that lack of quality onto your entire product or service. Your content effectively doesn't exist if your design hasn't earned the five seconds of attention required to read it.
4. Hick's Law: The Cost of Overwhelm
Stakeholders often think "more options" equals "more value." Psychology proves the opposite. Hick's Law states that the time it takes to make a decision increases with the number of options available.
Every extra menu item or form field is a "tax" on the user's brain. As noted by Landbase, top-performing sites now achieve conversion rates exceeding 11%, while average performers struggle below 3%. Those performing well have applied personalization and optimization strategies to simplify the experience.
If you want to increase your revenue by tomorrow, find one field to delete from your checkout flow today.

5. White Space Improves Comprehension
"White space" is often viewed as wasted real estate by non-designers. In reality, it is a tool for focus. Strategic use of white space can increase a user's content comprehension by up to 20%.
White space prevents "cognitive load" from peaking. By giving the user's eyes a place to rest, you guide them toward the most important elements, usually your "Buy" or "Sign Up" button. In 2026, as attention spans have dropped to roughly 8 seconds, simplicity is the ultimate luxury and a major driver of engagement.
For example, in a fintech dashboard I worked on, analyst users were feeling overwhelmed by a 'data dump' layout in some of the dashboard components. I applied more white space around the data to lower their cognitive load. Simply giving the data room to breathe led to a 25% decrease in time-on-task and a significant boost in trial-to-paid conversions.
6. The Power Of "Fake" Progress
One of the most surprising psychological hacks in UX is that users will complete a task faster if they believe they have already made progress. This is known as the Goal Gradient Effect.
In a classic study, researchers found that a 10-stamp coffee card with two stamps already "pre-filled" was completed significantly faster than an 8-stamp card with zero pre-fills, even though the total spend required was identical. In digital design, showing a progress bar that starts at 15% (simply for creating an account) increases completion rates for onboarding by over 40%. We aren't just designing screens — we are managing the user's dopamine and sense of momentum.

7. Make Your Content Readable
Many stakeholders believe that cramming more text "above the fold" increases value. Data proves the opposite. Proper typography, specifically line spacing (leading) and paragraph width, can increase content comprehension and reading speed by up to 20%.
Optimal line height (generally 1.5x the font size) reduces "visual noise," allowing the brain to process information with less cognitive effort. When users struggle to read your text due to tight spacing or small fonts, their "perceived effort" increases, leading to a higher bounce rate. Legibility is a conversion tool: if it's hard to read, it's hard to buy.
There are many ways to display more legible text. For example, if line spacing (leading) is too small or the font is too heavy, this also impacts readability.

8. Your Users Only Read 20% of Your Content
This truth meshes well with the previous one. Users do not read your website; they scan it. On a typical web page, users read only about 20% to 28% of the text.
Because modern users scan in an F-pattern or Spotted pattern, designing for reading is a tactical error. We must design for scanning.
This requires the following:
- Bold headers that narrate the value proposition.
- Bullet points for key benefits.
- White space to connect users to key information (discussed in the previous truth).
- High-contrast call-to-action (CTA) buttons. If your core message is buried in a paragraph, it is invisible to nearly 80% of your audience.
9. Why User Testing With 5 People Is the Magic Number
I have heard of companies that waste six-figure budgets on massive user studies with 100 people, only to get buried in noise. The reality is that testing with just 5 users typically uncovers 85% of usability problems.
This is a mathematical sweet spot. After the fifth user, you reach the point of diminishing returns — you spend more money to find fewer new bugs. The competitive advantage belongs to small and frequent user testing activities. Test with 5 people, iterate, and test with 5 more. It is the most cost-effective way to build a bulletproof product.
Personally, I have followed this guideline many times during user testing activities, and I can confidently say that testing with 5 people does deliver the majority of issues in your design.
10. The Financial ROI of 9,900%
Last, but definitely not least, the most staggering statistic in our industry remains consistent. On average, every $1 invested in UX returns $100. This 9,900% ROI isn't magic, but the sum of increased conversion and reduced support.
A fully optimised UX design can improve conversion rates by up to 400%. Furthermore, intuitive design significantly lowers customer support requirements. When a product is self-explanatory, you don't need a massive call centre to explain how to use it.
The Depth of UX Investment
Beyond these individual statistics, we must address the cumulative effect of a mature UX practice. In my years of practising, the most successful firms are those that treat UX as a continuous improvement loop rather than a one-off project. The data shows that companies with high design maturity see 32% higher revenue growth and 56% higher total returns to shareholders compared to their less design-focused peers.
This discrepancy exists because mature UX organisations move beyond "user delight" and into "user efficiency." When you shave 30 seconds off a workflow for a team of 1,000 employees, you aren't just making them happier; you are reclaiming hundreds of thousands of dollars in annual productivity. This internal ROI is often overlooked, but it is just as vital as consumer-facing conversion rates.
Furthermore, the "experience gap" is real. 80% of companies believe they deliver a "superior experience," but only 8% of customers agree. This massive disconnect represents a significant market opportunity for those willing to look at the hard data. By bridging this gap through continuous user testing and performance optimisation, you aren't just improving a product but capturing market share that your competitors are leaving on the table.
The Impact of AI
Today, we cannot talk about UX without talking about AI. However, AI hasn't replaced these 10 facts, but it has accelerated the solution on some of these.
- Agentic UX
60% of designers are now building "AI agents" that take actions on behalf of the user, drastically reducing the impact of Hick's Law by narrowing down choices before the user even sees them. - Real-Time Personalisation
32% of teams use AI to personalise interfaces in real-time, meaning the F-Pattern scanning habits are catered to by moving the most relevant content to exactly where that specific user's eyes are likely to land. - Automated ROI
93% of designers are using generative AI tools to prototype faster, which brings the 1:100 Cost Ratio even lower by allowing us to find and fix errors before a single line of production code is written.
AI has turned UX from a static map into a living, breathing guide for users. But the fundamental rules of human psychology, such as our 50ms judgments and our need for white space, remain unchanged.
Conclusion
In summary, here is a list of the key truths to remember:
- Fixing issues in the design phase is 100 times cheaper.
- Performance impacts user experience.
- Your site has 50 milliseconds to impress your customers.
- Hick's Law: The cost of overwhelm.
- White space improves comprehension.
- The power of "fake" progress.
- Make your content readable.
- Your users only read 20% of your content.
- Why user testing with 5 people is the magic number.
- The financial ROI of 9,900%.
As we move deeper into the late 2020s, the line between "design" and "business strategy" has vanished. The data is in, and companies that lead in design outperform their competitors by 1.7x in revenue growth.
UX design is no longer a team you hire to "make things look nice." It is the research-driven, data-backed discipline that ensures your digital product isn't just a cost centre, but a revenue-generating machine.
In fact, this has always been the case, but I hope that in presenting these cold, hard truths, it now becomes a reality for your business.
As I have found over the years, implementing factual design improvements does make a difference that intuition alone can't replicate. We are past the era of subjective opinions. The data is clear, the psychology is proven, and the ROI is undeniable. The only question left is whether you're ready to let the facts lead your design, or if you'll let your competitors do it first.
AI made everyone a creator, not a designer
AI tools can now generate polished UIs so fast that SaaS products are converging on identical visual styles, shifting competitive advantage from execution to taste.
Summary
Deep Dive
Original Article
How to enter side doors
A college AI researcher published a Notion guide to latent space, got recruited via Discord, and cofounded Leonardo.ai, later acquired by Canva.
Summary
Original Article
Kubernetes v1.36: New Metric for Route Sync in the Cloud Controller Manager
Kubernetes v1.36 ships a metric specifically to A/B test whether watch-based route reconciliation cuts cloud provider API calls.
Summary
Decoder
Original Article
What Leading a Data Team Actually Looks Like Right Now
Despite AI saturation, data leaders still face the same core challenges: proving business value, fighting tool sprawl, preventing burnout, and growing junior engineers.
Summary
Original Article
AirPods Max designer reveals project details in new interview
Former Apple designer Eugene Whang revealed AirPods Max's five-year development treated the headband, ear cushions, and case as three separate products.
Summary
Decoder
Original Article
Microsoft Admits it Needs Feedback to Fix Windows 11 UX, Launches New Research Panel
Microsoft's new Windows Insider UX panel signals it needs direct user feedback to fix Windows 11's design mess as macOS gains market share.
Summary
Decoder
Original Article
Curated Templates and Guided Flows for Your Creative Ideas (Website)
ElevenLabs launched Creative Templates for automated billboard, lookbook, and ad mockup generation from product photos.
Summary
Original Article
Icons for CSS properties (Website)
Design Surface launched Cascade, an icon set mapping CSS properties to SVG glyphs for dev tools and documentation.
Summary
Original Article
Your Image is Almost Right
Everypixel launched Mini Apps with AI that regenerates camera angles without reshooting and synthesizes resolution instead of stretching pixels.
Summary
Decoder
Original Article
A Designer of the World's Most Ubiquitous Symbols, the Movie
Rajie Cook, the Palestinian immigrant behind America's DoT symbols, spent his life as Roger and died unknown despite art critiquing Israeli occupation.
Summary
Original Article
Can a new logo help Threads escape Instagram's shadow?
Threads introduced a bolder, italicized logo to shed its Instagram DNA and establish itself as a standalone platform after nearly 3 years.
Summary
Original Article
A revolutionary cancer treatment could transform autoimmune disease
Jan Janisch-Hanzlik's MS symptoms reversed within months of CAR T therapy, the cancer treatment now tested for autoimmune diseases.
Summary
Decoder
Original Article
Rubin Tracks Skyscraper-Size Asteroids, Failed Supernovas, and Interstellar Visitors
Rubin Observatory found a 700-meter asteroid spinning every 1.88 minutes, impossible for a rubble pile—must be solid planetary core debris.
Summary
Decoder
Original Article
Adorable Realism Meets Cartoon Magic: Stunning Digital Paintings
Gaming industry veteran Lera Kiryakova built a massive following transforming celebrities into big-eyed cartoon-realism hybrids.
Summary
Original Article
Soul Over Spectacle: Kenneth Branyan on Designing Four Seasons New York Downtown
Kenneth Branyan completed the Four Seasons New York Downtown suite redesign after his husband Bill Rooney died mid-project, transforming corporate hotel rooms into curated Tribeca apartments.
Summary
Decoder
Original Article
Jiyung Lee's illustrations of everyday items are organised 'almost like a catalogue layout'
Korean illustrator Jiyung Lee organizes everyday objects into grid-based catalogue-style drawings inspired by market stalls and supermarket flyers.