Access and share AI Gateway leaderboard data
Vercel has opened its AI Gateway leaderboard data, allowing developers to download production usage trends for various models and providers under a CC BY 4.0 license.
Deep dive
- Data Access: Leaderboard data is licensed CC BY 4.0 for commercial and personal reuse.
- Metrics: Rankings include requests, token volume, spend, and multimedia generation counts.
- Granularity: Data is aggregated daily and can be filtered by modality (text, image, video).
- API Export: The
leaderboard-exportendpoint returns JSON data, cached with a 24-hour TTL.
Original article
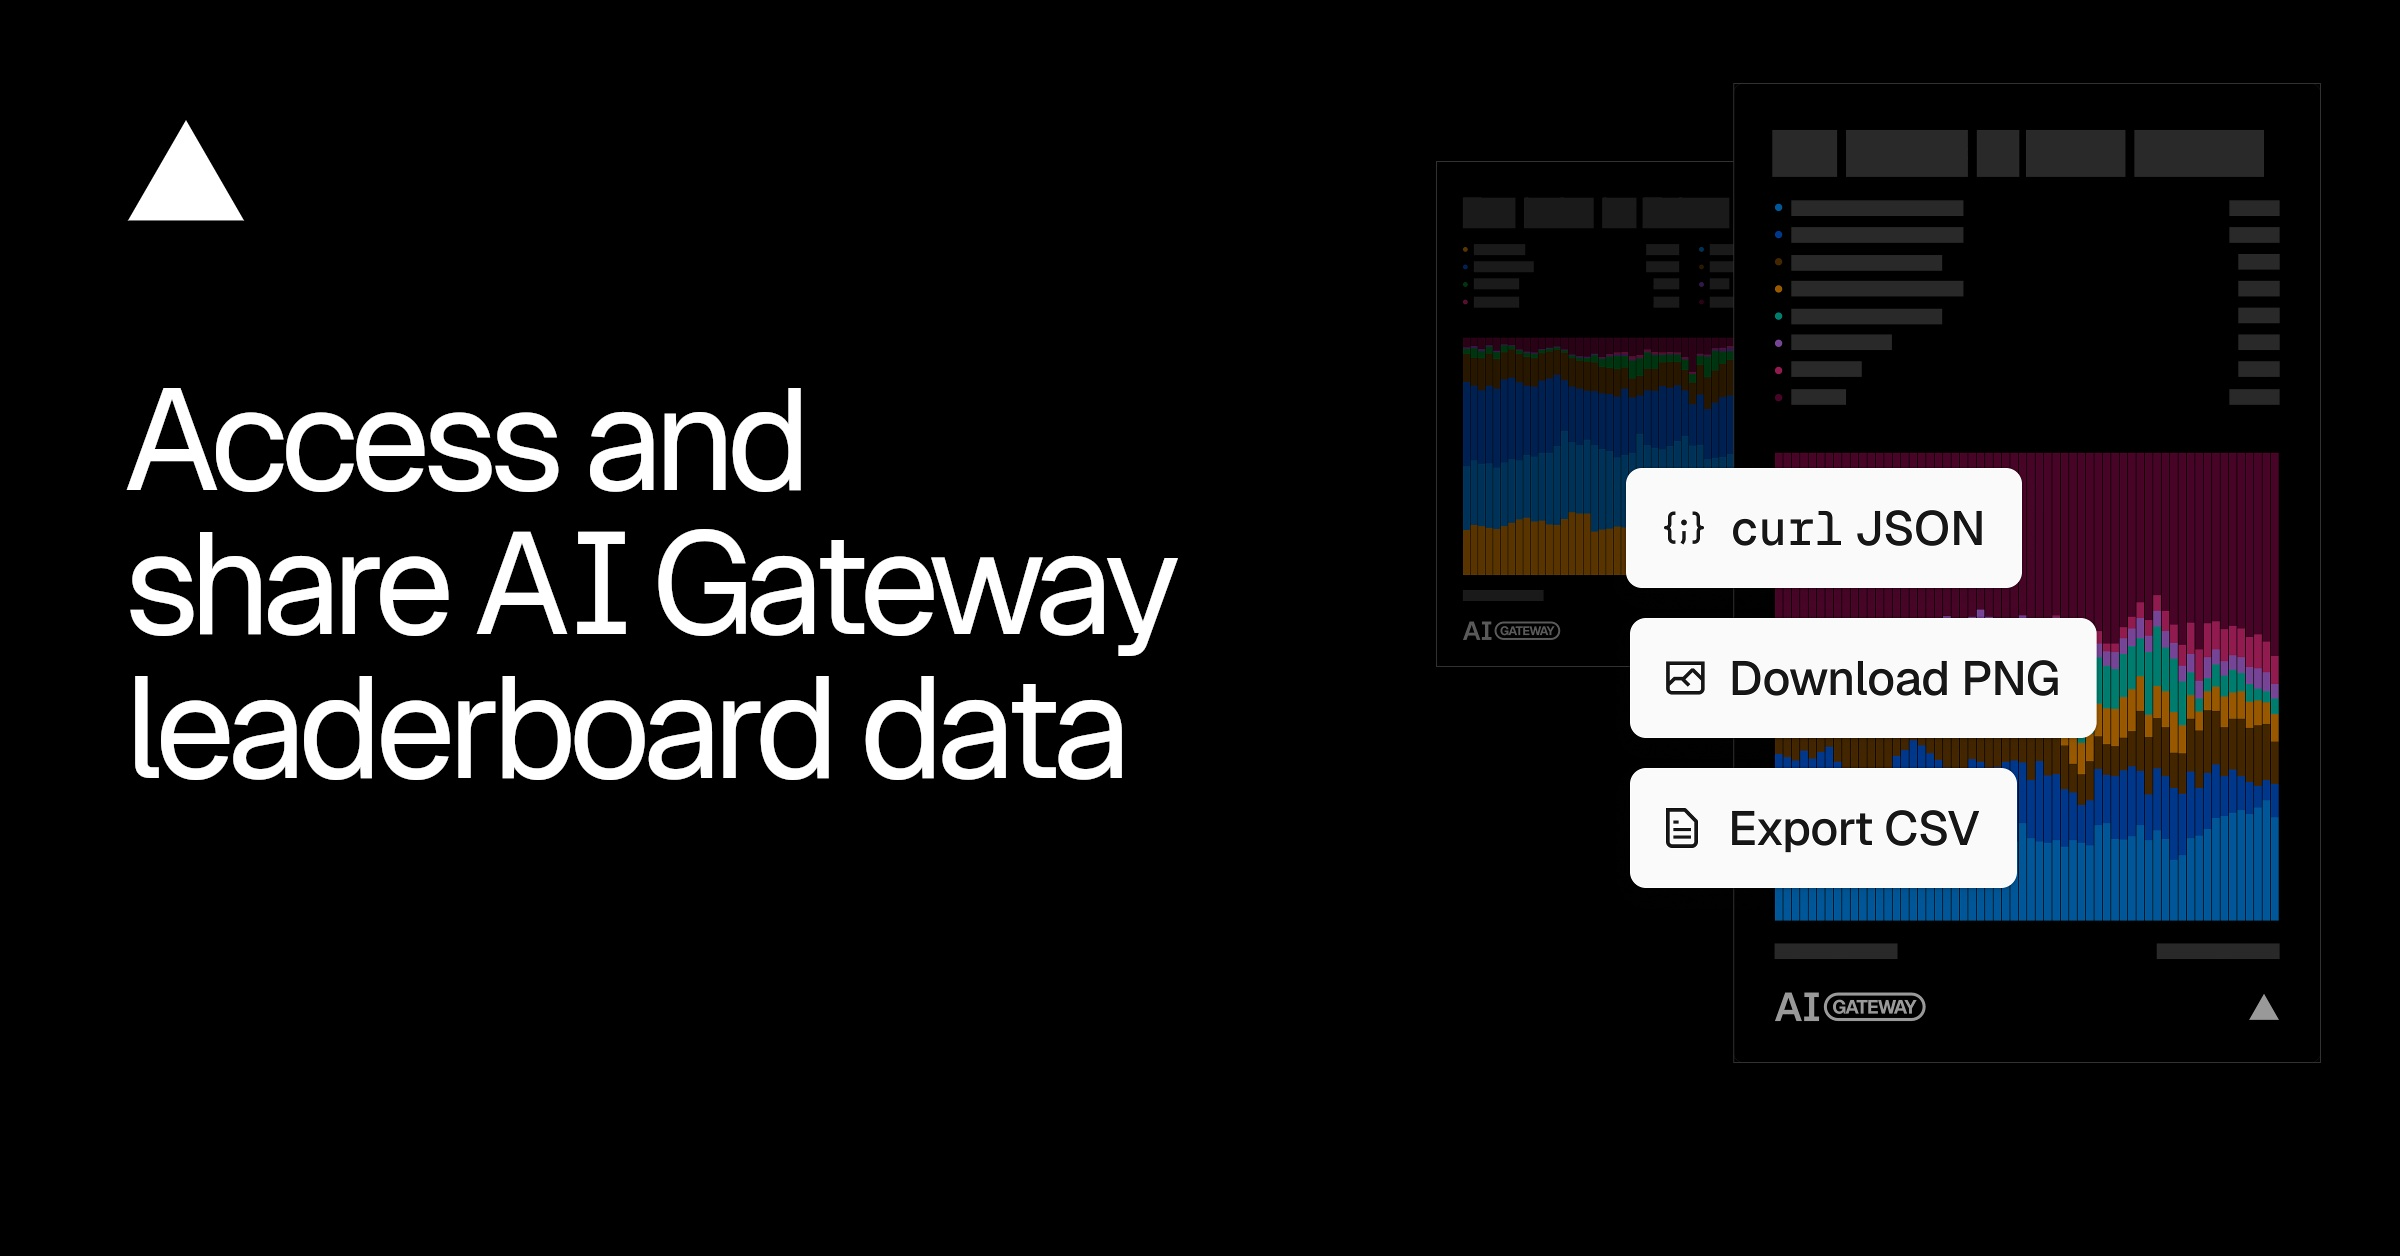
We are making the data behind the AI Gateway leaderboards open under the CC BY 4.0 license. You can now download or query the data through the leaderboard-export API endpoint and render any chart as a shareable image.
The AI Gateway leaderboards show how AI is used in production, ranking traffic for models, labs, apps, and providers. Data is aggregated daily across trillions of tokens, so you can see what gets adopted and how that changes over time. For deeper analysis, see the July AI Gateway Production Index.
What's ranked
There are four leaderboards, each with its own metrics:
| Leaderboard | Ranks | Metrics |
|---|---|---|
| Models | Individual models | Requests, token volume, spend, images or videos generated |
| Labs | Model labs | Requests, token volume, spend, images or videos generated |
| Apps | Opted-in apps built on the AI Gateway | Token volume, spend |
| Providers | Inference providers | Token volume, spend |
Models and labs can be filtered by modality (text, image, video) and show a daily percentage share over time; apps and providers are aggregated across all modalities and show a ranked top list.
Open data
The data behind the leaderboards is open, published under Creative Commons Attribution 4.0 (CC BY 4.0). You are free to use, share, and adapt it, including commercially, as long as you give credit, link to the license, and indicate if changes were made.
Every chart and ranked list has a download button that exports the current view as a CSV.
For programmatic access, use the export endpoint, which returns the same data and is cached for 24 hours:
# Full export, all datasets
curl "https://vercel.com/api/ai/leaderboard-export"
# A single dataset
curl "https://vercel.com/api/ai/leaderboard-export?dataset=models"
# A single dataset, filtered by modality
curl "https://vercel.com/api/ai/leaderboard-export?dataset=models&modality=image"
For models and labs, each row is one entity's daily share of a single metric. One response includes rows for requests, tokens, spend, imageCount, and videoCount, so filter on the metric field to pull out the series you want.
{
  "date": "2026-05-10",
  "group": "model",
  "name": "Gemini 3 Flash",
  "metric": "tokens",
  "modality": "text",
  "share_percent": 23.98
}
Share a chart
Every chart has a share button that turns the current view into an image. Pick an aspect ratio (landscape, square, or portrait), then download it as a PNG or copy it to your clipboard. The image includes the legend, title, and AI Gateway branding.
View the leaderboards or read the AI Production Index.
Fresh dev news, AI-digested daily. Never miss a trend at devoured.fyi