Devoured - June 05, 2026
Anthropic has reported that Claude now authors 80% of its internal production code, resulting in an eightfold increase in engineering productivity. This surge in AI-authored code is prompting a industry-wide shift toward subtractive engineering, where developers focus on pruning complexity and verifying AI-generated changes rather than writing new code from scratch.

When AI builds itself
Anthropic reports that AI-driven development has increased engineer productivity eight-fold, fueling internal efforts toward fully autonomous recursive self-improvement.
Deep dive
- 80% of Anthropic's merged code is currently authored by AI models.
- Engineering productivity measured by lines of code per day has increased 8x since 2024.
- Claude is now used for open-ended research, including hypothesis testing and experiment design.
- Humans are shifting from writing code to reviewing AI-generated output.
- The bottleneck for AI progress is moving from manual coding to human-in-the-loop review and complex research judgment.
- Anthropic is investigating ways to create verifiable 'slowdowns' to allow safety research to match development pace.
Decoder
- Recursive self-improvement: A theoretical state where an AI system is capable of designing and building its own successor without human intervention.
- SWE-bench: A benchmark evaluating a model's ability to resolve real-world software engineering issues within existing codebases.
- Amdahl’s Law: A principle stating that the speedup of a system is limited by the slowest part of that system; here used to describe how speeding up coding creates new bottlenecks in human review.
Original article
Full article content is not available for inline reading.
Defending Code Reference Harness (GitHub Repo)
Anthropic released a reference harness for autonomous vulnerability discovery and patching, demonstrating a recurring 'recon-find-triage-report-patch' loop powered by Claude.
Deep dive
- Pipeline Stages: Automates build, reconnaissance, discovery, verification, deduplication, reporting, and patching.
- Security: Uses gVisor containers to restrict agent egress and ensure safe execution of target code.
- Flexibility: Can be customized for any language or build system by configuring how bugs are detected and fixes verified.
- Integration: Works with various Claude API providers including AWS Bedrock, Google Vertex, and Azure.
- Limitations: Not a turnkey product; requires significant engineering effort to fine-tune triage and prioritization logic for production environments.
Decoder
- gVisor: A user-space kernel for Linux that provides a secure, isolated sandbox for running containers.
- ASAN (AddressSanitizer): A memory error detector for C/C++ that finds bugs like buffer overflows and use-after-free errors.
- Threat Model: A structured process for identifying and prioritizing security risks within a specific system architecture.
Original article
Defending Code Reference Harness
A reference implementation for autonomous vulnerability discovery and remediation with Claude, based on our learnings from partnering with security teams at several organizations since launching Claude Mythos Preview. For a write up of these learnings along with best practices, see the accompanying blog post (also available in blog-post.md). For a lightweight SDK-only walkthrough of the same recon → find → triage → report → patch loop, see the companion cookbook.
This repo is not maintained and is not accepting contributions.
🔒 Want a managed option? Anthropic offers Claude Security, a hosted product that finds and fixes vulnerabilities in your source code across multiple projects. Claude Security scans your repository for vulnerabilities, applies a multi-stage verification pipeline to reduce false positives, and lets you manage findings through their lifecycle: triage, fix validation, and rapid fix generation.
This repository is an open-source reference implementation based on general best practices for finding vulnerabilities using Claude. You can use it to build your own vulnerability finding pipeline, customize the logic, and it can be used with whatever access you have to Claude APIs (including Bedrock, Vertex, or Azure).
Contents
- Claude Code skills:
/quickstart,/threat-model,/vuln-scan,/triage,/patch,/customize: interactive scoping, scanning, triage, and patching. Open this repo in Claude Code and run/quickstartto get oriented. harness/: the autonomous reference pipeline (recon → find → verify → report → patch), configured for finding C/C++ memory vulnerabilities using Docker and ASAN. This harness is a reference, not a product. The general shape, prompts, and sandboxing are reusable, but the harness will not work on every codebase out of the box. Run/customizeto port it to your language, detector, or vuln class.
⚠️ Security:
/quickstart,/threat-model,/vuln-scan, and/triageonly read and write files. Running/patchon static findings (TRIAGE.jsonorVULN-FINDINGS.json) is likewise read- and write-only./customizeedits the harness code and runs validation commands. Any of these skills are safe to run unsandboxed, as long as you review and approve each tool use in Claude Code. The autonomous reference pipeline (including/patchon pipeline results) executes target code, so it refuses to run outside of a gVisor sandbox unless explicitly overridden. To get set up, runscripts/setup_sandbox.shonce, then invoke the pipeline viabin/vp-sandboxed.
Getting Started
git clone https://github.com/anthropics/defending-code-reference-harness
cd defending-code-reference-harness
claude

# 30-sec intro + guided first run on the canary target
> /quickstart

> /quickstart how do I port the pipeline to Java?
> /quickstart how do I triage all these bugs?
Further Reading
- Blog Post · The accompanying blog post with learnings + best practices
- Pipeline · How it works: diagram, stages, CLI flags
- Security · Sandboxing, what not to mount
- Agent sandbox · gVisor isolation + egress allowlist for every agent
- Customize · Port to my stack; which files change and why
- Patching · Generate and verify fixes for verified crashes
- Troubleshooting · Duplicates, rate limits, subagent model pinning
- Safeguards · Block for dangerous cyber work
Ramp Up
The most successful security teams we've partnered with are those that have gotten hands-on the fastest. Though it's tempting to spend months designing the perfect pipeline, we recommend starting small on Day 1 and building from there as learnings come. The steps below follow that pattern and set an ambitious (but reasonable) pace based on what we've seen.
| Step | Timeline | Activity |
|---|---|---|
| Step 1 | Day 1 | Build a threat model and run your first static scan + triage |
| Step 2 | Day 2 | Run the reference pipeline on a C/C++ library |
| Step 3 | Days 3-5 | Customize the pipeline for your target |
| Step 4 | Week 2 | Start autonomous scanning, triage, and patching |
Step 1 (Day 1): Build a threat model and run your first static scan + triage
Day 1 is focused on seeing the whole loop end-to-end. Using only the interactive skills, you'll build a threat model, run a static scan scoped by it, triage what comes back, and draft candidate fixes. You'll finish the day with a threat model, a ranked list of static findings, and candidate patches.
The relevant skills only read and write files in your repo. As long as you run Claude Code interactively and approve each tool use, no sandbox is needed.
# Pin every subagent to the model you want
export CLAUDE_CODE_SUBAGENT_MODEL=<model-id>
claude

# 0. intro + guided first run
> /quickstart

# 1. Build a threat model (aim before you shoot)
> /threat-model bootstrap targets/canary

# 2. Run a static scan, scoped by that threat model
> /vuln-scan targets/canary

# 3. Verify, dedupe, and rank what came back
> /triage targets/canary/VULN-FINDINGS.json

# 4. Generate candidate fixes for the verified findings
> /patch ./TRIAGE.json --repo targets/canary
Step 2 (Day 2): Run the reference pipeline on a C/C++ library
On Day 2, you'll move from interactive skills to your first autonomous run using the reference pipeline. You'll run the full recon → find → verify → report loop in your environment on a known-vulnerable open-source library, then generate a candidate patch for what it finds.
# One-time setup
python3 -m venv .venv && .venv/bin/pip install -e .
./scripts/setup_sandbox.sh   # installs gVisor, builds the agent images, and verifies isolation
export ANTHROPIC_API_KEY=sk-ant-...

# Run the recon → find → verify → report loop
bin/vp-sandboxed run drlibs --model <model-id> --runs 3 --parallel --stream --auto-focus
# Generate a candidate patch for each finding
bin/vp-sandboxed patch results/drlibs/<timestamp>/ --model <model-id>
The pipeline walks through seven stages: Build, Recon, Find, Verify, Dedupe, Report, and Patch.
Step 3 (Days 3-5): Customize the pipeline for your target
On Days 3-5, you'll customize the harness for your own target. By the end of the week, you'll have a targets/<your-service>/ directory that the pipeline can run against.
claude

> /quickstart how do I customize this for ~/code/my-service?

> /threat-model bootstrap-then-interview ~/code/my-service
> /vuln-scan ~/code/my-service
> /triage ~/code/my-service/VULN-FINDINGS.json --repo ~/code/my-service

> /customize use ~/code/my-service/{THREAT_MODEL.md,VULN-FINDINGS.json} and ./TRIAGE.md
Step 4 (Week 2): Start autonomous scanning, triage, and patching
In Week 2, you'll use the pipeline you customized in Step 3 on your own targets, running multiple pipeline scans, triaging findings, and applying patches.
# Scan - run a wave of parallel runs against your target
bin/vp-sandboxed run my-service --model <model-id> --runs 5 --parallel --stream --auto-focus

# Triage - dedupe and rank every finding across all waves
> /triage results/my-service/ --repo ~/code/my-service --auto --votes 5

# Patch - generate and validate fixes
> /patch results/my-service/<timestamp>/ --model <model-id>
Looking Forward
- Reviewing all their internal repos and key open-source dependencies.
- Setting up bespoke infrastructure for scanning to move scans off of laptops.
- Incorporating scans into their SDLC.
- Testing and experimenting with the models to find what works best for them.
Open Code Review (GitHub Repo)
Alibaba has open-sourced Open Code Review, a CLI tool that blends deterministic engineering with LLM-based agents to perform precise, context-aware code reviews.
Deep dive
- Addresses 'position drift' where agents suggest changes at incorrect line numbers or file paths.
- Uses a 'divide-and-conquer' strategy to group related files into sub-agents for stable, concurrent review.
- Allows custom rules via JSON or YAML, prioritizing hard file-path constraints over model intuition.
- Designed for integration into CI/CD pipelines via JSON output or as a plugin for other coding agents like Claude Code.
Decoder
- Deterministic engineering: Approaches where outcomes are guaranteed by explicit code logic rather than probabilistic AI models, ensuring consistent behavior for critical tasks like file selection.
Original article
What is Open Code Review?
Open Code Review is an AI-powered code review CLI tool. It originated as Alibaba Group's internal official AI code review assistant — over the past two years, it has served tens of thousands of developers and identified millions of code defects. After thorough validation at massive scale, we incubated it into an open source project for the community. Simply configure a model endpoint to get started.
It reads Git diffs, sends changed files to a configurable LLM via an agent with tool-use capabilities, and generates structured review comments with line-level precision. The agent can read full file contents, search the codebase, inspect other changed files for context, and produce deep reviews — not just surface-level diff feedback.
Why Open Code Review?
The Problem with General-Purpose Agents
If you've used general-purpose agents like Claude Code with Skills for code review, you've likely encountered these pain points:
- Incomplete coverage — On larger changesets, agents tend to "cut corners," selectively reviewing only some files and missing others.
- Position drift — Reported issues frequently don't match the actual code location, with line numbers or file references drifting off target.
- Unstable quality — Natural-language-driven Skills are hard to debug, and review quality fluctuates significantly with minor prompt variations.
The root cause: a purely language-driven architecture lacks hard constraints on the review process.
Core Design: Deterministic Engineering × Agent Hybrid
Open Code Review's core philosophy is to combine deterministic engineering with an agent, each handling what it does best.
Deterministic Engineering — Hard Constraints
For review steps that must not go wrong, engineering logic — not the language model — guarantees correctness:
- Precise file selection — Determines exactly which files need review and which should be filtered, ensuring no important change is missed.
- Smart file bundling — Groups related files into a single review unit (e.g.,
message_en.propertiesandmessage_zh.propertiesare bundled together). Each bundle runs as a sub-agent with isolated context — a divide-and-conquer strategy that stays stable on very large changesets and naturally supports concurrent review. - Fine-grained rule matching — Matches review rules to each file's characteristics, keeping the model's attention sharply focused and eliminating information noise at the source. Compared to purely language-driven rule guidance, template-engine-based rule matching is more stable and predictable.
- External positioning and reflection modules — Independent comment-positioning and comment-reflection modules systematically improve both the location accuracy and content accuracy of AI feedback.
Agent — Dynamic Decision-Making
The agent's strengths are concentrated where they matter most — dynamic decisions and dynamic context retrieval:
- Scenario-tuned prompts — Prompt templates deeply optimized for code review, improving effectiveness while reducing token consumption.
- Scenario-tuned toolset — Distilled from deep analysis of tool-call traces in large-scale production data — including call frequency distributions, per-tool repetition rates, and the impact of new tools on the overall call chain — resulting in a purpose-built toolset that is more stable and predictable for code review than a generic agent toolkit.
How to Use
CLI
Install
Via NPM (Recommended)
npm install -g @alibaba-group/open-code-reviewAfter installation, the ocr command is available globally.
From GitHub Release
Download the latest binary from GitHub Releases:
# macOS (Apple Silicon)
curl -Lo ocr https://github.com/alibaba/open-code-review/releases/latest/download/opencodereview-darwin-arm64
chmod +x ocr && sudo mv ocr /usr/local/bin/ocr

# macOS (Intel)
curl -Lo ocr https://github.com/alibaba/open-code-review/releases/latest/download/opencodereview-darwin-amd64
chmod +x ocr && sudo mv ocr /usr/local/bin/ocr

# Linux (x86_64)
curl -Lo ocr https://github.com/alibaba/open-code-review/releases/latest/download/opencodereview-linux-amd64
chmod +x ocr && sudo mv ocr /usr/local/bin/ocr

# Linux (ARM64)
curl -Lo ocr https://github.com/alibaba/open-code-review/releases/latest/download/opencodereview-linux-arm64
chmod +x ocr && sudo mv ocr /usr/local/bin/ocr

# Windows (x86_64) — move ocr.exe to a directory in your PATH
curl -Lo ocr.exe https://github.com/alibaba/open-code-review/releases/latest/download/opencodereview-windows-amd64.exe

# Windows (ARM64) — move ocr.exe to a directory in your PATH
curl -Lo ocr.exe https://github.com/alibaba/open-code-review/releases/latest/download/opencodereview-windows-arm64.exe
From Source
git clone https://github.com/alibaba/open-code-review.git
cd open-code-review
make build
sudo cp dist/opencodereview /usr/local/bin/ocr
Quick Start
1. Configure LLM
You must configure an LLM before reviewing code.
# Option A: Interactive config
ocr config set llm.url https://api.anthropic.com/v1/messages
ocr config set llm.auth_token your-api-key-here
ocr config set llm.model claude-opus-4-6
ocr config set llm.use_anthropic true

# Option B: Environment variables (highest priority)
export OCR_LLM_URL=https://api.anthropic.com/v1/messages
export OCR_LLM_TOKEN=your-api-key-here
export OCR_LLM_MODEL=claude-opus-4-6
export OCR_USE_ANTHROPIC=true
Config is stored in ~/.opencodereview/config.json.
It is also compatible with Claude Code environment variables (ANTHROPIC_BASE_URL, ANTHROPIC_AUTH_TOKEN, ANTHROPIC_MODEL) and parses ~/.zshrc / ~/.bashrc for those exports.
Note for CC-Switch Users: If you are using CC-Switch with routing service enabled, you can point
llm.urlto the CC-Switch proxy address without additional configuration:
- For Claude provider: set
llm.urltohttp://127.0.0.1:15721- For CodeX provider: set
llm.urltohttp://127.0.0.1:15721/v1- Set
llm.modelaccording to your provider settingsllm.auth_tokencan be any valueextra_bodysettings still apply
2. Test Connectivity
ocr llm test3. Review
cd your-project

# Workspace mode — review all staged, unstaged, and untracked changes
ocr review

# Branch range — compare two refs
ocr review --from main --to feature-branch

# Single commit
ocr review --commit abc123
Integrate with Coding Agents
OCR can be seamlessly integrated into AI coding agents as a slash command, enabling code review directly within your agent workflow.
Option 1: Install as a Skill
Use npx to install the OCR skill into your project:
npx skills add alibaba/open-code-review --skill open-code-reviewThis installs the open-code-review skill, which teaches your coding agent how to invoke ocr for code review, classify issues by priority, and optionally apply fixes.
Option 2: Install as a Claude Code Plugin
For Claude Code, install the command plugin through the following command in Claude Code:
/plugin marketplace add alibaba/open-code-review
/plugin install open-code-review@open-code-review
This registers the /open-code-review:review slash command, which runs OCR and automatically filters and fixes issues.
Option 3: Copy the Command File Directly
For a quick setup without any package manager, simply copy the command file to use the /open-code-review slash command in Claude Code.
Project-level (shared with team via git):
mkdir -p .claude/commands
curl -o .claude/commands/open-code-review.md \
  https://raw.githubusercontent.com/alibaba/open-code-review/main/plugins/open-code-review/commands/review.md
User-level (personal global use across all projects):
mkdir -p ~/.claude/commands
curl -o ~/.claude/commands/open-code-review.md \
https://raw.githubusercontent.com/alibaba/open-code-review/main/plugins/open-code-review/commands/review.mdPrerequisite: All integration methods require the
ocrCLI to be installed and an LLM configured.
CI/CD Integration
OCR can be integrated into CI/CD pipelines to automate code review on Merge Requests / Pull Requests.
The core command for CI integration:
ocr review \
  --from "origin/main" \
  --to "origin/feature-branch" \
  --format json
The --format json flag outputs machine-readable results suitable for parsing in CI scripts.
Commands
| Command | Alias | Description |
|---|---|---|
ocr review |
ocr r |
Start a code review |
ocr rules check <file> |
— | Preview which review rule applies to a file path |
ocr config set <key> <value> |
— | Set configuration values |
ocr llm test |
— | Test LLM connectivity |
ocr viewer |
ocr v |
Launch WebUI session viewer on localhost:5483 |
ocr version |
— | Show version info |
ocr review Flags
| Flag | Shorthand | Default | Description |
|---|---|---|---|
--repo |
— | current dir | Git repository root |
--from |
— | — | Source ref (e.g., main) |
--to |
— | — | Target ref (e.g., feature-branch) |
--commit |
-c |
— | Single commit to review |
--preview |
-p |
false |
Preview which files will be reviewed without running the LLM |
--format |
-f |
text |
Output format: text or json |
--concurrency |
— | 8 |
Max concurrent file reviews |
--timeout |
— | 10 |
Concurrent task timeout in minutes |
--audience |
— | human |
human (show progress) or agent (summary only) |
--rule |
— | — | Path to custom JSON review rules |
--max-tools |
— | built-in | Max tool call rounds per file; only takes effect when greater than template default |
--tools |
— | — | Path to custom JSON tools config |
Examples
# Preview which files will be reviewed (no LLM calls)
ocr review --preview
ocr review -c abc123 -p

# Review workspace changes with default settings
ocr review

# Review branch diff with higher concurrency
ocr review --from main --to my-feature --concurrency 4

# Review a specific commit with verbose JSON output
ocr review --commit abc123 --format json --audience agent

# Use custom review rules
ocr review --rule /path/to/my-rules.json

# Preview which rule applies to a file
ocr rules check src/main/java/com/example/Foo.java
ocr rules check --rule custom.json src/main/resources/mapper/UserMapper.xml

# View review session history in browser
ocr viewer
ocr viewer --addr :3000
Viewer security
The viewer serves session JSONL contents over HTTP. It enforces a Host-header allowlist on every request: loopback names (localhost, 127.0.0.0/8, ::1) and the concrete bind host are always allowed. Wildcard binds and other non-loopback Hostnames must be added via the OCR_VIEWER_ALLOWED_HOSTS environment variable (comma-separated):
OCR_VIEWER_ALLOWED_HOSTS=review.internal,ocr.lan ocr viewer --addr :3000This blocks DNS-rebinding attacks against the local viewer.
Review Rules
OCR resolves review rules using a four-layer priority chain. Each layer uses first-match-wins: if a file path matches a pattern, that rule is used; otherwise it falls through to the next layer.
| Priority | Source | Path | Description |
|---|---|---|---|
| 1 (highest) | --rule flag |
User-specified path | CLI explicit override |
| 2 | Project config | <repoDir>/.opencodereview/rule.json |
Per-project rules, can be committed to git |
| 3 | Global config | ~/.opencodereview/rule.json |
User-wide personal preferences |
| 4 (lowest) | System default | Embedded system_rules.json |
Built-in rules covering common languages and file types |
Rule File Format
Layers 1–3 share the same JSON format:
{
  "rules": [
    {
      "path": "force-api/**/*.java",
      "rule": "All new methods must validate required parameters for null values"
    },
    {
      "path": "**/*mapper*.xml",
      "rule": "Check SQL for injection risks, parameter errors, and missing closing tags"
    }
  ]
}pathsupports**recursive matching and{java,kt}brace expansion.- Within each layer, rules are evaluated in declaration order — the first match wins.
- If a rule file does not exist, it is silently skipped.
Configuration Reference
Config file: ~/.opencodereview/config.json
| Key | Type | Example |
|---|---|---|
llm.url |
string | https://api.openai.com/v1/chat/completions |
llm.auth_token |
string | sk-xxxxxxx |
llm.model |
string | claude-opus-4-6 |
llm.use_anthropic |
boolean | true | false |
language |
string | English | Chinese (default: Chinese) |
telemetry.enabled |
boolean | true | false |
telemetry.exporter |
string | console | otlp |
telemetry.otlp_endpoint |
string | OTLP collector address |
telemetry.content_logging |
boolean | Include prompts in telemetry |
Environment variables take precedence over the config file.
Telemetry
OpenTelemetry integration for observability (spans, metrics). Disabled by default.
ocr config set telemetry.enabled true
ocr config set telemetry.exporter otlp
ocr config set telemetry.otlp_endpoint localhost:4317
Set telemetry.content_logging to include LLM prompts and responses in exported data.

An Interview with Microsoft CEO Satya Nadella About Finding Core Competencies
Microsoft CEO Satya Nadella is repositioning the company around 'agentic' software and proprietary hardware-software co-design to maintain control in an AI-dominated ecosystem.
Deep dive
- Multi-tenant hill-climbing: A system where enterprises use private benchmarks and reinforcement learning to iteratively improve models on their own specific data.
- Project Solara: A new initiative to build agent-first enterprise hardware that bridges local silicon and cloud resources.
- Agentic shift: A transition from chat-based AI assistants to autonomous agents that execute multi-step tasks in the background.
- Business model: Microsoft is shifting toward a hybrid model of per-seat subscriptions and usage-based consumption for AI agent operations.
Decoder
- Hill-climbing: An iterative process of adjusting variables to optimize an outcome; in this context, it refers to continuous model improvement via reinforcement learning.
- Capex: Capital expenditures, or the money companies spend on physical infrastructure like data centers and specialized AI hardware.
- ROIC: Return on Invested Capital, a key metric used to assess the efficiency of a company's investment decisions.
- Token capital: A metaphor for the computing resources and data weights a company accumulates to fuel its AI-driven services.
- Evals: Evaluation datasets used to measure the accuracy and quality of AI model outputs.
Original article
Full article content is not available for inline reading.

Bots have now passed human traffic online
Cloudflare reports that automated 'agentic' traffic has officially overtaken human traffic, fundamentally altering the economics and technical requirements of web hosting.
Deep dive
- Data breakdown: Human traffic is now 42.5% versus 57.5% bot/agent traffic.
- Agentic behavior: These bots aren't traditional scrapers; they are 'agentic' models performing multi-step tasks like price comparison and customer service interactions.
- Host impact: Website owners are seeing skyrocketing data costs, leading many to place content behind login walls to block non-authenticated scrapers.
- Geographic variance: High bot concentrations in places like Gibraltar and Singapore are attributed to dense data center infrastructure, while Iran's activity is linked to VPN-based bypass tools.
Decoder
- Agentic traffic: Network traffic generated by autonomous AI agents performing tasks, rather than humans interacting via browsers.
- HTTP request: The fundamental message format that a client (browser or agent) sends to a server to request a web page or resource.
Original article
The rapid increase in agentic internet traffic means “bots have now passed human traffic online for the first time in the Internet's history,” according to the CEO and co-founder of Cloudflare, Matthew Prince. “Welp, that happened faster than I predicted,” Prince awkwardly admitted, making his previous expectations of the crossover happening sometime in 2027 seem way off the mark.
Welp, that happened faster than I predicted. Thought it would be end of 2027, then early 2027, but agentic traffic growing so fast that bots have now passed human traffic online for the first time in the Internet's history.
Before going on, it’s important to differentiate this new surge in internet traffic from the traditional bots most will be aware of, things like website crawlers, search indexers, and bad stuff like fraud or abuse bots. It is different now, as Cloudflare is charting agents that browse the web much like humans on behalf of humans, and it is already at a massive scale.
You might wonder what all these AI agent bots are actually up to, particularly if you’re not running your own army of digital helpers. Thankfully, Cloudflare has addressed the scope of AI bot activity in previous articles and blogs. Also, last year it started classifying traffic according to these new website visitors (e.g., signed agents and verified bots), which is why the charts don’t go back very far.
Cloudflare reckons these AI agents are online doing stuff like reading product pages, checking prices, performing multi-step tasks online like comparing flights, scraping and indexing web content (but for AI models, not search engines), and acting as personal assistants to order food, compare and shop, and handle customer service interactions.
At the time of writing, Cloudflare data suggests that the balance between bot vs. human web traffic (HTTP requests) is already firmly favoring the former, split 57.5 vs. 42.5 percent. A major shift from humans clicking around, being the primary customers of the web, to AI agents doing these tasks has already happened. The rate of change has even taken Prince by surprise. In replies to the embedded Tweet, Prince also noted that the date of the human/bot crossover wasn’t clear as the “data [is] a bit messy.” Nevertheless, we are “clearly on the other side now,” he added.
However, Cloudflare metrics measure HTTP requests, not engagement. Flesh-and-blood folks remain the primary users of the web in terms of total time spent in app usage, streaming, and infinite-scrolling feeds. These mediums simply don't generate the same volume of rapid-fire page-load requests as automated agents do.
We were also interested in looking at Cloudflare’s breakdown of human/bot traffic by country. The most bot-ridden traffic comes from the tiny island of Gibraltar (92.1%), followed by Singapore (76.4%), then Iran (76.4%). While some of these places have a lot of data centers and hosting infrastructure compared to population size, Iran’s high bot count may rather come from the heavy use of VPNs with automated scraping and bypass tools. Cloudflare has also previously flagged Iran as a hotspot for malicious bot activity.

Meta's smart glasses companion app ships a complete, dormant face-recognition pipeline on a stock account
Meta’s smart glasses companion app contains a fully functional, dormant facial recognition pipeline capable of identifying people on-device.
Deep dive
- The stack uses industry-standard models including SCRFD for detection, KPSAligner for alignment, and SFace for embedding.
- Models are delivered via Meta's NMLML asset system as .pte files for the ExecuTorch runtime.
- A local SQLite database schema uses the sqlite-vec extension to perform cosine-similarity searches on 2048-float embeddings.
- The app includes a 'NameTagsPending' directory that persists biometric records of faces that do not match the local index.
- The notification system is pre-configured with a 'nametags_recognition' channel and deep-link intent handlers.
- While the backend sync infrastructure exists (RLDrive), no biometric data was observed being pushed to test accounts.
- The system is a complete, modular, and coherent engineering project, not legacy or accidental dead code.
Decoder
- ExecuTorch: Meta’s cross-platform library designed to run AI models on mobile and edge devices.
- Cosine similarity: A metric used to measure how similar two vectors are, commonly used in machine learning to compare biometric embeddings.
- Embedding: A numerical representation of data (in this case, a human face) in a high-dimensional vector space, where similar objects are closer together.
- sqlite-vec: A SQLite extension that enables vector similarity search directly within database queries.
Original article
Stella is the companion app for Meta's smart glasses. Inspecting version 273.0.0.21 of the Android build (com.facebook.stella), I found the entire computational and storage stack for on-device facial recognition: three face models, a local database schema, a cosine-similarity vector index dimensioned to match the models, a write path that stages biometric records to disk, a fully wired notification surface, and a user-facing "Connections" widget.
I want to be precise about what that does and does not mean, because the gap between the two is important.
What I can demonstrate: the machinery is present, it is wired together. Several facial extraction and facial fingerprinting models are present and I was able run the recognition pipeline end-to-end on a test image and it detected a face, generate a 2048-dimension biometric embedding, searched a local index, and on a match fired an Android notification stating to the user "Person Recognized". To get the pipeline to run I invoked its existing handler directly with a test photo.
What I cannot demonstrate: that any of this is active for ordinary users. On a stock, unenrolled account the user-facing UI does not appear, and the screen the recognition notification deep-links to is missing from the build. I also did not observe Meta server-pushing identity data to the relevant database on my test account.
So this is not "Meta is secretly identifying the people you look at." It is: the complete apparatus to do exactly that is sitting on the device, assembled and functional, gated by Meta.
All findings below are reproducible against com.facebook.stella v273.0.0.21.
Three face-recognition models ship on the device (~100 MB)
Three ExecuTorch (.pte) models arrive on the device via NMLML, Meta's asset-delivery system, downloaded from Meta.
| Asset name (Meta's naming) | File | Size | Function |
|---|---|---|---|
android_facerec_scrfd |
SCRFD.pte |
3.4 MB | Detects faces in an image |
android_facerec_kps_aligner |
KPSAligner.pte |
117 KB | Crops and aligns each detected face |
android_facerec_sface |
SFace.pte |
96 MB | Converts a face into a 2048-number embedding (the biometric fingerprint) |
These map onto open-source architectures, the same model families that other apps and academic projects already use:
- SCRFD Sample and Computation Redistribution for Efficient Face Detection (InsightFace, ICLR 2022). Reference implementation:
github.com/deepinsight/insightface. - SFace Sigmoid-Constrained Hypersphere Loss for Face Recognition (Zhong et al., 2021). Reference:
github.com/zhongyy/SFace - KPSAligner keypoint-based alignment, standard practice since 2015 (MTCNN, dlib, InsightFace).
Meta's SFace variant seems to be scaled larger than the public reference (96 MB vs. ~40 MB; 2048-dimension output vs. the reference's 128–512). Worth stating plainly: shipping detection and embedding models is not, by itself, evidence of recognition. Plenty of apps run on-device face detection for framing or autofocus.
A cosine-similarity face index, dimensioned exactly to the on-device fingerprinter
The recognition pipeline that actually runs and reads into this database:
/data/user/0/com.facebook.stella/files/rldrive/person_profiles/objects.dbThis lives under RLDrive, Meta's cross-device sync framework, in a person_profiles namespace designed to be populated remotely. I did not directly observe Meta pushing data to person_profiles specifically on my test account. I want to be clear that I'm describing the channel's existence, not an observed transmission.
The schema:
CREATE TABLE person (
  nodeid  INTEGER PRIMARY KEY,
  name    TEXT,
  uri     TEXT,
  blob    BLOB,
  deleted INTEGER,
  version BLOB
);

CREATE TABLE face (
  nodeid    INTEGER PRIMARY KEY,
  mediaPath TEXT,    -- the face_id used in the deep link
  personUri TEXT,    -- soft reference back to person.uri
  blob      BLOB,
  deleted   INTEGER,
  uri       TEXT,
  version   BLOB
);

CREATE VIRTUAL TABLE face_mediaPath_vec
  USING vec0(mediaPath float[2048] distance_metric=cosine);
  -- 2048-float biometric fingerprint per face, cosine-distance search
  -- (uses the sqlite-vec extension)
Each face row points at a person via personUri. Each face.mediaPath is the primary key into face_mediaPath_vec, which stores the 2048-number embedding. Recognition is a cosine-similarity query against that index, followed by a join into person.name for the notification text.
A few things line up:
vec0is the open-source sqlite-vec extension, which turns SQLite into a vector-similarity engine.- The dimension
float[2048]is the exact output shape of the SFace embedder shipped on the app. - The
cosinemetric is the standard choice for comparing face embeddings.
The schema permits multiple face rows per personUri (no UNIQUE constraint), but whether a production deployment uses one-to-one or one-to-many is not visible from a non-enrolled device.
End-to-end test confirms both branches and isolates where writes go. I SHA-256-snapshotted and row-counted the database, then ran the full recognition pipeline twice: once against an empty index (no-match), once against an index pre-loaded with a single embedding (match):
- No match (empty
face_mediaPath_vec): one(uuid.jpg, uuid.emb)pair was written toNameTagsPending/. No notification. - Match: an Android notification fired through the production
nametags_recognitionchannel - title "Person recognized", body "Recognized Michel Foucault". Nothing was added toNameTagsPending/.
Unrecognized faces are staged to disk: crop plus fingerprint in NameTagsPending/
When the device sees a face that the local index does not match, Stella writes it to:
/data/user/0/com.facebook.stella/files/NameTagsPending/Each unrecognized face produces a pair of files named with a fresh UUID:
- a
.jpg— the cropped, aligned face, the output of SCRFD + KPSAligner; and - an
.emb— the 2048-number SFace fingerprint.
The directory is mode 0700 and survives reboots. Writes happen only on the no-match branch; matched faces go to a notification and leave no on-disk trace.
I verified the embedding's structure directly:
File:    NameTagsPending/1566ab46-[...].emb
Size:    8,192 bytes (2048 × float32, big-endian)
L2 norm: 0.999999          ← canonical L2-normalized face embedding
Min/max: −0.092110 / +0.098950
Mean:    +0.000292
Together, (uuid.jpg, uuid.emb) is a complete, indexable biometric record of one face — the same shape and encoding the cosine index in person_profiles/objects.db is built to match against.
The name NameTagsPending most literal reading is "faces pending a name" — biometrically encoded, awaiting a label. I'll note the structural fact and let it carry its own weight: a face image and its fingerprint, stored side by side in plaintext, mode 0700, surviving reboots, is precisely the dataset you would assemble if you intended to retroactively identify faces once a label arrives.
The notification surface is fully wired
Stella defines a dedicated Android notification channel
NotificationChannel{
  id          = "nametags_recognition"
  name        = "NameTags recognition"
  description = "Notifications for recognized NameTags connections"
  importance  = IMPORTANCE_HIGH      (heads-up + sound + badge)
  sound       = system notification sound
}
The notification template is hardcoded in the recognition handler. Title is always "Person recognized"; body is always "Recognized " + name, where name comes from the person table in person_profiles/objects.db:
NotificationCompat.Builder(ctx, "nametags_recognition")
  .setContentTitle("Person recognized")
  .setContentText("Recognized " + matched_name)
  .setAutoCancel(true)
  .setContentIntent(
    PendingIntent.getActivity(
      ctx,
      matched_name.hashCode(),
      Intent.ACTION_VIEW with
        Uri "fb-viewapp://name_tags?face_id=" + face_id,
      FLAG_IMMUTABLE | FLAG_UPDATE_CURRENT))
  .build()

NotificationManagerCompat.notify(matched_name.hashCode(), notification)
The notification is tappable: its contentIntent is a deep link of the form fb-viewapp://name_tags?face_id=<face_id>, a Meta-authored URL scheme meant to open a person-profile screen inside Stella.
One honest caveat: in v273, I could not find that destination screen. Tapping the notification routes Stella to its default tab, because the target Compose destination is absent from the navigation graph. The notification fires; the screen it points at isn't built into this release.
A user-facing "Connections" entry point exists in the APK
Stella v273 contains a widget rendering a card under a section header titled "Connections", with the text "See your connections" / "Remember the people you met and make new connections." Both strings are hardcoded literals in the APK not server-pushed.
On a stock, unenrolled account, the card does not appear on the Glasses tab at all. It became visible during testing. In normal use, a user would not see this.
What this adds up to
- The full on-device face-recognition stack: detection, alignment, embedding, vector index, storage, write path, and notification surface is present and assembled in Stella v273.
- It is functional. Run end-to-end, it recognizes a known face and names it in a notification, and it stages unknown faces (crop + fingerprint) to disk.
- The index dimension, embedding shape, and storage schema are mutually consistent, this is a coherent system, not stray dead code.
- The pieces a user would actually touch: the "Connections" card and the profile screen the notification opens are either absent from the build or buried deeper.
- The database the live pipeline uses sits in a sync namespace Meta populates server-side, alongside other namespaces it already populates, but I did not observe a push to the face namespace on my account.
What I am not claiming: that Meta is identifying strangers for users today, that enrollment data is flowing, or that any of this is enabled in production.
What's hard to wave away: building, shipping, and wiring this much apparatus down to an 2048-dimension facial fingerprinting and a hardcoded "Person recognized" notification, is an engineering investment. Capability that doesn't ship by accident. Whether and when it goes into production is Meta's to answer.
This research is published alongside reporting in WIRED.

Inspektor Gadget: Results from the first security audit
The first independent security audit of Inspektor Gadget discovered three vulnerabilities and six hardening opportunities, all now patched.
Deep dive
- The audit used manual source review, dynamic lab testing, and static analysis.
- Researchers confirmed that eBPF tracing tools face an ongoing "cat-and-mouse" challenge with new Linux syscalls (e.g., openat2).
- Vulnerabilities found included command injection, DoS via ring-buffer flooding, and unsanitized terminal output.
- Hardening recommendations include enforcing TLS by default and restricting DaemonSet RBAC permissions.
- The audit confirms that while the tool is secure, it is subject to bypasses if an attacker uses specific, unhooked syscalls or evasion techniques.
Decoder
- eBPF (extended Berkeley Packet Filter): A kernel-level technology that allows developers to run sandboxed programs inside the Linux kernel to monitor and modify system behavior without changing kernel source code.
- OCI (Open Container Initiative): A set of open standards for container runtimes and image formats, ensuring interoperability across different tools.
- Ring buffer: A fixed-size data structure used to pass events from the kernel to user-space tools; if filled too quickly (flooding), new events are dropped.
Original article
Inspektor Gadget, the open source eBPF-based toolkit for Kubernetes observability and Linux host inspection, has completed its first independent security audit. The audit was coordinated by the Open Source Technology Improvement Fund (OSTIF), funded by the CNCF and carried out by Shielder. The findings, the fixes, and the hardening recommendations are now public, and every reported vulnerability has a patch available.
This post walks through what Inspektor Gadget does, how the audit was scoped, what the researchers found, and what the results mean for teams running it in production.
What is Inspektor Gadget?
Inspektor Gadget is a framework and toolkit that uses eBPF to collect and inspect data on Kubernetes clusters and Linux hosts. It manages the packaging, deployment, and execution of “gadgets” — eBPF programs packaged as OCI images. OCI (the Open Container Initiative) is a Linux Foundation project that defines open industry standards for container image formats and runtimes, so the same image can be distributed and run across any compliant tool or registry.
For teams running Kubernetes in production that need to understand what is happening inside a cluster, Inspektor Gadget provides that visibility without the usual tradeoffs. There is no need to rebuild container images with extra instrumentation, inject sidecars into every pod, attach debuggers or strace to running processes, restart workloads to toggle tracing on and off, or ship custom kernel modules to nodes. Instead, eBPF programs are loaded into the kernel at runtime to safely observe syscalls, network activity, and file access. Applications keep running unchanged while operators get the data they need.
Why a security audit?
Any tool that runs with elevated privileges on shared infrastructure needs to earn trust. Inspektor Gadget runs with root-level access on nodes to do its job, so an independent review of its security posture is a natural step as the project matures and adoption grows.
OSTIF is a nonprofit dedicated to improving the security of open source software. Over the past ten years, OSTIF has managed security engagements that have uncovered more than 800 vulnerabilities across 120 open source projects.
How the audit was scoped
OSTIF engaged Shielder, to perform the assessment. Two researchers worked on the audit in early 2026. Their methodology combined:
- Collaborative threat modeling with the Inspektor Gadget maintainers
- Manual source code review
- Dynamic testing on dedicated lab environments
- Static analysis using tools such as Semgrep and GoSec
- AI-assisted code review for broader coverage
The researchers built three test environments that reflect how Inspektor Gadget is deployed in the wild: a local Linux host deployment, a remote daemon deployment, and a Kubernetes deployment on minikube.
What the audit found
The audit identified three vulnerabilities. None were rated Critical or High severity.
Two Medium severity findings
- Command injection in ig image build (CVE-2026-24905). The image build process used Makefiles that embedded user-controlled input without proper escaping, creating a command injection vector. This matters most in CI/CD pipelines that build untrusted gadgets. Fixed in release v0.48.1.
- Denial of service via event flooding. A malicious container could flood the eBPF ring buffer (hard-coded to 256 KB), causing the system to silently drop events from other containers. For teams using Inspektor Gadget as part of a security monitoring pipeline, this could allow an attacker to hide activity by generating noise. Fixed in release v0.50.1.
One Low severity finding
- Unsanitized ANSI escape sequences in columns output mode (CVE-2026-25996). When rendering events in the terminal, Inspektor Gadget did not sanitize ANSI escape sequences, allowing a compromised container to inject terminal escape codes into an operator’s display. Fixed in release v0.49.1.
Hardening recommendations
Beyond the specific vulnerabilities, Shielder delivered six hardening recommendations. These are not active exploits — they are areas where the project can reduce its attack surface over time:
- Enforce TLS by default on TCP listeners. When the daemon starts a TCP listener without TLS, it currently logs a warning and continues in plaintext. The recommendation is to require an explicit opt-out flag.
- Pin and verify external dependencies in CI/CD. Several build dependencies were downloaded without hash or signature verification. The project has already landed fixes or has pull requests open for most of these.
- Implement a Kubernetes namespace blocklist to prevent unintended tracing on sensitive namespaces such as kube-system.
- Restrict remote clients from enabling host-level tracing through the daemon, or clearly document the risk.
- Automate third-party vulnerability scanning for project dependencies.
- Reduce RBAC permissions on the DaemonSet pod — specifically the nodes/proxy GET permission, which could be leveraged for privilege escalation if the service account token is compromised.
The maintainers are working through these systematically. Some are already merged; others, notably the RBAC refactor and namespace blocklist, will take more time.
Gadget bypass testing
One of the most technically interesting parts of the audit was the gadget bypass testing. The researchers asked: can a compromised container perform operations that a gadget is meant to trace, without triggering any events? They identified six bypass scenarios, ranging from using newer Linux syscalls that certain gadgets don’t hook (for example, openat2 instead of openat) to evasion through io_uring and statically linked libraries.
These results reflect the cat-and-mouse nature of kernel-level tracing. Linux keeps evolving, new syscalls and subsystems keep appearing, and eBPF-based tracing tools have to keep up. The Inspektor Gadget maintainers have already addressed several of the identified gaps and are documenting the inherent limitations of the approach so operators understand what eBPF tracing can and cannot guarantee.
What this means for users
The actionable step for organizations running Inspektor Gadget is to update to v0.50.1 or later, which includes fixes for all three reported vulnerabilities. Shielder’s own conclusion, from the final report, is that “the overall security posture of Inspektor Gadget is adequately mature from both a secure coding and design point of view.”
For the wider cloud native community, this audit is an example of how the ecosystem is supposed to work. A project reaches a level of adoption where independent security review becomes necessary, OSTIF coordinates a qualified engagement, researchers do the work in the open, maintainers land the fixes, and the full report is published so users can make informed decisions.
Resources
- Inspektor Gadget on GitHub
- Inspektor Gadget release v0.50.1
- OSTIF (Open Source Technology Improvement Fund)
- Shielder
Audit announcement and resources
- Full Report – Downloadable PDF
- Blog post – Inspektor Gadget
- Blog post – OSTIF
- Blog post – Shielder
- Blog post – Microsoft
CVEs
- CVE-2026-24905: Command Injection in ig image build
- CVE-2026-25996: Unsanitized ANSI Escape Sequences

Agentic AI in Adobe Creative Cloud Changes How Designers Work
Adobe’s Firefly AI Assistant, now in public beta, enables agentic workflows that orchestrate complex, multi-step tasks across Creative Cloud applications via natural language prompts.
Deep dive
- Adobe's Firefly AI Assistant orchestrates tasks across Photoshop, Premiere, Lightroom, Illustrator, and Express.
- It uses a Multi-Model Architecture allowing access to over 30 external AI models.
- The system features an Intent-to-Output Compression Model to automate multi-step sequences.
- Personalization layers track user preferences, aesthetic choices, and tool usage over time.
- Frame.io integration allows for an agent-managed review loop with automated feedback application.
- Third-party interoperability enables starting workflows in Anthropic's Claude to execute in Adobe apps.
- Creative Skills allows users to build and sell proprietary workflow automation as intellectual property.
Decoder
- Agentic AI: AI systems that take initiative and autonomously plan and execute multi-step workflows to achieve a user-defined goal, rather than responding to single prompts.
- Creative Skills: Pre-built or custom-defined automated processes in Adobe's ecosystem that perform specific creative tasks like batch editing or mockup creation.
- Frame.io: A cloud-based review and collaboration platform used for video and image feedback, integrated here for agent-managed stakeholder communication.
Original article
Full article content is not available for inline reading.

How we made continuous trace intelligence possible at scale
Braintrust founder Ankur Goyal introduced Topics, an intelligence layer designed to analyze massive, unstructured production agent traces at scale.
Decoder
- Trace: A record of the sequence of operations or calls made by an agent, useful for debugging and monitoring execution paths.
Original article
Braintrust founder Ankur Goyal lays out Topics, the intelligence layer for analyzing production agent traces at scale where million-token traces with hundreds of spans break every standard NLP tool that expects uniform document shapes. Inspired by Anthropic's Clio paper, the pipeline runs preprocess to facet to embed to cluster to name to classify, with the LLM summary doing the one job that makes the rest tractable since the raw trace never has to fit in an embedding model's context window.
Ollama Model Tester (GitHub Repo)
Ollama Model Tester is a lightweight, dependency-free Python CLI for comparing local LLM responses side-by-side using repeated prompt runs.
Original article
A small, dependency-free CLI for running the same prompt against your local Ollama models and saving every response to disk — so you can compare models (or compare repeated runs of one model) side by side.
It uses only the Python standard library: no pip install required.
Requirements
- Python 3.7 or newer
- Ollama running locally (the default
http://localhost:11434) - At least one model pulled, e.g.
ollama pull llama3.1:8b
Quick start
Make sure Ollama is running, then:
python3 ollama_model_test.py
You'll be asked, in order:
- Which model to use (pick a number from your installed models)
- The prompt — type as many lines as you like, then put
/doneon its own line to finish - How many times to run the prompt
- Temperature (
0.0–2.0), or press Enter to use Ollama's default - Whether to stream the responses live to the terminal
It then runs the prompt the requested number of times and writes the results under ollama-runs/.
Command-line flags (optional)
Every prompt above can be supplied up front, which makes the tool scriptable. Anything you omit is still asked interactively.
--model NAME: Local model to use (must already be installed)--runs N: Number of generations to run--temperature T: Temperature,0.0–2.0--prompt-file PATH: Read the prompt from a UTF-8 text file--stream/--no-stream: Stream responses live, or don't
Example — run a saved prompt three times, fully non-interactive:
python3 ollama_model_test.py \
  --model llama3.1:8b \
  --prompt-file prompt.txt \
  --runs 3 \
  --temperature 0.7 \
  --no-stream
Output
Results are grouped into one folder per prompt:
ollama-runs/
  what-are-the-main-tradeoffs-between_835562a4/
    prompt.md         # the prompt, with its hash and timestamp
    metadata.json     # every run against this prompt (model, timing, options)
    llama3.1-8b.md    # responses + Ollama metadata for this model
    gemma3-1b.md
The folder name is the first few words of the prompt plus a short hash of the full prompt. Because the folder is keyed on the prompt, running the same prompt against a different model drops its output into the same folder — making model-to-model comparison easy. Each model's file records every run's response alongside Ollama's run metadata (token counts, timings, and so on).
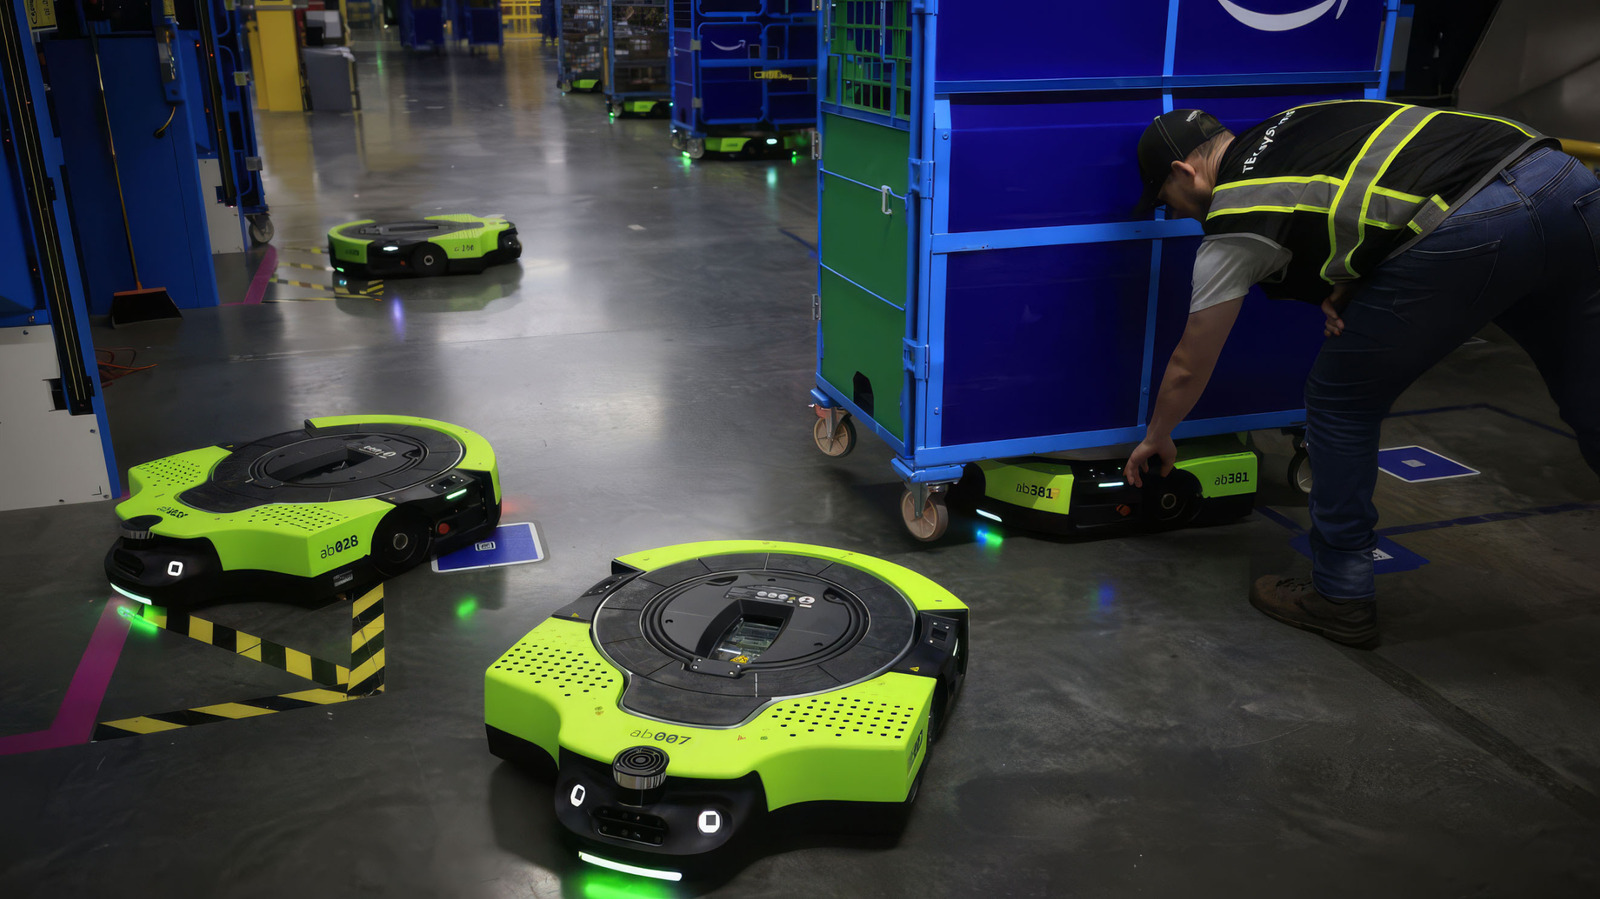
Amazon's New Proteus Warehouse Robot Is Fully Autonomous
Amazon is deploying a new AI-powered version of its Proteus warehouse robot that employees can command using plain conversational language.
Original article
Amazon's new Proteus warehouse robot is fully autonomous
Employees can direct it using plain conversational language.
Amazon has put more than a million robots into its warehouses but none so far have been able to "talk" with human employees. However, a new version of its Proteus robot can now be directed by workers using plain language thanks to an AI upgrade, Amazon announced. "You tell it what needs to be done. It figures out the priority, the route, the timing," said Amazon Robotics VP Scott Dresser.
Proteus looks like a heavy-duty Roomba and is designed to move heavy carts and cover long distances within fulfillment centers. Before, commanding such robots required the use of custom software. Now, employees can assign tasks to the latest AI-powered models using plain language, much as they would with another employee.
The extra intelligence also allows the system to work all around warehouses rather than just in the dock areas as before. That means they can be used to transport containers arriving on site, transfer them between workstations and assist employees.
Amazon is piloting the new system in its labs, but plans to start using them in Europe in the first half of 2027. It also plans to expand the use of its Vulcan touch-sensitive robot and introduce another one for handling "totes" (smaller containers) with precision, called Stark.
Amazon says that the new Proteus robots will help employees "focus on higher-skilled work like managing inventory flow and ensuring quality control." It added that such systems improve safety and reduce repetitive work. At the same time, Amazon said it hasn't replaced human jobs and announced plans to expand its European warehouse workforce by 25,000 in the coming years. "Since introducing robotics into its operations, Amazon has hired hundreds of thousands of employees globally," the company wrote.
However, Amazon has also laid off nearly 30,000 workers over the past year or so across its retail, web services, Prime Video and other units. The company doesn't have a stellar track record in the area of safety, either. In 2024, the company employed 39 percent of US warehouse workers but accounted for 56 percent of serious injuries, the Strategic Organizing Center reported last year.

The skeptic's guide to humanoid robots going viral on the Internet
Viral humanoid robot demonstrations often mask the reality that these machines struggle with generalization beyond controlled stage environments.
Deep dive
- Humanoid appearance triggers anthropomorphic bias, causing viewers to overestimate general capabilities.
- Real-world capability requires generalization across varied inputs (e.g., handling any bottle/glass combination) rather than repeating a single task.
- Most viral demos are highly controlled or pre-programmed; look for disclosures regarding playback speed or human intervention.
- Quantitative, large-scale field evaluations remain the gold standard for proving real-world readiness.
Decoder
- Teleoperation: Operating a device remotely, often where a human operator mimics movements or controls the robot directly, which is frequently used to make robots appear autonomous in marketing demos.
Original article
It may appear that humanoid robots capable of handling any task have almost arrived—especially when tech companies showcase them performing acrobatic feats or handling household chores. But there is still a significant gap between these robot demonstrations and proving that the same robots can reliably and repeatedly manage such tasks in the real world.
The latest wave of robot videos can be particularly tricky, given the human tendency to anthropomorphize objects with a humanoid figure. A robot arm doing a dance move may simply seem “cool,” but a humanoid robot doing the same dance move can trigger more misleading assumptions, said Jonathan Hurst, cofounder of Agility Robotics and a robotics researcher at Oregon State University.
“People automatically extrapolate and assume that the robot that looks like a person can do all the things that a person who can dance could do—which is not true,” Hurst told Ars. “But a lot of the startup companies do kind of prey on that for being able to raise a lot of money.”
One of the biggest challenges is developing robots that can generalize their skills across many different conditions and environments in the same way that humans can, said Sergey Levine, a computer scientist at the University of California, Berkeley, and cofounder of the AI and robotics company Physical Intelligence. But that degree of generalization is practically impossible to capture within a single robot demonstration.
“Maybe the robot can pour a glass of wine, but can it pour it out of any bottle and into any glass in any environment?” Levine said. “That’s actually a lot harder than having a robot do a backflip in one stage demo.”
The real measure for robotic capabilities involves conducting “quantitative, large-scale evaluations” in real-world environments, Levine explained. “There’s always a gap between the kind of things that somebody can show in a demo and what the real capability of the robot is,” he said.
What to watch out for
There are several things to keep in mind when watching the surge of robot demonstration videos and even livestreams. First, such robotic demonstrations are not necessarily indicative of robots operating autonomously without human control or oversight, said Dipam Patel, a PhD candidate in computer science at Purdue University and a research assistant at the US Army DevCom Army Research Lab. Many demonstrations still rely on human operators directly controlling the robots’ actions through teleoperation.
“Unless a research paper or a company is explicitly mentioning that [the robot] is completely autonomous, you should take it with a very big pinch of salt,” Patel, also an IEEE Graduate Student Member, told Ars.
Another question to consider is whether the demonstration shows robots tackling a completely new test environment for the first time, or whether the robots are simply repeating a task they had already learned to do in that specific training environment. The new test environment would be significantly more impressive at showcasing robots capable of doing tasks autonomously in a generalized way, Patel said.
It is also worth checking the video playback speed for any robot demonstration, because “usually the robots are very slow” for safety and other reasons, Patel said. Companies may sometimes disclose that a robot demonstration video is running at two times or four times normal speed—meaning the robot could be taking twice as long or four times as long as a human to do the same task.
Robot demonstration videos can also vary wildly in their informative value and transparency. Some are clearly intended to be performative entertainment clips that can go viral on social media, or polished promotional videos from companies seeking new clients and investors. Others may provide more of a behind-the-scenes look at the robot training process while acknowledging robot mistakes along the way.
But even if a robot demo video appears incredibly impressive and authentic while coming from a more reputable company or research lab, just keep in mind that it’s still a small glimpse of the bigger picture. The real indicators of progress in robotic capabilities are not so easily packaged for Internet audiences.

Code is Cheap(er)
In the era of cheap AI-generated code, the most valuable engineers are becoming 'subtractive sculptors' who focus on simplifying systems and pruning unnecessary complexity.
Deep dive
- LLMs have fundamentally lowered the cost of code production, making writing less valuable and understanding more expensive.
- AI-generated code lacks the 'mental overhead' of human-written code, leading to dangerous, unreadable complexity.
- Compilers are deterministic and constrained, whereas LLMs are unpredictable and unbounded, making comparison between them a category error.
- The 'subtractive' engineer focuses on keeping systems minimal and removing unnecessary boundaries to combat complexity 'rot'.
Original article
Code is Cheap(er)
There is no getting around the fact that, in the last year, code has gotten much cheaper to create. AI is able to generate reams and reams of code, often of reasonably decent quality, incredibly quickly. There is no point in pretending that this isn’t the case.
At times, when confronted with this admittedly uncomfortable fact, I have seen people I respect say something like “coding was never the problem.”
While I appreciate the sentiment, I don’t completely agree with that: certainly coding was at least part of the problem.
And that part of the problem has shrunk significantly with the advent of effective AI coding tools.
So what does raw coding becoming less important mean for software developers, people who, in the past, prided themselves (and often compared themselves) on their ability to code?
Understanding is Expensive(er)
One thing I see is that it means that understanding code has become more expensive. This is because when reams and reams of code are generated, rather than emerging painfully from a particular programmer’s fingers, there is no understanding of that code.
In as much as understanding that code needs to exist, it has to be done after the code is written, by reading the code.
Note that conventional wisdom is that reading someone else’s code is harder than writing your own code.
Some AI enthusiasts say “Who cares, you don’t understand the output of compilers.”
I think that is a category error for multiple reasons:
- Compilers are deterministic; LLMs are, by design, not
- Compiler workflows retain their original source code; LLM workflows typically do not
- Compiler output is to a narrowly constrained domain (machine code); LLM output is not (generalized software)
I maintain that, in most cases and certainly for mission-critical software, developers still need to understand the underlying code even if it is generated by an LLM.
And if code is generated by an LLM there is a stark danger: the LLM can produce code far faster than you, or anyone else, can understand it. This is why I recommend incremental use of LLMs rather than allowing them to generate massive changelists that neither you, nor anyone else, can understand.
(There are times when this can be appropriate, such as in a mechanical refactor, but it is extremely dangerous when new semantics are being introduced into a code base.)
The Sorcerer’s Apprentice Trap
One movie scene that has been consistently coming back to me as I have watched AI garner more and more attention is The Sorcerer’s Apprentice from Disney’s movie Fantasia.
In this scene the apprentice decides to use magic to assist in the drudgery of cleaning. He enchants a broom which then proceeds to start cleaning things up. Things appear to be going swimmingly for a while, until the broom starts cleaning more and more vigorously, reaching a point where things start going swimmingly literally.
The chaos is resolved when the Sorcerer reappears and asserts control over the situation, glaring at the apprentice for his foolishness.
This seems like an apt metaphor for the AI era: you want to be a sorcerer and not an apprentice.
And a sorcerer has to understand the code.
Complexity: Still Bad
Humans, generally, have a poor grasp of geometric and exponential curves.
(This is why they believe in fairy tales such as compound interest.)
The core danger of code being cheap is complexity, which I assert, without proof, tends to grow at least geometrically and often exponentially with the size of a system.
Before LLMs there were prolific human coders.
Perhaps you have worked with one: they can write a lot of code.
I have seen prolific coders who lack a proper fear of complexity heap more and more code on top of an existing problem until the whole system collapses into an unmodifiable steady state, where any change creates as many bugs as it fixes.
LLMs are incapable of fear of complexity, and are prolific coders.
Seems dangerous to me.
The Subtractive, Constraining Engineer
To address this danger of LLM-generated code, I propose the subtractive, constraining engineer:
This engineer says no, closely examines LLM output, suggests simplifications and generally retains a firm hand when dealing with LLM-generated code.
Rather than priding themselves on the code they create, they pride themselves on the code (and layers) they remove from or prevent from entering systems.
This ethos is more sculptor and less builder.
Where the builder ethos still applies, to an extent, is at the system design level: a good engineer will need to know how to compose components effectively to create systems. However, even here, I think that the subtractive mindset will be useful: removing unnecessary components and system boundaries to simplify system deployment and inter-component interactions, etc.
The subtractive engineer is a different kind of engineer than most coders have been in the past. I will admit that I have always been sympathetic to the subtractive engineer mindset: I don’t mind saying no, I don’t mind polishing existing systems rather than heroic rewrites, etc.
But, admitting my own biases, I believe this approach is a productive way to engage with LLMs that retains the art of computer programming and properly acknowledges a dual reality: code has gotten much cheaper to create and complexity remains our apex predator.

VoidZero is joining Cloudflare
Cloudflare has acquired VoidZero, the startup behind Vite, to secure and steer the foundational tooling for the entire modern JavaScript ecosystem.
Deep dive
- Acquisition: Entire VoidZero team joins Cloudflare, which will now provide long-term funding and engineering resources.
- Ecosystem commitment: $1 million pledged to the Vite ecosystem fund to support independent maintainers.
- Strategy: Cloudflare is 'moving Cloudflare toward Vite' rather than moving Vite toward Cloudflare, making Vite the core of their platform interface.
- AI impact: The surge in agent-generated code has necessitated faster, more consistent build tools like Oxc and Vitest, which are now being integrated into the Cloudflare platform.
Decoder
- Vite: A popular build tool that provides a fast development environment and optimized production builds for web applications.
- Vendor-agnostic: Software that is not tied to a specific cloud provider or platform, allowing it to run anywhere.
- Workerd: Cloudflare's open-source, standards-compliant JavaScript/Wasm runtime that powers their serverless platform.
Original article
VoidZero is joining Cloudflare
VoidZero, the company behind Vite, Vitest, Rolldown, Oxc, and Vite+, is joining Cloudflare. As part of this change, all team members of VoidZero are joining Cloudflare, too.
Before saying anything else, we want to make the most important thing clear: Vite, Vitest, Rolldown, Oxc, and Vite+ will stay open source, vendor-agnostic, and community-driven. Nothing about that changes.
Cloudflare's mission is to help build a better Internet. And a better Internet is an open Internet. Developers need choice, frameworks need a neutral foundation, and applications need to be portable. It is not reasonable to expect the entire web ecosystem to build around a single vendor. The most important tools and frameworks are portable by design.
Vite is one of the few foundational tools that the whole JavaScript ecosystem agrees on. It earned that position by being fast, excellent, portable, and vendor-neutral. One of the best ways Cloudflare can help build a better Internet is by investing in that foundational open source toolchain. A toolchain that makes the Internet better for everyone, not just people who use Cloudflare or choose to host with us.
Over the last few years we've invested heavily in making Cloudflare the best place to build and run websites, applications, and agents on our developer platform. But ultimately that choice will always be yours. Run your Vite application anywhere you want.
What this means for Vite
Today's news gives Vite more resources to keep growing, while the things that make Vite what it is remain the same:
- Vite remains MIT-licensed and open source.
- Vite remains vendor-agnostic. Applications built with Vite run anywhere and will continue to do so.
- Vite's roadmap continues to be driven by the broader Vite team and community, and continues to be developed in the open.
- Evan and the rest of the VoidZero team continue to lead Vite, Vitest, Rolldown, Oxc, and Vite+.
- Cloudflare is committing engineering and resources to those projects, not redirecting them.
We made the same kind of commitment when Astro joined Cloudflare earlier this year. Astro is still open source, and still deploys anywhere. The team is still shipping the roadmap they were already shipping.
This commitment matters even more with Vite, because Vite is not one framework. Vite is the foundation underlying so many: Vue, SvelteKit, Nuxt, Astro, Solid, Qwik, Angular, React Router, TanStack Start. Even Next.js now has a Vite-based implementation in vinext. Vite has become a shared foundation for the JavaScript ecosystem.
Our number one goal is to maintain the trust that has earned Vite so much adoption. Not with our words here, but by proving it every day in how we support and develop these projects.
We also want to put our money where our mouth is when it comes to our support for open source and shared ecosystem foundations. As part of this announcement, Cloudflare is committing $1 million to a Vite ecosystem fund to support maintainers and contributors, administered by the Vite core team. Vite is bigger than VoidZero or Cloudflare, and the people who have helped build it should be part of what comes next.
Vite as the foundation
The Vite and Cloudflare teams have been collaborating well before this announcement, starting in 2024 with the Vite Environment API. The Environment API lets Vite run server code in something other than Node.js during development. We worked closely with the Vite team on its design, and then built the Cloudflare Vite plugin on top of it.
When you run vite dev with the Cloudflare plugin, your server code runs inside workerd, the same open-source runtime that powers Workers in production. Durable Objects, D1, KV, R2, Workflows, Workers AI, Agents, Service Bindings, Workers RPC – all of it runs locally inside the same runtime model as production.
For a long time, the cost of developing on a non-Node runtime was that local dev felt like a worse version of production. The Environment API removed that cost without forcing anyone to adopt a Cloudflare-specific dev server. Any runtime that wants to plug into Vite can do the same thing. That kind of design – a generic mechanism in Vite with provider-specific implementations – has proven to work well and is one we want to keep building on.
Vite's adoption curve is one of the more remarkable things to watch in the ecosystem right now. As of this writing, Vite is at roughly 129M weekly downloads. The Cloudflare Vite plugin (@cloudflare/vite-plugin) is at almost 14M weekly downloads.
If you had told us a year ago that a Cloudflare Vite plugin would reach downloads equivalent to more than 10% of Vite itself, we wouldn’t have believed you. What happened? AI happened. More software is being created than ever before, and a lot of it starts with AI-generated code. Those applications need a default stack and a place to run. Agent-coded applications are choosing Vite, and increasingly they are choosing Vite running on Cloudflare.
AI is changing how we write software
Developers used to be the only users of dev servers, bundlers, linters, formatters, and CLIs. That is no longer true: agents are using them too, constantly. They scaffold projects, run dev servers, read errors, write tests, lint and format code, deploy previews, and iterate.
A lot of AI-generated applications already start as Vite apps, because Vite is fast, well understood, and broadly compatible with what agents have seen in their training data. Fast feedback loops have always been important. They become even more critical when writing software with agents:
- Fast builds, because they iterate more than humans do.
- Fast tests, because they re-run the suite constantly to verify their own work.
- Fast linting and formatting, because those tools become guardrails.
- Clear, structured errors, because the agent has to read and act on them.
- Consistent CLIs, because small inconsistencies cause big detours.
The entire VoidZero toolchain is built for this kind of loop. Vitest, Rolldown, Oxc, Oxlint, and Oxfmt are each among the fastest tools in their respective categories, and they work well when they are run over and over by an agent. Vite+ brings those pieces together into one toolchain, with one CLI, one configuration model, and fewer moving parts. That makes the development loop easier for people to understand, and easier for agents to drive reliably.
We are dogfooding this ourselves. The Cloudflare dashboard is built on Vite. Oxlint is already saving days of engineering time in Cloudflare codebases. Flue, the agent harness framework from the Astro team, is also moving onto Vite as its foundation. Flue can run agents on Node.js, Cloudflare Workers, GitHub Actions, GitLab CI/CD, and more, and the Cloudflare target now uses the official Cloudflare Vite plugin and workerd integration. Vite is becoming the default application foundation inside Cloudflare too.
Vite is becoming full-stack
A few years ago, the job of a build tool was straightforward: take source files, produce a bundle, hand it off. That is not enough for modern applications, especially in a world where some of those applications are agents themselves.
A modern application is server-rendered routes, APIs, background jobs, queues, databases, object storage, real-time, auth, plus a growing list of agents and AI capabilities. The "build" is no longer the end of the story. It is the start of a deployment that has to understand all of those pieces.
That means Vite has to become more than a build tool. It needs to understand more of the application, while staying true to what made Vite work in the first place: speed, simplicity, and portability.
Void, a deployment platform designed for Vite, has been another testbed for these ideas. It helped explore what a modern application framework should own, what deployment should feel like, and how much of the full application lifecycle can be unified around one toolchain. We have learned a lot from that work.
Now the work is putting those lessons in the right place. Some belong in Vite itself as provider-agnostic primitives: first-class abstractions and hooks for backends, APIs, agents, and deployment that any provider can implement. Other lessons belong inside Cloudflare. Cloudflare will provide a first-class implementation of those hooks on Workers and the rest of our Developer Platform.
Even though some Vite maintainers are joining Cloudflare, changes to Vite itself will continue to go through the same open contribution process as any other Vite contribution. Features added to Vite itself should not be Cloudflare-specific. They will work anywhere Vite works.
Moving Cloudflare toward Vite
The same principle shaped how we think about the future of Cloudflare's own tooling. We are not moving Vite in the direction of Cloudflare. We are doing the opposite: moving Cloudflare's application tooling onto Vite, so it is built on top of the same workflows developers already know.
We recently shipped a technical preview of cf, a new unified CLI for the whole Cloudflare platform. Vite is going to be the foundation of our CLI experience for applications. The end goal is one consistent CLI for all of Cloudflare, with the same ergonomics whether you are working on Workers, R2, D1, Agents, or anything else.
If we do this right, the Cloudflare CLI should feel like Vite, not like a separate thing bolted on next to Vite.
cf devshould be a superset ofvite dev. Same speed, same hot module replacement, same plugin model, plus the Cloudflare runtime and bindings when you want them.cf buildshould understand Vite projects natively, without an adapter dance.cf deployshould make deploying a Vite app to Cloudflare simple.
If you are running Vite today, the path to Cloudflare will feel like swapping in a superset of the commands you already know. Same project shape. Same Vite workflows. The entire Cloudflare developer platform available when you want it.
What happens next
In the short term, nothing changes for Vite users or the frameworks building on top of Vite:
- Vite, Vitest, Rolldown, Oxc, and Vite+ keep shipping. The VoidZero team keeps contributing and leading them.
- The Cloudflare Vite plugin keeps improving.
- The Environment API and the broader story of "run your server code in the right runtime locally" keeps getting better, including for non-Cloudflare runtimes.
Longer term:
- We start the work on moving the Cloudflare CLI toward an experience built directly on top of Vite.
- Vite will get new, clean, provider-agnostic primitives for full-stack apps and agents that work for everyone on any platform.
- Over time, we intend to open-source the Void platform, so others can learn from it and build their own platforms on top of Vite and Cloudflare.
We will do all of this in public and with the community. The same way Vite has always been built.
Welcome VoidZero
Vite, Vitest, Rolldown, Oxc, and Vite+ exist because a deep ecosystem of open source contributors put years of work into them. These projects are already foundational to how the web is built, and we are grateful to everyone who helped get them here. Thank you to everyone who has contributed code, reviews, issues, docs, plugins, integrations, and support along the way.
We are excited to welcome the VoidZero team to Cloudflare, and excited to put more resources behind these projects. Our job now is to help them grow, stay open, and power the JavaScript ecosystem for everyone.
Vite keeps being Vite. Cloudflare gets to help.
If you want to try Vite on Cloudflare today, run:
npm create vite@latest
npx wrangler deploy

Introducing the GKE standby buffer: Improve node startup times without blowing your budget
GKE standby buffers reduce node startup latency during traffic spikes by keeping pre-initialized, suspended nodes ready to resume in seconds.
Deep dive
- Standby buffers store node state to disk, releasing expensive compute and memory resources.
- Nodes remain fully initialized with DaemonSets to eliminate long provisioning cycles.
- Active buffers handle immediate spikes; standby buffers resume as a secondary, faster layer.
- The system automatically prioritizes refilling active buffers using standby capacity.
- Replaces complex manual workarounds like low HPA thresholds or balloon pods.
- Provides a declarative API via the 'CapacityBuffers' resource.
- Simulator tool available at github.com/gke-labs/buffers-simulator to predict performance and costs.
Decoder
- Balloon pod: A low-priority dummy pod used to reserve cluster space, ensuring higher-priority pods can preempt it immediately during spikes.
- Cold start: The latency delay incurred when an application must initialize or a new node must be provisioned before handling requests.
Original article
Introducing the GKE standby buffer: Improve node startup times without blowing your budget
Application owners and platform engineers have long faced a difficult choice: spend excessively by over-provisioning to guarantee quick startups, or minimize costs but endure slow cold starts.
We are excited to announce a solution to this compromise: Google Kubernetes Engine standby buffers. This builds on the launch of GKE active buffers earlier this year, a native version of the Kubernetes CapacityBuffers API that makes it easy to provision readily available capacity to handle traffic spikes, delivering near-zero startup latency for new pods. However, active buffers still impose a trade-off between performance and cost. New GKE standby buffers help by maintaining a low-cost, suspended capacity buffer for your GKE clusters. With a cost overhead in the low single-digit percent, GKE standby buffers help you achieve near-immediate scheduling for your workloads with negligible cost overhead. This is useful for all kinds of workloads — general-purpose, agentic, and everything in between.
Under identical traffic loads, the cluster without standby buffers suffered severe latency spikes, with P50, P95, and P99 metrics trapped between 4 and 6 minutes. Conversely, the cluster with standby buffers maintained a P50 latency of just single-digit seconds, while its P95 and P99 metrics briefly peaked at one minute before quickly normalizing to single-digit seconds. Both setups exhibited a similar allocatable core cost, making the buffered approach far more efficient.
The problem: High costs and latency
Traditionally, autoscaling with standard Kubernetes has been effective but slow. Traffic surges or batch jobs require cluster autoscalers to provision fresh nodes, leaving Pods in a pending state. To circumvent delays, you have to resort to clunky workarounds like lowering your Horizontal Pod Autoscaler (HPA) thresholds or managing so-called balloon pods. These workarounds are expensive:
- Managing balloon pods is operationally complex, requiring manual configuration and ongoing maintenance of priority classes and resource requests to ensure they function correctly.
- Lowering the HPA threshold adds empty (wasted) space that linearly scales with the size of the node pool.
Both GKE active and standby buffers allow capacity to be defined declaratively, removing the need for clunky and operationally heavy workarounds.
In addition, GKE standby buffers lower infrastructure costs by storing the node’s state to disk, releasing compute and memory costs and keeping only persistent disk and IP address costs. Then, combined with an active buffer, you can achieve near-instant pod scheduling that has similar performance to over-provisioning, but at a very affordable price.
Active and standby buffers working together
All GKE capacity buffers operate on a principle similar to video streaming on platforms like YouTube. By proactively attempting to provision and manage available capacity ahead of impending demand (much like pre-downloading video content) GKE helps to ensure that resources are readily available when they’re needed.
With today’s launch, the two types of capacity buffers can work in harmony:
- Active buffer: Cluster Autoscaler works to reserve enough capacity for a predefined amount of pods on existing cluster nodes, and, if needed, provisions extra nodes. Select this ready-to-use buffer to provide capacity to your most latency-sensitive workloads.
- Standby buffers: Nodes are pre-provisioned and fully initialized with necessary components like Kubernetes DaemonSets, and given time to preload images, but are then suspended, while the underlying compute capacity is released to save costs. When demand spikes, these nodes resume 2-3x faster than creating a fresh node, bridging the gap between cold starts and always-on capacity.
The active buffer covers the initial spike until standby buffers resume. The system prioritizes refilling the active buffer from the standby buffer. The standby buffer handles an extended load and protects against slower node cold starts. As standby buffers refill, they initially kick into an active state for a configurable amount of time before they are suspended, providing a boost of active capacity during sustained traffic loads.
Early benchmarks
In our tests, using standby buffers enabled us to deliver sub-second Agent Sandbox scheduling latency for up to 90% lower cost compared to complete overprovisioning.
Optimized for business needs
Businesses are under constant pressure to optimize resource consumption while streamlining operations. Recognizing that organizations need smarter tools to manage sporadic and spikey workloads, we worked hard to deliver standby buffers quickly. Now, whether you’re running agents, batch jobs, CI/CD pipelines, game servers, or spiky workloads, GKE capacity buffers allow you to dynamically balance performance and cost. You can finally define your "insurance policy" against traffic spikes without paying a high premium for it. With GKE standby buffers you can:
- Circumvent cold starts: Nodes suspended by standby buffers resume 2-3x faster than provisioning fresh nodes, reducing pod scheduling latency during traffic spikes and sustained traffic load.
- Enjoy lower costs: A standby buffer incurs a fraction of the cost of active capacity because the underlying VM is suspended. You pay for storage and an IP address, rather than for full compute-hours.
- Gain declarative control: Replace complex balloon pod workarounds with the simple, native declarative CapacityBuffers API, explicitly stating how much headroom you need, and letting GKE handle the rest.
“Using GKE standby capacity buffers has lowered our time-to-ready from several minutes to 30 seconds at a very affordable price.”
- Pedro Spagiari, Chief Architect at Unico
Get started
Ready to improve your performance and save on costs?
- Start by defining a
CapacityBufferresource in your cluster to specify your target buffer size. - Try balancing between standby buffers to reduce pod scheduling latency for sustained loads, and active buffers to address immediate unpredictable capacity needs.
Let’s look at an example of how to configure buffers for a Deployment while also using custom ComputeClasses.
Basic setup
Beginning with some basic setup, create a namespace:
apiVersion: v1
kind: Namespace
metadata:
  name: my-namespace
Then, create a custom ComputeClass (optional):
apiVersion: cloud.google.com/v1
kind: ComputeClass
metadata:
  name: my-ccc
  namespace: my-namespace
spec:
  # Buffers will also be created according to these priorities
  priorities:
  - machineFamily: n4
  - machineFamily: n4d
  - machineFamily: c4
  - machineFamily: c4d
  nodePoolAutoCreation:
    enabled: true
Define the buffer unit size
You can use a PodTemplate as a reference for the buffer unit size. You can also create a buffer for a specific deployment or any object that defines scale subResource.
# Defines the resource requirements for one unit of buffer.
apiVersion: v1
kind: PodTemplate
metadata:
  name: my-buffer-unit-template
  namespace: my-namespace
template:
  spec:
    terminationGracePeriodSeconds: 0
    tolerations:
    # Optional: Ensures buffer pods can land on any node.
    - key: "node-role.kubernetes.io/master"
      operator: "Exists"
      effect: "NoSchedule"
    containers:
    - name: buffer-container
      image: registry.k8s.io/pause:3.9
      resources:
        requests:
          cpu: "1"
          memory: "1Gi"
        limits:
          cpu: "1"
          memory: "1Gi"
      # Optional: Using buffers with a custom ComputeClass /
      # controls the properties of the nodes GKE provisions.
      nodeSelector:
        cloud.google.com/compute-class: my-ccc
Create buffers
Lastly, create a CapacityBuffer object by referring to our PodTemplate. Here, you create a standby buffer of 50 CPUs and 50 GB of RAM:
apiVersion: autoscaling.x-k8s.io/v1beta1
kind: CapacityBuffer
metadata:
  name: my-standby-buffer-resource-limits
  namespace: my-namespace
  annotations:
    # Optional: Time after which buffer nodes are suspended.
    # Default is 5 minutes.
    buffer.gke.io/standby-capacity-init-time: "5m"
    # Optional: Time after which standby buffers are recreated.
    # Default is 1 day, "never" avoids refreshing.
    buffer.gke.io/standby-capacity-refresh-frequency: "1d"
spec:
  podTemplateRef:
    name: my-buffer-unit-template
  # The desired state is 20 standby buffer units.
  # When a standby buffer gets used, a new one gets created.
  limits:
    cpu: "50"
    memory: "50Gi"
  provisioningStrategy: "buffer.gke.io/standby-capacity"
And an active buffer of seven 5 CPUs and 5 GB of RAM (optional):
apiVersion: autoscaling.x-k8s.io/v1beta1
kind: CapacityBuffer
metadata:
  name: my-active-buffer-resource-limits
  namespace: my-namespace
spec:
  podTemplateRef:
    name: my-buffer-unit-template
  # The desired state is 2 active buffer units.
  # When an active buffer gets used, a new one gets created.
  limits:
    cpu: "5"
    memory: "5Gi"
  provisioningStrategy: "buffer.x-k8s.io/active-capacity"
Finally, apply the above objects to your cluster. That’s it!
Now, any existing and future deployments that can schedule on the space reserved by the buffers will benefit from faster pod scheduling latencies.
Test the buffers
You can check on the status of your buffers. In Kubernetes, suspended nodes can be identified by condition Suspended.
kubectl get nodes -o custom-columns='NAME:.metadata.name,SUSPENDED:.status.conditions[?(@.type=="Suspended")].status'Expect the following kind of output, and wait for the standby buffers to get suspended.
NAME                                            SUSPENDED
gke-my-cluster-nap-n4-standard-8-k960-...-ffbx  False # Node has been resumed.
gke-my-cluster-nap-n4-standard-4-k960-...-h2x4  <none> # Node was never suspended.
gke-my-cluster-nap-n4d-standard-8-1cip-...-74jf  True # Node is suspended.
To test the buffers, create a deployment and scale it.
apiVersion: apps/v1
kind: Deployment
metadata:
  name: my-deployment
  namespace: my-namespace
spec:
  replicas: 1
  selector:
    matchLabels:
      app: my-deployment
  template:
    metadata:
      labels:
        app: my-deployment
    spec:
      containers:
      - name: busybox
        image: busybox
        command: ["sleep", "inf"]
        resources:
          requests:
            cpu: "500m"
            memory: "500Mi"
      # Optional: Using buffers with a custom ComputeClass /
      # controls the properties of the nodes GKE provisions.
      nodeSelector:
        cloud.google.com/compute-class: my-ccc
Scaling this deployment to two replicas allows them to be assigned to the active buffer for immediate scheduling. The active buffer is then immediately refilled from the standby buffer. Simultaneously, the standby buffer initiates the provisioning of new nodes.
If you further scale the deployment to 50 replicas, scheduling all of them on the standby buffer occurs once the nodes resume. New nodes provisioned to refill the standby buffer briefly function as active buffers providing a temporary active standby boost. Therefore, when further scaling the deployment to 100 replicas during this time, you may notice that new replicas benefit from immediate scheduling.
GKE standby buffer best practices
- Define standby buffers that are sufficient to cover the extended load you expect to encounter, so that buffers can refill in the background from a cold start. A sufficiently sized standby buffer can drop your max pod scheduling latency to the time it takes to resume a node — around 30 seconds.
- When the buffer starts to get used and is refilled, new buffer nodes initially swing into an active state prior to suspending. This helps to boost active capacity during a prolonged load.
- If your application requires the lowest possible pod scheduling latency, define an active buffer size that is sufficient to cover any initial spikes you expect to encounter until standby buffer nodes are able to resume. The system prioritizes refilling the active buffer by consuming the standby buffer. A sufficiently sized active buffer and a sufficiently sized standby buffer can help you achieve one-second pod scheduling latency for a fraction of the cost of overprovisioning.
- Experiment with different buffer sizes to get the best result for your workload.
To help, we created a simulator to help with sizing the buffers to achieve your performance targets, available at https://github.com/gke-labs/buffers-simulator.
Try it yourself!
Active and standby buffers in GKE provide a native solution for low-latency and cost-effective workload scaling by maintaining warm and standby capacity buffers. By circumventing slow node cold starts, buffers help performance-critical applications handle sudden traffic spikes. This feature replaces complex manual workarounds like balloon pods with a simple, declarative API, and allows for fixed, percentage-based, or resource-limited buffering strategies to help maintain strict service-level objectives cost-effectively and without over-provisioning for peak.
Standby buffers are available for GKE clusters running version 1.36.0-gke.2253000 or later. To get started with buffers, check out the documentation.
Build an EKS Environment Factory with Pulumi and vCluster
Deloitte saved 500 QA hours annually by consolidating dozens of EKS clusters into a virtualized, ephemeral 'Environment Factory' using vCluster.
Deep dive
- Host cluster uses EKS Auto Mode for automated infrastructure scaling.
- Tenant environments run as virtual control planes (vCluster) inside standard pods.
- Pulumi orchestrates the host cluster and tenant-specific resource quotas/RBAC.
- Syncer maps virtual resources to the underlying host cluster APIs.
- Deleting a Pulumi stack ensures automatic cleanup of tenant namespaces and ephemeral artifacts.
- Essential for feature-branch environments where environment sprawl causes cost and lag.
Decoder
- vCluster: A tool that allows running multiple virtual Kubernetes clusters inside a single host cluster.
- EKS Auto Mode: A simplified Amazon EKS operation mode that automates infrastructure management, including node provisioning and scaling.
Original article
Build an EKS Environment Factory with Pulumi and vCluster
AWS reports in an AWS Architecture Blog case study that Deloitte’s move to a virtual cluster model on Amazon EKS resulted in 89% faster testing environment provisioning. By consolidating dozens of disparate clusters into a single host cluster with over 50 vCluster instances, the case study says Deloitte saved about 500 QA hours per year. This “Environment Factory” pattern allows platform teams to provide isolated, ephemeral Kubernetes environments on demand without the cost or lag of full cluster provisioning.
This post adapts that general architecture with Pulumi to orchestrate Amazon EKS Auto Mode and vCluster.
The problem: environment sprawl and provisioning lag
Traditional development workflows often rely on one full EKS cluster per developer or feature branch. While this provides strong isolation, it introduces major pain points. Provisioning a full cluster can take 15 minutes or more, which slows down CI/CD pipelines. Managing dozens of clusters also leads to high costs and significant operational overhead.
Platform teams need a “soft multi-tenancy” model. This model should feel like a dedicated cluster to the developer but run on shared infrastructure to keep costs low and startup times fast.
Architecture overview: the host and the tenants
The environment factory architecture consists of two main layers.
- Host cluster: A single, reliable EKS cluster managed with EKS Auto Mode. This cluster provides the underlying compute, networking, and storage.
- Tenant environments: Virtual clusters (vCluster) running as pods within host namespaces.
According to the vCluster architecture, the virtual control plane handles API requests while a syncer maps virtual resources to the host cluster. This separation allows tenants to manage their own CRDs, namespaces, and RBAC while platform teams use quotas, NetworkPolicies, pod security, IAM boundaries, and node isolation controls to protect the host and other tenants.
Implementation: the EKS Auto Mode host
EKS Auto Mode simplifies the host cluster by automating infrastructure management. It handles node provisioning, scaling, and updates based on pod requirements.
The following snippet shows how to define an EKS cluster with Auto Mode enabled using Pulumi.
import * as awsx from "@pulumi/awsx";
import * as eks from "@pulumi/eks";
import * as k8s from "@pulumi/kubernetes";
import { SubnetType } from "@pulumi/awsx/ec2";

const clusterName = "environment-factory";

const vpc = new awsx.ec2.Vpc("environment-factory", {
    enableDnsHostnames: true,
    cidrBlock: "10.0.0.0/16",
    subnetSpecs: [
        {
            type: SubnetType.Public,
            tags: {
                [`kubernetes.io/cluster/${clusterName}`]: "shared",
                "kubernetes.io/role/elb": "1",
            },
        },
        {
            type: SubnetType.Private,
            tags: {
                [`kubernetes.io/cluster/${clusterName}`]: "shared",
                "kubernetes.io/role/internal-elb": "1",
            },
        },
    ],
    subnetStrategy: "Auto",
});

// Create an EKS cluster with Auto Mode enabled.
const hostCluster = new eks.Cluster("host-cluster", {
    name: clusterName,
    authenticationMode: eks.AuthenticationMode.Api, // Use API authentication mode for EKS access entries.
    vpcId: vpc.vpcId,
    publicSubnetIds: vpc.publicSubnetIds,
    privateSubnetIds: vpc.privateSubnetIds,
    autoMode: {
        enabled: true,
    },
});

const hostProvider = new k8s.Provider("host-provider", {
    kubeconfig: hostCluster.kubeconfig,
});
Implementation: the environment factory
Once the host cluster is ready, we can build the factory that stamps out tenant environments. Each tenant needs a dedicated namespace, resource quotas, and the vCluster itself.
Tenant guardrails
Before installing vCluster, we set up a namespace and resource quotas to ensure one tenant cannot consume all host resources.
import * as k8s from "@pulumi/kubernetes";

// Define a tenant namespace on the host cluster.
const tenantNamespace = new k8s.core.v1.Namespace("tenant-alpha", {
    metadata: { name: "tenant-alpha" },
}, { provider: hostProvider });

// Apply resource quotas to the tenant namespace.
const quota = new k8s.core.v1.ResourceQuota("tenant-quota", {
    metadata: { namespace: tenantNamespace.metadata.name },
    spec: {
        hard: {
            pods: "20",
            "requests.cpu": "4",
            "requests.memory": "8Gi",
            "limits.cpu": "8",
            "limits.memory": "16Gi",
        },
    },
}, { provider: hostProvider });

// Define a Role for the tenant within their namespace.
const tenantRole = new k8s.rbac.v1.Role("tenant-role", {
    metadata: { namespace: tenantNamespace.metadata.name },
    rules: [{
        apiGroups: [""],
        resources: ["pods", "services", "configmaps", "secrets"],
        verbs: ["get", "list", "watch", "create", "update", "patch", "delete"],
    }],
}, { provider: hostProvider });

// Bind the Role to a tenant user or group.
const tenantRoleBinding = new k8s.rbac.v1.RoleBinding("tenant-role-binding", {
    metadata: { namespace: tenantNamespace.metadata.name },
    subjects: [{
        kind: "User",
        // Replace "tenant-user" with the IAM-mapped user or group for this tenant.
        name: "tenant-user",
        apiGroup: "rbac.authorization.k8s.io",
    }],
    roleRef: {
        kind: "Role",
        name: tenantRole.metadata.name,
        apiGroup: "rbac.authorization.k8s.io",
    },
}, { provider: hostProvider });
For production use, map these Kubernetes identities to IAM principals using EKS Access Entries, with the legacy aws-auth ConfigMap still appearing in older clusters.
Deploying vCluster with Helm
We use the kubernetes.helm.v3.Release resource to install vCluster. This resource provides controlled Helm lifecycle management for the vCluster release. The values block should be adjusted for each tenant profile to control resource synchronization and control plane behavior. Review the vCluster release notes when changing chart versions because values schema and generated secret names can change across releases.
import * as k8s from "@pulumi/kubernetes";

// Install vCluster using the Helm Release resource.
const vcluster = new k8s.helm.v3.Release("vcluster-alpha", {
    name: "vcluster-alpha",
    chart: "vcluster",
    version: "0.20.0", // Tested with vCluster 0.20.x; review release notes before changing versions.
    repositoryOpts: {
        repo: "https://charts.loft.sh",
    },
    namespace: tenantNamespace.metadata.name,
    values: {
        // Explicit sync configuration; adjust per tenant profile.
        sync: {
            toHost: {
                pods: { enabled: true },
            },
        },
    },
}, { provider: hostProvider });
Accessing the virtual cluster
The vCluster generates a kubeconfig that allows developers to interact with the virtual API server. We must treat this kubeconfig as a secret, and the endpoint in that kubeconfig must be reachable from the Pulumi runner before using it to create resources inside the virtual cluster.
import * as pulumi from "@pulumi/pulumi";
import * as k8s from "@pulumi/kubernetes";

// Retrieve the vCluster kubeconfig from the generated secret.
// The vCluster-generated secret can lag behind Helm release readiness on first creation,
// so teams may choose an explicit readiness check or rerun after the virtual control plane initializes.
const vclusterKubeconfig = k8s.core.v1.Secret.get("vcluster-secret",
    pulumi.interpolate`${tenantNamespace.metadata.name}/vc-vcluster-alpha`,
    {
        provider: hostProvider,
        dependsOn: [vcluster],
    }
).data.apply(data => Buffer.from(data["config"], "base64").toString());

// Export the kubeconfig as a secret.
export const tenantKubeconfig = pulumi.secret(vclusterKubeconfig);

// Create a provider for the virtual cluster using the secret kubeconfig.
const vclusterProvider = new k8s.Provider("vcluster-provider", {
    kubeconfig: tenantKubeconfig,
});
Operational caveats
- RBAC and permissions: vCluster generates default RBAC rules that work for most scenarios. However, if your host cluster is heavily locked down, you may need to provide additional permissions to the vCluster service account.
- Helm release previews: When using
kubernetes.helm.v3.Release, Pulumi previews may not show every detail of the rendered Kubernetes resources. It primarily tracks the state of the Helm release itself. - EKS Auto Mode node lifetime: EKS Auto Mode uses immutable AMIs and has a 21-day node lifetime. Kubernetes reschedules vCluster pods and tenant workloads when nodes are replaced, so configure replicas, PodDisruptionBudgets, requests, and persistent storage for disruption tolerance.
Conclusion: ephemeral environments at scale
By combining Pulumi with EKS Auto Mode and vCluster, you can build a scalable environment factory. This approach provides the isolation developers need while maintaining the speed and cost-efficiency required by platform teams.
The snippets provided here are adapted for illustration. In a production environment, you would likely wrap these resources into a Pulumi ComponentResource to provide a clean, reusable API for your internal developers. When a feature branch is merged, deleting the Pulumi stack removes the resources managed by that stack, but validate namespace finalizers, persistent volume reclaim policies, and external cloud artifacts as part of cleanup.

Coding Is No Longer the Constraint: Scaling Developer Experience to Teams and Agents at Spotify
Spotify's engineers increased pull request frequency by 76% by offloading maintenance to a background agent named Honk.
Deep dive
- AI tools are now used by 99% of Spotify engineers weekly.
- 'Honk' runs Claude within Kubernetes pods to automate code migrations and refactoring.
- Backstage provides the necessary metadata and context, allowing agents to understand component ownership and documentation.
- Standardized 'golden states' for components act as guardrails for agent-generated code.
- The constraint has shifted from writing code to human decision-making and PR review capacity.
- Honk and Fleetshift are available via Spotify Portal for Backstage.
Decoder
- Backstage: An open-source internal developer portal created by Spotify for managing software catalogs, documentation, and tooling.
- Monorepo: A software development strategy where code for many projects is stored in a single repository.
Original article
Coding Is No Longer the Constraint: Scaling Developer Experience to Teams and Agents at Spotify
What happens when coding stops being the bottleneck? At Spotify, we’re starting to find out.
Niklas Gustavsson, Spotify’s Chief Architect and VP of Engineering, recently shared how our yearslong investment in internal development platforms and engineering best practices is driving our AI transition — enabling both our teams and our agents to move faster than ever, while also providing the foundations for meeting the new challenges ahead. Watch his full talk from Code with Claude 2026 below.
Read on for key highlights.
Adoption that went “completely bananas”
The rate of adoption for AI coding tools at Spotify has been unlike anything we’ve seen before — and it accelerated dramatically with the Opus 4.5 release late last year. Today, more than 99% of our engineers use AI coding tools every week, 94% report that AI has made them more productive, and we’re seeing a 76% increase in pull request frequency, with the vast majority of PRs authored by a developer working alongside an AI agent.
“We roll out tools internally all the time to make our developers more productive, but we have never seen the rate of adoption that we’ve seen rolling out AI coding tools.”
We started this journey before agents
A few years ago, we noticed our production codebase was growing seven times faster than the number of engineers. Developers were spending more and more of their time on maintenance — upgrading dependencies, migrating APIs, patching vulnerabilities — and less time building features. Migrations were the number one source of developer frustration.
Instead of asking hundreds of teams to manually update their components one by one, we imagined a different approach. What if we used automation to make changes across hundreds or even thousands of software components at once? That idea became Fleet Management, and the underlying system we built to execute it is called Fleetshift. Fleet Management has been running at Spotify for several years now. To date, we’ve merged more than 2.5 million automated maintenance PRs, the vast majority auto-merged with no human in the loop.
“Instead of doing this component per component and fairly manually, can we imagine a way where we do this as a way to mutate our entire fleet of components?”
Meet Honk, our background coding agent
Fleet Management worked beautifully for simple changes, but complex code modifications — replacing API calls, refactoring usage patterns — pushed our deterministic scripts to the breaking point. When you run a script across millions of lines and thousands of components, you hit every corner case.
As LLMs matured, we saw an opportunity. What if, instead of writing ever-more-complex deterministic scripts, we could use a model to handle the code modifications?
“It has a silly name and a silly icon, but it’s a very useful tool, as it turns out.”
After many iterations, the result is Honk, our background coding agent. It may have a silly name, but our fine feathered coding friend has become an essential part of our everyday operations. Under the hood, Honk runs Claude using the Agent SDK, wrapped inside our own harness and deployed in Kubernetes pods so we can schedule many sessions concurrently across our cloud environment. It has access to a set of trusted tools, including the ability to run builds in our CI environment across multiple operating systems to verify that its changes are correct.
Honk integrates directly into our Fleet Management tooling: Fleetshift helps humans manage the orchestration — identifying targets, scheduling changes, tracking progress — while Honk sits in the middle doing the actual code modifications. A team running a migration can see at a glance how many PRs have been created, how many have been merged, and which ones need attention. Our most recent Java migration across our backend services took three days.
“What used to be hundreds of teams doing migrations for their components, taking weeks and weeks or months, now can be done by a single engineer in a few days.”
Developers being developers, they quickly figured out new ways to take advantage of our surprisingly capable, self-sufficient background coding agent. Honk is now available over Slack, where engineers can mention it mid-conversation — a natural source of context — and it will fly off, work on the problem, and come back with a PR.
And with Honk v2, we’re introducing multiplayer collaboration: shared agent sessions, team projects, and agent orchestration through Chirp. We’re excited for a world where agents collaborate with multiple developers and teams, not just one person at a terminal.
Developer experience is for agents, too
One of Spotify’s oldest engineering principles is: “The fewer technologies we are world-leading in, the faster we go.”
It’s an idea that predates AI at Spotify by many years. By standardizing on a focused set of technologies, we build deeper expertise, eliminate unnecessary decisions for teams, and make it far easier for engineers to collaborate across the codebase. A typical backend service at Spotify looks very similar to every other backend service — same technology stack, roughly the same design patterns.
That principle has turned out to be just as important for agents. When Claude has a lot of other code to reference and that code is consistent, it performs significantly better. We’ve seen this clearly: in our more fragmented codebases, agent performance is measurably worse.
“If Claude has a lot of other code to look at, and that code looks roughly consistent, Claude will do a better job. That’s what we’re seeing.”
The starting point for this consistency is Backstage, our open source internal developer portal (IDP). Before Backstage, Spotify had roughly a hundred different internal tools — one for deployments, another for CI, another for A/B tests. It was fragmented and confusing. Backstage consolidated all of that into a single pane of glass built around a catalog of our software components. Today, for anything a developer needs to do with one of our components, they do it in Backstage.
And as it turns out, that’s equally useful for agents. We expose Backstage’s capabilities as MCPs and command-line tools, so Claude can look up who owns a component, read its documentation, or ping the responsible team on Slack.
We also use Backstage to drive standardization through what we call Soundcheck and golden state. Golden state defines the recommended technologies and practices for each type of component. Soundcheck provides a UI where teams can self-assess their components against those standards. Combined with static analysis and linting, these standards become active guardrails — when Claude works in our codebase and uses a pattern we know isn’t optimal for our infrastructure, it gets immediate feedback from our lint system and corrects itself.
“When Claude works in our codebase, it will get immediate feedback on if it’s using the right set of technologies and right set of design patterns.”
This feedback loop works for developers and agents alike, and it’s been one of the most effective ways we’ve found to drive consistency at scale.
Coding is no longer the bottleneck
As coding velocity increases, the constraints shift toward human decisions. Spotify has always had more ideas than capacity to build them — but now anyone can open Claude in our client monorepo and prototype a feature idea in minutes instead of days. Even our CEO is building prototypes this way.
“This has brought prototyping from something that could take days or weeks to literally taking minutes now.”
The flip side: we now have 76% more PRs to review. We’re learning where to apply human judgment — auto-merging what’s safe, focusing review where it matters most — and rethinking how we plan and prioritize as the bottleneck moves from coding to decision-making.
The investments we made years ago in Fleet Management, Backstage, and engineering standardization have positioned us well. And we’re excited about what comes next.
Fleetshift and Honk are available as part of Spotify Portal for Backstage. If orchestrating complex code changes at scale is relevant for your organization, reach out to our platform team for a personalized walkthrough.
Scaling StarRocks on Amazon EKS with KEDA and Karpenter for enterprise OLAP workloads
Amazon’s FinTech team scaled StarRocks on EKS to support 1,000 concurrent users by using KEDA to drive elastic scaling for complex analytical workloads.
Deep dive
- StarRocks hybrid architecture: Stateless CNs for S3-based scans, BE nodes with indexed local storage for high-performance dimension joins.
- KEDA scales pod counts based on Prometheus query queue metrics.
- Karpenter provisions specific node families (compute vs. memory optimized) for distinct roles (FE, BE, CN).
- FE nodes (Control Plane) use On-Demand instances; CN nodes use Spot instances for cost-efficiency.
- Query Complexity Framework helped identify that standard generic benchmarks failed to capture production JOIN patterns.
- StarRocks Cost-Based Optimizer (CBO) handles complex SQL tuning automatically as data distributions change.
Decoder
- OLAP (Online Analytical Processing): Systems optimized for complex, multi-dimensional queries and large-scale data analysis rather than individual record transactions.
- MPP (Massively Parallel Processing): A database architecture where query processing is distributed across multiple nodes, running in parallel.
Original article
Scaling StarRocks on Amazon EKS with KEDA and Karpenter for enterprise OLAP workloads
Financial analytics at enterprise scale is unforgiving. Queries must return in seconds, not minutes. Thousands of finance professionals need concurrent access during monthly close cycles. And when data volumes grow from hundreds of gigabytes to terabytes, spanning billions of records, the infrastructure underneath must scale without forcing engineers to choose between performance and cost.
This is the challenge the Amazon WW Stores FinTech team faced. We build and operate analytical products covering financial reporting, planning and allocation, self-serve analytics, and AI-powered financial insights, serving thousands of finance users every business day.
As workloads scaled, the gap between what our systems could deliver and what our finance teams needed grew impossible to ignore. The demands were clear:
- Sub-second to single-digit-second query responses across terabytes of financial data
- Hundreds of concurrent users supported during peak business cycles
- Horizontal scaling without disruptive data rebalancing
Our existing systems could satisfy one or two of these dimensions in isolation, but not all three simultaneously at the data volumes we were projecting. This wasn’t a migration problem, it was a greenfield opportunity to build the right analytical foundation from scratch.
This post shares what we found, the architecture we built on Amazon Elastic Kubernetes Service (Amazon EKS), and how we use KEDA and Karpenter to elastically scale StarRocks for bursty enterprise financial workloads. We partnered with the Data on EKS team on the reference blueprints that back this infrastructure.
The analytical challenge
Financial analytics differs fundamentally from general operational analytics. It involves deeply nested hierarchies, multi-dimensional pivots, and complex join chains that stress analytical engines in ways that standard benchmarks fail to capture. To make the evaluation meaningful, we needed to test against data and queries that reflected our actual production conditions.
We worked with two production-representative datasets that together, captured the full range of our analytical workloads. The first covered hierarchical financial data organized around multi-level dimensional structures with complex join patterns across three to seven tables. The second comprised operational data, characterized by high-cardinality aggregations across millions of distinct values. Together, these datasets represented the two most demanding workload shapes in our production environment. Rather than relying on generic benchmark queries, we defined a Query Complexity Framework to systematically evaluate each engine against the real patterns our finance workloads exhibit:
- High-Cardinality Filtering: WHERE clauses on columns with large distinct value counts (for example, cost center or revenue classification codes)
- Data Aggregation: GROUP BY operations with complex aggregate functions across large fact datasets
- Complex Data Relationships: Star schema patterns with over 3 table JOINs
- Pivot Transformations: Converting row values into columnar format for financial reporting
- Hierarchical Navigation: Drill-down operations across parent-child reporting hierarchies
A single financial query routinely spans several of these dimensions simultaneously. That combination is what makes financial OLAP workloads significantly harder than what standard benchmarks test for. Using this framework, we designed a comprehensive set of benchmark queries with clear targets: sub-5 seconds for standard queries, sub-20 seconds for complex queries, and linear scalability from 50 to 1,000 concurrent users.
We evaluated two Online Analytical Processing (OLAP) candidates, StarRocks (3.4.0) and ClickHouse (25.6.4.12), on identical infrastructure to ensure a fair comparison deployed across multiple availability zones.
Benchmark results: StarRocks compared to ClickHouse
StarRocks is an open source MPP analytical database with a Cost-Based Optimizer and shared-data architecture, designed for concurrent complex analytical workloads. ClickHouse is an open source columnar OLAP database optimized for fast single-table aggregations and high-throughput data ingestion on simpler query patterns.
Running both engines through our Query Complexity Framework against our actual production datasets produced clear results:
| Query Pattern | ClickHouse | StarRocks (External Catalog) | StarRocks (Local / Native) |
|---|---|---|---|
| Simple scans – no JOINs | 33% higher throughput; lower P95 | Baseline | Best – local indexes accelerate lookups |
| Simple scans at peak (1,000 users) | Baseline | 1.5X better P95 vs ClickHouse | Best P95 at scale |
| Single JOIN | Baseline | .5X higher throughput; .5X lower P95 | Best – indexed dimension lookups |
| Multi-JOIN (over 2–3 tables) | Baseline | 3X-5X higher throughput; .8X lower P95 | Best – 36x less data scanned |
| Filtered scans (over 3 filters) | Baseline | 2X higher throughput; .6Xlower P95 | Best – local indexes |
| TB-scale ingestion | Excellent – ~6min/TB (after EBS tuning) | N/A – queries in-place from S3 | Good – 30+ min/TB using Spark connector |
| High-cardinality GROUP BY | Excellent | Excellent | Excellent |
| Pivot operations | Excellent | Baseline | Good- reduced I/O overhead |
Note: The Local / Native column reflects benchmarks where all data resided on BE nodes. In production, we use a hybrid approach—dimension tables are ingested into indexed native tables on BE nodes for accelerated joins, while fact tables remain in S3 and are queried through External Catalog using CN nodes.
Why we chose StarRocks
The benchmark results told a clear story. Straightforward queries flatter both engines. At low complexity, ClickHouse and StarRocks performed similarly, with ClickHouse showing a slight edge on straightforward aggregations. As query patterns moved toward what our finance users actually run (multi-table joins, hierarchical pivots, and high-cardinality filters applied simultaneously), the engines diverged sharply. ClickHouse does hold genuine advantages: it ingests TB-scale data faster and excels on straightforward query patterns. For ours, where complex, concurrent financial queries define the baseline, those strengths were not enough.
StarRocks’ Cost-Based Optimizer self-tunes query plans as data distributions change, which is why performance held up across multi-table joins, hierarchical pivots, and high-cardinality filters without manual intervention. Just as importantly, External Catalog queries through AWS Glue delivered strong baseline performance for analytical scans without requiring data ingestion first—teams query existing Hive and Iceberg tables directly.
StarRocks’ stateless Compute Nodes (CN) carry no persistent data, so they scale in and out instantly with no rebalancing or disruption to running queries—exactly what makes KEDA-driven autoscaling practical for an OLAP workload. Its hybrid architecture gave us deployment options most OLAP engines can’t offer, stateless CNs scale against data in Amazon Simple Storage Service (Amazon S3), while dedicated Backend (BE) nodes add indexed local storage for dimension join acceleration, all within the same cluster. These properties gave us the confidence that StarRocks would scale with our workload rather than constrain it.
Architecture on Amazon EKS
Our architecture on Amazon EKS uses the StarRocks Kubernetes Operator to manage the full cluster lifecycle using a declarative StarRocksCluster CRD, providing automated rolling updates and self-healing without the need to build custom management tooling. Frontend (FE) nodes serve as the control plane, using a three-node Raft quorum for leader election and metadata consistency, ensuring high availability (HA) for SQL parsing and query coordination.
The data layer is split into two tiers to optimize for different access patterns. Backend (BE) nodes are deployed as StatefulSets using Amazon EBS volumes (PV/PVCs) to provide durable, high-performance storage for indexed dimension tables and operational telemetry. This persistence ensures that indexed lookups and local data scans consistently outperform S3-based access for our highest-frequency reporting workloads. In contrast, Compute Nodes (CN) provide an elastic, shared-data layer that pulls from Amazon S3 and maintains only ephemeral local caches. Because CNs are stateless and managed as Deployments, they bypass the slow, ordered sequencing of StatefulSets. This allows KEDA with ScaledObjects to scale compute resources near-instantly with no data movement required to meet fluctuating query demands while maintaining the cost benefits of a shared-data architecture.
StarRocks offers Shared-Nothing (BE nodes with local storage and compute) and Shared-Data (stateless CN nodes backed by object storage with local caching) architectures. StarRocks Kubernetes Operator’s StarRocksCluster CRD supports both using starRocksBeSpec and starRocksCnSpec, enabling hybrid deployments in a single cluster. Our production deployment combines both modes within the same cluster: CN nodes provide elastic, stateless compute for fact table scans against data in Amazon S3 using AWS Glue Catalog, while BE nodes store indexed dimension tables on persistent EBS volumes for accelerated join performance. CN nodes scale freely for burst demand with no data movement; BE nodes remove S3 round trips for the dimension lookups that dominate our join-heavy financial queries. The StarRocks query planner routes each workload to the appropriate tier automatically.
Connectivity, integration, and monitoring
Client tools including internal BI platforms, and SQL Workbench connect through AWS PrivateLink and a Network Load Balancer, ensuring private, secure connectivity without traversing the public internet. StarRocks’ external catalog feature enables federated queries across our data ecosystem. AWS Glue Data Catalog serves as the central metadata store, and StarRocks queries Hive and Apache Iceberg tables in S3 through it without a separate ingestion step. External Catalog queries deliver strong baseline performance for analytical scans, letting teams start querying their existing data lake immediately. For join-heavy workloads, ingesting dimension tables into indexed native tables on EBS volumes delivers measurably faster response times. This is a clear optimization path as workloads mature. For native table ingestion, AWS Glue Jobs with the StarRocks Spark Connector handle batch pipelines. Cross-account catalog access supports our multi-account AWS organization structure.
For monitoring, we combine Prometheus for StarRocks metrics collection, covering FE query counts, BE memory utilization, CN cache hit rates, and query queue depth, with Amazon CloudWatch for centralized dashboards, alerting, and operational runbook integration.
Elastic Scaling with KEDA and Karpenter
Traditional OLAP systems couple storage and compute tightly, making elastic scaling impractical. You either overprovision for peaks or accept degraded performance when load spikes. StarRocks breaks this constraint through two layers of automation.
KEDA (Kubernetes Event-Driven Autoscaling) monitors StarRocks-specific metrics through Prometheus—query queue depth, CPU and memory utilization, and pending query counts—and automatically adjusts pod counts to match real demand rather than relying on basic resource thresholds alone. CN nodes are fully stateless and begin serving queries the moment they join (no data movement required) making them the first line of defense for burst load. BE nodes scale independently for a different purpose. They expand storage capacity and query execution parallelism for sustained load increases, with StarRocks replicating data shards to new replicas automatically, though they need time to warm up.
Karpenter takes over at the infrastructure layer. When KEDA requests additional pods and they land in the Kubernetes scheduler queue, Karpenter provisions right-sized EC2 instances on demand instead of relying on pre-warmed node pools. FE and BE NodePools run on On-Demand instances to protect coordination and persistent data, while CN NodePools use Spot instances since stateless nodes tolerate interruptions gracefully. Each role runs in a dedicated NodePool, so scaling decisions for one never interfere with another. The end-to-end flow is straightforward: rising query load triggers KEDA, KEDA scales pods, Karpenter provisions nodes, and new capacity registers with StarRocks—instantly for CNs, progressively for BEs as data replicates. When load drops, Karpenter consolidates underutilized nodes automatically, returning the cluster to its baseline with no manual intervention.
Lessons learned and operational insights
Building and running StarRocks on EKS at production scale taught us several things that are difficult to learn from documentation alone.
1. Memory management requires active tuning
During 1,000-user stress tests, memory limit exceeded errors caused roughly 40 percent query failures. Multi-join queries exhausted per-BE memory limits, and CN nodes were under-provisioned for complex scan patterns. We resolved this by migrating to memory-optimized EC2 instances for BE nodes, configuring StarRocks Resource Groups to cap and queue queries instead of failing them, and tuning query_mem_limit per workload profile. Peak error rates dropped from 40 percent to under 5 percent.
2. S3 I/O Bottlenecks and the Hybrid Architecture Fix
CN-heavy deployments hit throughput bottlenecks under concurrent scans. S3 request limits and network constraints caused P95 latency spikes on complex joins. The fix: dimension tables with indexes moved to BE nodes on EBS to remove S3 round trips, while CN nodes handle fact table scans and burst queries. The StarRocks query planner routes workloads automatically, no application-layer changes needed.
3. SQL dialect migration from Amazon Athena and Presto
Despite StarRocks’ ANSI SQL and MySQL protocol support, teams encountered friction around function naming, array syntax, type conversions, and correlated subqueries. We built an internal translation guide and validation test suite for pre-migration query verification.
4. Tune EBS throughput before benchmarking any EBS-Backed system
Although we selected StarRocks, our ClickHouse evaluation produced one broadly useful operational finding. EBS throughput configuration is critical for any EBS-backed analytical workload. With default gp3 throughput at 125 MB/s, loading our 4.7 TB dataset took 13 hours. After adjusting to 1,000 MB/s with optimized IOPS settings, the same load completed in 25 minutes, a 31x improvement. Anyone evaluating ClickHouse or any EBS-backed system should tune these settings before drawing performance conclusions.
5. Instance type selection for StarRocks Node roles
Each node role has a distinct resource profile. We configure multiple instance types per Karpenter NodePool so Karpenter can optimize for availability and cost, especially important for CN Spot instances during peak scaling.
| Role | Sizing | Instance Types |
|---|---|---|
| FE (query planning, metadata) | 32 vCPU, 64–128 GB | c6i.8xlarge, c6in.8xlarge, m5.8xlarge |
| BE & CN (data scans, joins, aggregations) | 96 vCPU, 384–768 GB | r6i.24xlarge, m6in.24xlarge, r6in.24xlarge, m5n.24xlarge |
6. Future optimization
While our EBS-based production baseline remains the standard, we’re exploring storage-optimized EC2 instances with local NVMe SSDs for the BE layer to push the performance ceiling, minimizing storage latency and maximizing throughput for sub-second analytical workloads with the most extreme latency demands.
Key takeaways
- Always benchmark with your actual data, not generic tests. Our Query Complexity Framework revealed engine differences that standard benchmarks would have missed, and gave us defensible results across product teams with different priorities.
- Straightforward query speed doesn’t equal the best OLAP engine. ClickHouse outperformed StarRocks on no-JOIN queries at low concurrency. But those patterns represented a small fraction of our actual workload distribution. Always evaluate against the full spectrum of queries your users actually run.
- Shared-data architecture on EKS enables elastic scaling that tightly coupled systems can’t. CN node statelessness is the architectural primitive that makes KEDA and Karpenter OLAP autoscaling practical. BE scaling adds a complementary layer for sustained load growth.
Conclusion
Running large-scale financial analytics on Kubernetes requires a clear-eyed evaluation of workload characteristics, an honest comparison of engine trade-offs, and an architectural foundation designed to scale elastically from the start.
By combining StarRocks’ Cost-Based Optimizer and flexible hybrid deployment with KEDA’s event-driven pod scaling and Karpenter’s just-in-time node provisioning, our team built an analytical solution that delivers sub-5-second standard query responses and sub-20-second complex query responses at 1,000 concurrent users while preserving the cost efficiency that elastic compute scaling makes possible. The architecture isn’t specific to financial analytics. Any team with complex, variable analytical workloads and a data lake strategy on AWS can apply the same pattern: decouple storage and compute, instrument for real demand signals, and let the infrastructure respond automatically.
Keeping Code Reviews From Dragging
Code reviews are dragging because teams are treating AI-generated volume as an excuse to avoid hard conversations about process and intent.
Deep dive
- PR latency creates a "context-switching tax" for both authors and reviewers.
- AI increases the supply of PRs without increasing human review bandwidth.
- Prioritize the review queue at the start of every work session.
- Use a 4-day escalation playbook: daily initial response, call by day 2, team escalation by day 3, and redesign/split by day 4.
- If an author cannot explain a choice made by an AI model, the PR is not ready for merge.
- Bot-generated review noise trains developers to stop reading critical feedback.
Decoder
- Context-switching tax: The mental overhead and productivity loss incurred when shifting attention between unrelated tasks, such as writing code and reviewing someone else's work.
Original article
Keeping Code Reviews From Dragging
You know the feeling. You open a pull request on Monday morning. You ping the reviewer(s). You go to lunch. You come back. Nothing. You context-switch to something else. On Wednesday, the reviewer finally leaves a comment — a single one, on a minor detail. You fix it. You wait again. By Friday, the PR is still open, the branch is conflicting with master, and you’ve forgotten half of what the agent you wrote.
I’ve been on both sides of that scenario, like most of us. More times than I’d like to admit…
When I gave my talk on code reviews at Meeting C++, one of the attendees wrote a thoughtful reaction afterwards. He agreed with most of what I said, but pointed out that I had under-served one important part: the real-world problem of reviews dragging. I had said that PRs should be reviewed promptly and shouldn’t linger for days — but I hadn’t said much about how to make that happen, especially when junior contributors, unclear guidelines, or just plain over-stretched teams turn each review into a multi-day ping-pong match. A 60-minute talk has its limit, but it’s certainly worth talking about this problem.
The Cost Nobody Measures
Slow reviews don’t just slow down delivery. They quietly tax everything around them. The author loses context. By the time the first round of feedback arrives, they’ve moved on mentally — and now they have to swap back in, find the right state of mind, and try to remember why they made the decisions they made. That swap costs more than people realize.
The reviewer loses context too. Coming back to a PR three days after the author wrote it means re-reading the description, reloading the change, and re-deriving the intent. The second pass through a PR is almost always shallower than the first.
The team loses momentum. A PR that sits open for a week eats merge conflicts, blocks dependent work, and sends a quiet signal that this is just how things are around here. The longer it stays open, the more the next PR copies its pace.
And then there’s the new dynamic nobody had to think about a few years ago: AI changed the supply side. Generating a PR is now cheap. Reviewing one isn’t. The team that used to produce five PRs a day is producing twelve, and external contributors send another handful on top. Yet, the review capacity hasn’t moved. If your reviews were just barely keeping up before, you’re underwater now — and the queue grows faster than you can drain it.
And the manager — the one watching the delivery dashboard — concludes that reviews are slowing us down — which is half true. A review queue that drags slows us down. A review queue that moves doesn’t.
What Actually Helps
I don’t think there’s a silver bullet. But there are a few patterns that I’ve seen work — across teams, across companies, across languages. None of them are revolutionary. They’re just the things that the fast teams actually do.
Review First, Write Second
This is the single biggest lever, and it’s also the hardest one to pull. The idea is simple: when you sit down to work, the first thing you do is clear your review queue. Only then do you start writing new code.
Most teams operate in the opposite mode. You start the day writing your own thing, and you’ll get to reviews “when you have a moment”. The problem is that the moment doesn’t come. By the time you remember the open PRs in your queue, half a day has passed and the author has already context-switched away.
The team that reviews first ships faster than the team that writes first.
It’s not intuitive, but it works. Every minute spent unblocking a teammate’s PR pays back several minutes of their productivity. And the moment a team adopts this norm, the average PR lifetime drops noticeably.
This only works though when the team agrees. If you’re trying to enforce it alone, while the rest of your team writes first, you’re going to burn out before the culture shifts. Start by getting buy-in. Then you do what you agreed on, you show the way. Lead devs, this is on you — your team copies what you do, not what you say.
Have a Playbook for When a PR Drags
Sometimes a PR drags despite everyone’s best intentions. Here’s the playbook I try to follow:
- Day 1: Reviewer leaves a first pass within the working day. Even a partial review. Even just “I’m on it, will come back this afternoon” or just a 👀 emoji. The author needs to know the PR has been seen.
- Day 2: If the PR is still going back and forth, the author and reviewer have a 10-minute call. Written ping-pong is a smell. Two or three rounds of comments on the same thread usually means there’s a misunderstanding that comments can’t fix.
- Day 3: Escalate to the team. Is this PR too big? Is the scope unclear? Are the requirements off? Bring it up at standup. The whole team should know there’s a PR stuck.
- Day 4 and beyond: Something is wrong with the process, not the PR. Close it, redesign it, or split it.
A PR that lives longer than three days is rarely a code problem.
That last point matters. When a review takes a week, it’s almost never because the code is hard. It’s because the requirements are unclear, the PR is too big, the author and reviewer are on different pages, or someone is avoiding a conversation. Reviews are the symptom; the root cause always lies deeper.
Break the Ping-Pong Cycle Early
Some PRs don’t drag because nobody’s looking — they drag because the same comments keep coming back. The reviewer flags something, the author addresses it, the reviewer flags something adjacent, the author addresses that, and round and round we go.
This pattern is especially common with junior contributors, or with anyone who’s still learning the team’s unwritten rules. And when it happens, the worst thing you can do is leave another comment.
Here’s the rule I try to apply: three round-trips on the same PR? Stop reviewing. Start talking.
A 15-minute pairing session beats six more review rounds. You’ll resolve the misunderstanding in five minutes, learn what the author was actually trying to do, and probably discover that the comments you’ve been leaving aren’t really about the code at all — they’re about a shared mental model that hasn’t been built yet.
And if the same patterns keep coming up with the same contributor? That’s a coaching opportunity, not a code review opportunity. Turn the recurring feedback into a real conversation: “I keep flagging this; let me show you why, and let’s talk about how to spot it yourself next time.” That conversation saves dozens of future review rounds.
If you’re explaining the same thing twice, the review isn’t the right format anymore.
AI Changed the Math
Most of what I’ve written above applies whether or not your team uses AI. But there are a few patterns that have only really shown up in the last couple of years, and they deserve naming.
AI-authored Code Needs a Different Review
When the author of a PR didn’t write every line — when they accepted suggestions, refactored a Copilot-generated function, or asked a model to “make this cleaner” — the usual review questions don’t quite fit. “Why did you do it this way?” used to be a nudge; now it’s a real question, and the honest answer is sometimes “I’m not sure, the model suggested it.” That’s not a moral failing. It’s a sign that the author needs to slow down and verify before asking for review, and that the reviewer needs to spend more time on intent than on implementation.
The shortcut I use: if the author can’t defend a choice, the code isn’t ready. That applies whether the choice came from the model, from a tutorial they half-remembered, or from a senior engineer they didn’t fully understand. The author doesn’t have to have written every line — but they have to own every line.
AI Reviewers Are Part of the Queue, Not Separate from It
Most teams now have a bot reviewing every PR. And most of what those bots produce is noise: nits the team doesn’t care about, style suggestions that contradict the codebase’s conventions, *“potential issues”** that aren’t issues.
The danger isn’t the noise itself — it’s what the noise does to the reviewer. A reviewer who learns to skim past 70% of comments will eventually skim past the 30% that mattered. Alert fatigue is real, and bots are the fastest way to manufacture it.
The fix is to treat bot comments the way you’d treat any unreliable reviewer: triage first, then engage. If your bot is producing more noise than signal, tune it, mute it, or turn it off entirely until you can. A reviewer that comments on everything is a reviewer nobody reads.
The Human Comments Matter More, Not Less
Counter-intuitively, the more AI participates in code review, the more important the human comments become — because the human comments are the ones with context, judgment, and the willingness to ask questions a bot can’t. If you find yourself writing the kind of comment a linter could have written, you’re spending your review energy in the wrong place.
The Conversation With Your Manager
There’s one more piece worth saying out loud, because it’s the part lead devs have to deal with most often.
Many managers and stakeholders still view code reviews as something that slows down delivery. They see the queue, they see the latency, and they conclude that the team would ship more if it reviewed less. As a lead, part of your job is to help them understand why this work is essential — and that’s not always easy.
The truth is that the value of thorough reviews, like the value of good tests, careful error handling, or solid design, mostly only becomes obvious when things go wrong. Nobody throws you a parade for the production incident that didn’t happen. But the codebase that didn’t slide into a state where every change costs three times what it should — that codebase is the one that pays you back, quietly, for years.
If you find yourself having to make this case, I’d suggest framing it the way the commenter on my talk did: thorough reviews prevent the codebase from sliding toward a point of no return, where changes become prohibitively expensive — or nearly impossible. That framing tends to land better than “reviews catch bugs”, because it speaks to a cost trajectory rather than a single line item.
Conclusion
Code reviews don’t have to slow you down. They slow you down when they drag — when the queue builds up, when PRs live for a week, when the same comments keep bouncing back and forth. The fix isn’t to do fewer reviews. The fix is to do them faster, more deliberately, and with a willingness to switch formats when the review format itself isn’t working anymore.
If you only remember three moves, let them be these:
| Pattern | Move |
|---|---|
| New code waiting to be written | Review the queue first |
| PR dragging past day 2 | Have a call, not more comments |
| Same feedback for the third time | Switch from review to coaching |
And keep an eye on the bots. A noisy reviewer — human or not — trains everyone to stop reading.
None of these are revolutionary. But together they make the difference between a team where reviews are a small, predictable cost and a team where reviews are the bottleneck everyone complains about. You can’t fix slow reviews with a Slack bot — but you can change how your team thinks about reviewing, and the moment that shifts, everything downstream of it gets faster.
If you’ve found patterns that work on your team, I’d love to hear them.

DaVinci Resolve 21 Officially Released With New Photo Editing, AI Tools, and Much More
Blackmagic Design launched DaVinci Resolve 21, expanding its professional video suite into still-image editing with a new Photo page and AI-powered creative tools.
Deep dive
- Photo Page: New interface for organizing and editing stills.
- Node-based grading: Non-destructive, flow-chart style color correction used in high-end film.
- IntelliSearch: AI-powered content identification for file management.
- CineFocus: AI tool for post-capture focal depth manipulation.
- Krokodove: Addition of 100+ motion graphic effects to Fusion.
- RAW Support: Expanded compatibility for Canon CR3, Fujifilm RAF, and Sony ARW.
Decoder
- Node-based grading: A workflow where image processing is performed by chaining together 'nodes', each representing a specific adjustment (like color balancing or masking), which allows for complex, modular edits.
- RAW: A file format containing minimally processed data from the image sensor, offering the maximum flexibility for color correction and recovery of highlights or shadows.
Original article

Blackmagic Design has officially released the final version of DaVinci Resolve 21, delivering one of the largest updates in the software’s history. The release introduces a completely new Photo page for still-image editing, a range of AI-powered tools, major workflow enhancements across editing, color grading, audio, and visual effects, and support for additional camera formats and codecs.
The DaVinci Resolve 21 update follows an extensive public beta period and brings hundreds of new features to both the free and Studio versions of DaVinci Resolve. While video editors will find significant improvements throughout the application, one of the most notable additions is Blackmagic’s push into professional photo editing, allowing photographers to use the same node-based color tools traditionally reserved for high-end film and television productions.

A New Photo Page Brings Resolve’s Color Tools to Photographers
As PetaPixel covered back in April during the software’s public beta, the headline feature in DaVinci Resolve 21 is the introduction of the new Photo page, which expands the software beyond video production into still image workflows.
Photographers can now import, organize, edit, and export photographs directly in Resolve, leveraging the same professional color-grading tools used on Hollywood productions. The Photo page includes album management, ratings, favorites, tagging, and collection support, creating a dedicated environment for image editing without requiring a separate application.
Blackmagic has also included native RAW support for major camera manufacturers, Lightroom catalog importing, Apple Photos integration on macOS, and GPU-accelerated batch exports.
Perhaps most interesting for photographers is the ability to apply Resolve’s full node-based grading workflow to still images. Users can work with curves, qualifiers, power windows, LUTs, ResolveFX effects, and grading panels to make highly targeted adjustments that would traditionally require specialized photo editing software.

New AI Tools Expand Creative Possibilities
DaVinci Resolve 21 also introduces several new AI-powered features designed to streamline workflows and automate common tasks.
Among the most notable additions is IntelliSearch, which allows users to quickly locate clips and content within projects using intelligent search capabilities. Blackmagic has also added CineFocus, an AI-assisted tool that enables users to adjust focal emphasis after footage has been captured.
Additional AI enhancements focus on facial refinement and portrait adjustments, giving creators more sophisticated tools for improving subjects without relying on external applications.
These features continue Blackmagic’s recent trend of integrating machine learning tools directly into editing and grading workflows rather than requiring third-party plugins.
Major Improvements for Editors
Editors receive a substantial number of workflow enhancements throughout the Cut and Edit pages.
The keyframing system has been significantly expanded with four-point Bézier controls, advanced easing options, looping functions, reverse animation capabilities, and support for multiple clip selections. Users can now keyframe effects, text elements, generators, and Fusion compositions directly from the editing interface.
Support for native Lottie animations and OGraf HTML graphics also broadens motion graphics capabilities, while new font-browsing tools, live font previews, spell-checking, emoji support, and color fonts make text creation considerably more flexible.
Other notable additions include multicam workflow improvements, timeline comparison tools, enhanced subtitle management, improved track visibility controls, and expanded replay functionality for live production environments.

Fusion Gets a Massive Motion Graphics Upgrade
The Fusion page receives one of its largest updates in recent years with the addition of the Krokodove toolset.
More than 100 new motion graphics effects and tools have been added, including over 70 Krokodove graphics designed to simplify the creation of complex animations and visual effects.
A new Macro Editor makes it easier to create reusable tools and publish them directly to the Edit page, while improved MultiText controls, enhanced USD support, native relief map creation, and audio-driven animation capabilities further expand Fusion’s feature set.
The update also introduces native support for Lottie animations and OGraf HTML graphics, helping motion designers move assets between platforms more efficiently.
Color and Fairlight Workflows Continue to Evolve
Colorists receive several notable improvements in Resolve 21, including layer-list node graph views, support for up to eight-layer node stacks, improved ACES workflows, Adobe RGB color space support, and enhanced HDR monitoring controls.
Group grading workflows have also been expanded with support for grade versions, making collaborative color work easier to manage.
On the audio side, Fairlight introduces folder tracks, enabling more efficient organization of complex projects. Audio teams can now collapse and expand groups of tracks, making large mixes significantly easier to navigate.

Expanded Camera and RAW Format Support
Blackmagic continues to broaden Resolve’s compatibility with additional camera systems and image formats.
DaVinci Resolve 21 adds native decoding support for Canon CR3, Panasonic Lumix RW2, Fujifilm RAF, and Apple ProRAW files, and introduces support for compressed Sony ARW files from the Sony a7 V and newer cameras.
The update also improves Nikon NEF handling, expands HDR image support for common still-image formats, and adds compatibility for Sony Burano Version 3 footage.
For photographers and hybrid shooters, the expanded support for still-image formats is particularly significant, given the new Photo page’s emphasis on integrated photo-editing workflows.
Performance and Collaboration Improvements
Beyond the headline features, Blackmagic has focused heavily on workflow efficiency.
Project settings and preferences can now be searched directly; media pools gain tabbed layouts and improved metadata handling; and Blackmagic Cloud synchronization performance is reportedly up to three times faster than in previous versions.
Multi-user projects now support dynamic project switching, and users can import and export Final Cut Pro 12 XML files for improved interoperability with other editing environments.
The final release follows months of public beta testing and introduces hundreds of new features spanning photo editing, video production, color grading, visual effects, audio post-production, collaboration, and AI-assisted workflows, making it one of the most ambitious updates in the software’s history. Combined with numerous stability improvements and bug fixes, the release represents one of the most comprehensive updates DaVinci Resolve has received to date.

Pricing and Availability
DaVinci Resolve 21 is available now as a free download from Blackmagic Design. DaVinci Resolve 21 Studio, which includes additional AI features, editing beyond 4K resolution, and full-res photo exports, costs $295.
Agentic Coding with Multiple Parallel Agents (Website)
Verdent AI uses multiple parallel agents to build entire software products from plain language prompts while maintaining project context across tasks.
Deep dive
- Features multiple agents working in parallel to handle feature building, testing, and architecture.
- Offers integrations for VS Code and JetBrains.
- Supports BYOK (Bring Your Own Key) and Eco Mode for flexible cost management.
- Addresses the 'context window' problem by maintaining project state over long-term development.
- Claims significant improvements in real-world software engineering benchmarks through behavioral alignment training.
Decoder
- Agentic coding: A development paradigm where AI models act autonomously as agents to plan, execute, and verify code changes across an entire repository.
- SWE-bench: A benchmark designed to evaluate how well language models can resolve real-world GitHub issues.
Original article
Build Your Product With Plain Words In Minutes
Just tell Verdent what you want. Verdent runs the work. You run the business.
Built to Launch
Not just a polished front end. Verdent helps you build a login system, data storage, payments, and admin tools so you can launch a complete product.
Launch is Day One
Add subscription billing this week. Build the admin dashboard next month. Verdent keeps the whole project in context, so every new task starts with the full picture.
No Rebuild Required
What you get isn't a throwaway prototype. It's built on a solid foundation, ready to launch.
Knows You Better Over Time
Verdent remembers all your preferences. The longer you work together, the more it feels like a partner who actually gets you.
Built on The Best Models
Verdent is powered by today's most capable AI models, so what you build is stronger from the start and ready for real use.
Stop Wearing Every Hat
Give Verdent the goal. It breaks it down, builds it, tests it, and comes back when it's done.
Say What, not How
Verdent breaks it into tasks, sets priorities, and pushes them forward. You don't need to project-manage your AI.
You Step In for Key Decisions Only
Verdent pushes the work forward. When it needs a decision or a sign-off, it brings back results, not questions every five minutes.
Stop Being Tied to Your Desk
Send a message when the thought hits. Work keeps moving, even when you step away.
Got Something in Mind? Send It Over
Slack, Telegram. Message Verdent from wherever you are. The moment the idea hits, just send it. Verdent takes it from there.
They already built these
From Game Concept to Playable Build in 12 Hours
A solo developer describes a dark gothic Roguelike to Verdent and gets a playable game — 21 sprites, 52 bug fixes, full architecture refactor — in 12 hours.
A Desktop Companion I Built in 7 Days
She Breathes, Blinks, and Knows When My Code Is Compiling
From a Ticket to a Tool: Google Ads Data on Demand
A growth lead sends one message to Verdent and replaces a multi-day data engineering ticket with a reusable, self-service analytics pipeline in minutes.
Insights & Updates
More Flexibility, More Control — Introducing Eco Mode, BYOK, and Updated Pricing
Verdent is evolving beyond a credits-only system. With the introduction of Eco Mode, BYOK, more cost-efficient PAYG pricing, and updated subscription credits, you now have more flexible ways to control cost, extend usage, and keep working without interruption.
Why Strong Coding Models Fail at Real Software Engineering — and How to Fix It
A 14B model acing coding benchmarks solves only 2.8% of real engineering tasks. SEAlign, our ICSE 2026 Distinguished Paper, shows the bottleneck is behavioral misalignment — and fixes it by training models to make better decisions at critical points, boosting performance to 21.8% on SWE-bench Verified.
Verdent: Your AI-native Partner
Think together. Work in parallel. A new way to build software.
That thing you've been wanting to build? Now you can.
No team to build. No developer to find. No code to write. Just tell Verdent what you want.

A new "claude-oceanus-v1-p" has been made available to Red Teams
Anthropic has released a checkpoint of their upcoming 'claude-oceanus-v1-p' model to red teams, signaling an imminent public launch.
Decoder
- Red Team: A group tasked with probing a system for vulnerabilities and security flaws to ensure safety before public release.
Original article
ANTHROPIC 🔥: A new "claude-oceanus-v1-p" has been made available to Red Teams.
This appearance may signal an upcoming release of newer Mythos models, referenced earlier by Antropic.
Soon? 👀
https://twitter.com/synthwavedd/status/2062519972379652339
More from @testingcatalog
Google Illuminate Experiment expands AI podcasts with voice customisation! 👀
As discovered previously, now you can paste any URL, pick from different voices and generate an audio podcast based on your prompt. For free.
Generated audio comes with a text transcript and it can be shared with others via a public link too.
The "Raise a hand" feature will let you ask questions to hosts. Looks like a live interview experience! 👀
#BREAKING: Microsoft's latest update introduces a Code Interpreter to Copilot, enabling users to run and execute scripts directly within the platform. #AI
As a part of the "Year of Copilot" announcement
More updates coming to Copilot later: GPT-4 Turbo, Newest DALL-E 3.
Bing Deep Search - a Google Search killer working similar to Google's generative search experience but powered by GPT4
ChatGPT Dreaming V3
OpenAI is rolling out a new memory synthesis system for ChatGPT to improve conversation continuity and relevance over long periods.
Original article
OpenAI introduced a new memory synthesis system for ChatGPT designed to improve freshness, continuity, and relevance over longer time horizons. The update began rolling out to Plus and Pro users in the US, with broader availability planned later.
Qwen-Image-Flash
A new distillation study for Qwen-Image-2.0 identifies data composition and teacher guidance as critical, non-obvious factors for achieving high-performance few-step image generation.
Decoder
- Few-step distillation: A process where a large, compute-heavy 'teacher' model is used to train a smaller, faster 'student' model to perform a task in very few inference steps.
Original article
Few-step distillation has become an effective strategy for accelerating advanced visual generative models, yet prior work has largely focused on distillation objectives. In this work, we revisit few-step distillation from a complementary perspective, focusing on the training recipe that critically shapes student performance. Using Qwen-Image-2.0 as a representative case, we systematically investigate three factors in unified text-to-image generation and instruction-guided image editing distillation: data composition, teacher guidance, and task mixture. Our empirical analysis reveals several non-obvious behaviors, which motivate the development of Qwen-Image-Flash. Overall, our results suggest that effective few-step distillation requires not only carefully designed objectives, but also principled organization of the broader training pipeline.
Nemotron 3.5 Content Safety
NVIDIA launched Nemotron 3.5 Content Safety, a unified model for enterprise moderation that supports auditable reasoning across multiple languages and modalities.
Original article
NVIDIA released Nemotron 3.5 Content Safety, a unified model for multimodal, multilingual, and customizable enterprise safety enforcement. It supported auditable reasoning and was designed to fit into production moderation pipelines.
Anthropic says 80% of its new production code is now authored by Claude — how your enterprise can catch up
Anthropic reports that 80% of its internal production code is now written by Claude, resulting in an eightfold increase in code volume per engineer.
Original article
Anthropic reported that 80% of its production code now comes from its AI model, Claude, leading to an 8x increase in code volume per engineer.
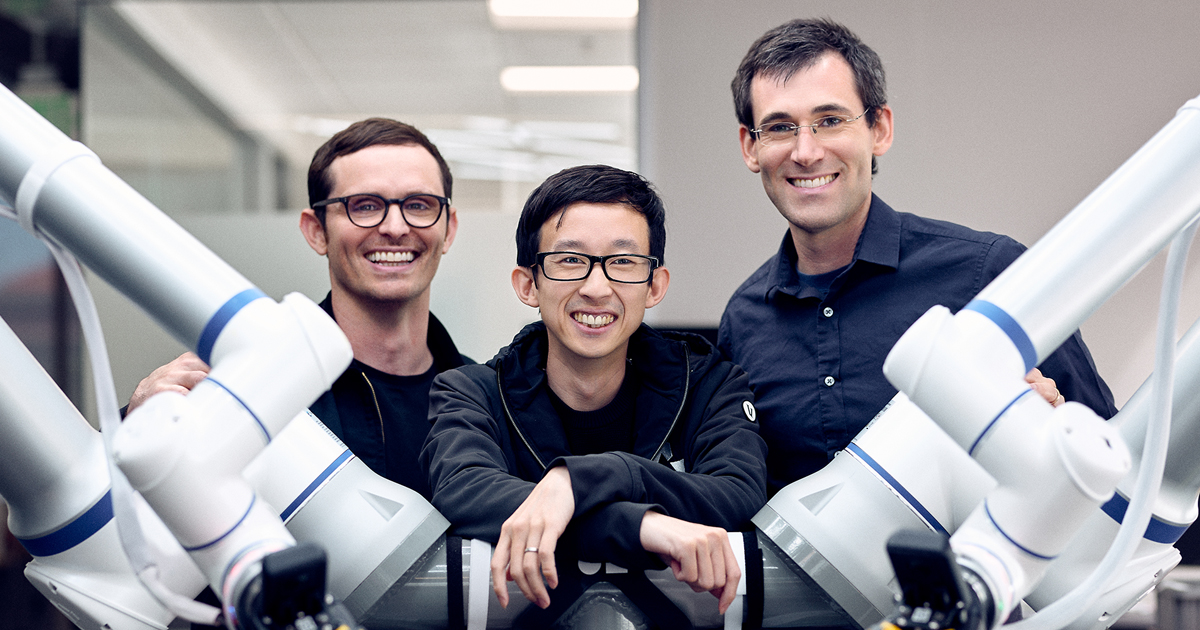
Accelerating the next phase of physical AI
Generalist AI raised $400 million to build 'physical AGI,' aiming to standardize intelligence across diverse robotic platforms from factory arms to humanoids.
Decoder
- Physical AGI: An artificial intelligence system capable of understanding and performing useful work in the physical environment across multiple types of hardware.
Original article
Accelerating the next phase of physical AI
Millions of robots are operating in the world today. Billions more are coming—across factories, warehouses, laboratories, restaurants, farms, homes, and space. They will take many forms, but they will share one need: intelligence that can understand and act in the physical world.
Today, we’re announcing $400 million in new funding, bringing our total raised to more than half a billion dollars. The capital being deployed today will accelerate our mission to build physical AGI and make it useful to everyone.
Our ambition is matched by the conviction of the partners backing us. New major investors include Radical Ventures (lead), 8VC, Union Square Ventures, Hanabi Capital, Norwest, and all our major existing investors participated significantly, including NVIDIA, Boldstart Ventures, Spark Capital, Bezos Expeditions, and NFDG. New angel investors include Bin Lin, Fei-Fei Li, and Naval Ravikant.
The frontier lab for robot intelligence
Last November, GEN-0 brought robotics into the pretraining era. For the first time, models trained on an unprecedented scale of real world data demonstrated scaling laws in robotics: proof that more physical experience and larger models can predictably produce more capable systems. This April, GEN-1 showed where that path leads: models that cross into commercial viability. Across a wide range of dexterous capabilities, GEN-1 demonstrated traction toward the practical thresholds required for real deployments, including 99% reliability on diverse tasks, execution up to 3x faster than prior state of the art, the ability to learn complex new physical skills, and the capacity for creative problem solving through emergent improvisational intelligence.
These results are not the product of a single idea. They are the compounding result of thousands of decisions, across data, models, hardware, infrastructure, operations, and deployment, made by a world-class team building at the frontier of AI and robotics. The funding gives us the resources to continue to lead in scaling robot learning: from building our next generation models, to scaling our physical data engine, from expanding our compute and training infrastructure, to working with the industries that will bring these systems into everyday use. Our goal is not to tie ourselves to any single method or label. Our goal is to build whatever is needed to make physical AGI real.
The future of robotics is bigger than any single robot. Whether it’s a humanoid in the home, a robotic arm on a factory floor, a mobile robot in a warehouse, or an autonomous system in space, the vital technology will be the intelligence that works across form factors, environments, and applications.
We are still early in the journey. The defining moments in AI have come when research breakthroughs and product inflections compound on each other. Only two months after GEN-1, we are beginning to see a flywheel take shape: scaling robot learning creates better models, better models can do more useful physical work, and data from real businesses drives the next generation of more capable models.
This is how general intelligence will emerge in the physical world: through systems that learn by acting, improve through experience, and become useful by working alongside people.
General intelligence will be born from the physical world.
— The Generalist Team
First AI agent for Messages Business Chat approved by Apple
Apple has approved the first AI agent for its Messages Business Chat platform, allowing the Poke assistant to perform various tasks directly in iMessage.
Original article
AI assistant Poke is now available on iMessage via the Apple Messages for Business platform. Poke can send emails, set reminders, generate images, and more, from within the Apple Messages app. It is compatible with third-party services and products like the Oura Smart Ring, Microsoft Outlook, Gmail, GitHub, and Navan. Poke will conduct light actions, process manual prompts, and do background tasks for free, but any intensive requests will require payment, which can be negotiated.
Anthropic Urges Global Pause in AI Development, Flags ‘Self-Improvement' Risk
Anthropic is calling for a global pause in AI development, citing risks related to systems gaining the ability to improve themselves.
Original article
Anthropic claims that AI systems will soon be able to improve themselves without human intervention. This is seen by some AI insiders as a potential marker of danger and enormous societal upheaval. Anthropic has previously been criticized for using its policy work to slow down the AI advances of competitors. Its warnings about the dangerous potential of its own tools are seen by some as a marketing ploy.
Silicon control
Semiconductor manufacturing has become the primary bottleneck for scaling AI, with a handful of firms holding a monopoly over global hardware production.
Decoder
- Semiconductor manufacturing: The complex industrial process of creating integrated circuits on silicon wafers, which serves as the physical foundation for all modern computing.
Original article
Hardware is the real means of production in the AI race. Machine labor is far more scalable and cost-effective than human labor. The demand for machine labor will likely be truly infinite. The limiting factor will be the hardware to support it. This post discusses the few dozen companies that have a monopoly on the future of semiconductor manufacturing.
What Google Did To Websites Is Happening To Your App Right Now
Google is systematically cannibalizing web traffic by shifting from a search engine to an 'answer engine' that denies users the necessity of visiting external websites.
Original article
Google has transformed from a search engine that sends traffic to websites into an answer engine that removes the reason to visit one.

Agent-led devs need serverless OpenSearch, Amazon claims
AWS redesigned OpenSearch Serverless to scale to zero and handle bursty AI agent workloads with proprietary storage-compute decoupling.
Decoder
- Agentic AI: AI systems or workflows that can independently perform tasks, reason, and interact with tools to achieve goals.
- Serverless: A cloud execution model where the provider manages infrastructure, automatically scaling resources to zero when not in use.
Original article
Agent-led devs need serverless OpenSearch, Amazon claims
System relies on a proprietary storage layer as AWS moves to separate storage and compute to fit mega AI demands
Amazon has re-engineered its serverless OpenSearch database service, separating storage and compute in a move it claims will benefit developers faced with new demand characteristics of agentic AI.
The new serverless system would avoid the problem of users paying for idle compute capacity between demand bursts, the vendor claims.
Speaking to The Register, Tia White, Director of OpenSearch, AWS said: “Collections can shrink all the way to zero when nothing's happening. We have mitigated the cold start problem, so they spin back up in seconds when traffic is needed as agents restart. It auto-scales 20 times faster than before.”
AWS promises a fully managed search and vector engine designed for customers building AI agents, offering up to 60 percent cost savings compared to the cost of OpenSearch Service clusters provisioned for peak capacity.
AWS has integrated OpenSearch Serverless into Vercel, letting developers spin up new search backends directly from the Vercel console without leaving their workflow. The service also powers the OpenSearch Launchpad inside Kiro - AWS's new agentic coding IDE - providing guided, end-to-end architecture planning for search applications. Broader AI development platform support is coming.
White said the most immediate application would be with developer coding agents. “Historically, search has not had to decouple [storage and compute], because the traffic was pretty predictable. Now with agentic workloads, even the most sophisticated technical teams need to use a serverless offering. Agentic, production-allied workloads are only going to continue to proliferate and grow.”
At the turn of the decade, ElasticSearch was the de facto database manager developers used for enterprise search. However, in 2021, Elastic adopted a more restrictive software license in order to restrict cloud service providers from creating a DBaaS based on the free open source software and making money from it. AWS responded by forking the code to create OpenSearch, which is governed by the Linux Foundation, with contributing organizations including Uber and SAP.
MongoDB and MariaDB have trodden a similar path to Elastic, with debate continuing over whether the cloud giants should be able to make money from database services without paying for the core database itself, or whether a more permissive open source development model is the best option.
White said some of the logic in the new OpenSearch serverless offering is available in the open source project, but a custom-built AWS proprietary storage layer is part of the intellectual property and is not fully open source. She could not rule out AWS making the technology open source in the future, as it has done with some IP in the past, but says there are no current plans to do so.
The OpenSearch serverless launch might be good news for people building on AWS, but bad news for Elastic.
Elastic launched its serverless search offering in 2024, promising decoupled storage and compute and auto-scaling. It updated the service in January, claiming 50 percent higher indexing throughput and 37 percent lower search latency using new AWS Graviton instances at no extra cost to users.
According to the DB-Engines ranking — which is based on website mentions, technical discussions, Google search trends, and jobs ads — ElasticSearch continues to place well above OpenSearch. The pair rank at 11th and 31st place respectively, although ElasticSearch’s ranking has fallen steadily over the last few years.

How a unified data model improves feature flag rollout decisions
Datadog argues that fragmented observability and feature flag stacks create dangerous seams that prevent AI agents from managing reliable software releases.
Deep dive
- Stitched-together stacks require manual context switching between flag management, observability, and warehouse data.
- A unified data model enables agents to instantly correlate error spikes with specific user segments.
- Warehouse-native experimentation ensures business metrics remain in user-owned storage (Snowflake, BigQuery).
- OpenFeature SDK allows for vendor-neutral feature flag implementations.
- Agents require a consolidated view to perform safe automated rollbacks.
Decoder
- Feature flag: A development technique that allows turning specific features on or off in production without deploying new code.
- Observability: The ability to measure the internal states of a system based on its external outputs (logs, metrics, and traces).
Original article
Consolidation is reshaping the experimentation and feature management landscape. Tools are merging, and partnerships are being repackaged as platforms. But marketing a unified experience is not the same as building one.
Right now, engineering leaders and product managers are reassessing whether the tools they depend on are built for the long term. It’s irrelevant which vendor has the most products. The real question is: When your release workflow crosses six systems in a single afternoon, does your tooling cross with it? The difference between a stitched-together stack of integrations and a true platform built from the ground up is architectural, and its effects are cumulative.
Why fragmented tools slow down feature rollouts
In theory, stitched-together stacks are a quick solution. When your flag tool, analytics platform, warehouse, experimentation engine, and tracing system are connected, the data flows and the dashboard lights up. Integrations further extend what each tool can see and reduce some of the manual work. But there’s a ceiling.
Picture a gradual rollout with a stitched-together stack. Your team creates a feature flag in Tool A, ties it to an experiment to measure impact in Tool B, deploys it through CI/CD in Tool C, and starts the ramp. Your flag is in Tool A, your error rates are in Tool D, and your experiment scorecard and product funnel data are in Tool B. Within minutes, error tracking alerts fire, observability dashboards populate, synthetic tests run, and product analytics capture the first user interactions.
Now something looks wrong at 5% ramp, so you export a result from Tool C, pivot it in your warehouse, then cross-reference a trace from Tool D. Someone else needs to check data quality signals, and another person loops in the experiment scorecard owner. By the time you’ve correlated everything, 20 minutes have passed and three people are in the same Slack thread trying to agree on what they’re looking at. Suddenly, the single release requires multiple different workflows to maintain it.
Before you can confidently read a result, it’s important that data quality signals, application traces, user pathways, business metrics, and warehouse tables tell a coherent story. A trustworthy experiment starts with clean data. When data lives in separate systems, each handoff creates doubt about whether what you’re seeing is real or an artifact of the seam.
Tools that see only one slice of this picture create blind spots, and blind spots compound into slower decisions and higher error rates. While context switching is frustrating for individual users, the larger problem is that its costs accumulate. When fragmented tooling becomes part of every release workflow, the resulting coordination overhead creates a recurring, often invisible drag on every team that ships.
Add depth to your tooling with a unified platform
A unified platform is not about stacking as many tools into the same view as possible. It relies on a unified data model where observability, product signals, warehouse metrics, LLM evaluations, and release state coexist and correlate as parts of a larger, synthesized system.
Now imagine the same gradual rollout as above, where your team deploys a feature flag, it ramps to 5%, and it starts experiencing error rates ticking up. But this time, your team and tools are all in the same view, with your flag state, error rates, funnel data, session replays, distributed traces, warehouse metrics, and LLM evaluation scores sharing the same data model. When something looks off, one click from the scorecard surfaces the affected traces and another opens a session replay of a user who hit a slow path.
Within minutes, you already have the answer: A downstream API call is timing out only for users in the treatment group, and only when a specific configuration is active. Warehouse metrics confirm the affected segment is small but revenue-sensitive. You confidently hold the ramp at 5% and post a single message to the team channel with the trace and replay linked, so the team responsible for the fix can start immediately.
Every integration is a seam, and seams inevitably break, introduce latency, and require maintenance. More critically, they require context switching at exactly the moment you need a complete picture. Integration means the data model is still fragmented—correlation requires an export, and context requires a tab switch. With a unified platform, there are zero exports, minimal latency, and no pivots to disconnected data sources.
Own your data with open standards
If you’re moving your experimentation stack onto a platform, you wonder about what happens if you need to move again. Platform depth should never come at the cost of owning your data or your code. The two can exist without tension, but it’s fair to demand proof at the implementation level instead of in a sales call.
Real platform depth includes data portability, which offers two non-negotiable principles for product teams: warehouse-native experimentation and the OpenFeature SDK. With warehouse-native experimentation, your business metrics stay in your Snowflake, BigQuery, or Databricks instance and not inside a vendor’s proprietary data store. You own the data, you can query it directly, and you can audit results. If you move, the data moves with you.
The OpenFeature SDK—the CNCF open source standard—works similarly in the sense that your flag code doesn’t lock you in either. It’s written against a portable, vendor-neutral API, and portability is preserved at the implementation level. Open standards and platform depth are not in tension. They should both be requirements of any vendor worth consolidating onto.
Run agentic release workflows with confidence
Having a stitched-together stack becomes significantly harder to work around with agentic AI. AI agents are taking on more of the release and experimentation workflow, and unlike humans, agents don’t have the judgment to navigate fragmented tooling. They don’t know which tab to open, who to ping, or what to check next. They operate across boundaries programmatically, and if those boundaries are seams between disconnected systems, every gap becomes a failure risk.
Datadog combines warehouse-native experimentation, application observability, product analytics, session replay, data observability, and LLM evaluations on a single data model. We’re exposing that full surface through MCP and CLI, with purpose-built clients for Claude, Codex, and Slack. And with these tools built into the same platform, new possibilities emerge when agents can operate across all of it at once without boundaries.
Let’s say your team is managing the same release ramp as our earlier examples with Datadog Feature Flags. It’s 2 a.m., and at 5% rollout the same downstream API times out in the treatment group.
This time, there’s no human on call for response. A Claude-based agent is monitoring the ramp through the Datadog MCP Server. When the error rate ticks up, the agent checks whether it’s above a certain guardrail metric and immediately correlates the spike against the flag’s exposure data. It then isolates affected traces and identifies that the timeout is only hitting users on a specific Android version. With warehouse metrics attached to Datadog, it queries Databricks to size the scope of affected users: 1.37%.
The agent makes a decision to hold the ramp for the 1.37% of users while continuing the rollout for the remaining 98.63%. It posts a message in Slack detailing the error, affected users, correlated telemetry data, action taken, and recommended fix, all ready for the team when they start the day.
That investigation isn’t possible on a stack where flag state, traces, session replays, and product data live in different systems. Stitching context across API calls, losing detail in seams, and operating with an incomplete picture cost a human team time, but they cost an AI agent its entire functionality. That’s an automated version of the swivel-chair problem and the reason why platform depth is the prerequisite for agentic workflows.
Unify your product signals with Datadog
The market will keep consolidating, and more announcements are coming. The questions to keep in mind are whether tool consolidations actually unify your data model, whether open standards protect your data, and whether you can trust that an agent acting on your behalf has everything it needs in one place.
Datadog Experiments, Feature Flags, and Product Analytics are available today, built into the same data model as our observability platform. To learn more, check out our other blog posts about how these tools work together so that you can understand your data and ship faster.

Lovable Makes Google Cloud a Primary Partner to Win Over Corporate Buyers
Lovable is pinning its enterprise growth strategy on Google Cloud, leveraging Gemini and Wiz security to convince corporate compliance teams to adopt its platform.
Decoder
- Vibe coding: A colloquial term for building software by describing intended functionality in natural language to an AI, rather than writing code manually.
- Hyperscaler: A massive cloud provider, such as Google Cloud, AWS, or Azure, capable of providing services at a global scale.
Original article
The Swedish app-builder, processing a million new projects a week, is making Google Cloud a primary partner, with Gemini models and a security layer aimed at corporate buyers.
The pitch behind Lovable has always been that anyone can build software by chatting with an AI. The harder pitch, the one that turns a viral tool into a durable business, is that a large company can trust what gets built.
On 3 June, at Google Cloud’s Nordics summit in Stockholm, Lovable set out to make that second case, announcing an expanded multi-year collaboration with Google Cloud aimed squarely at enterprise buyers.
The deal makes Google Cloud one of Lovable’s primary technology partners, anchoring its platform on Google’s AI infrastructure and Gemini models. Lovable says its users are now processing more than one million new projects every week, a volume that has outgrown the scrappy infrastructure a consumer tool can run on and needs the secure, enterprise-grade backing a hyperscaler provides.
Lovable is one of the more remarkable growth stories in recent software. Founded in Sweden and built around what the industry has taken to calling “vibe coding,” turning natural-language prompts into full-stack applications, it raised a $200M Series A in mid-2025 at a $1.8bn valuation and was reported to be valued at around $6.6bn by the end of the year. The company says builders created more than 25 million projects in its first year, and that Lovable-built applications now draw 600 million visits a month.
The collaboration is built on three pillars, and they read as a checklist of what enterprises demand before they let an AI tool near production. The first is a verified agent: Lovable has launched its Lovable Agent in Google Cloud’s Gemini Enterprise Agent Gallery, a vetted catalogue of third-party agents that corporate customers can adopt with some assurance about what they are running.
The second is security, reinforced by a new integration with Wiz, the cloud-security company Google is acquiring, to identify and remediate vulnerabilities in AI-generated code in real time, alongside continuous scanning, dependency checks, permissioning and audit trails.
The third pillar is the least glamorous and arguably the most telling: simplified procurement and billing through Google Cloud Marketplace and Gemini Enterprise.
Enterprises buy software through approved channels with predictable invoicing, and being available where a corporate buyer already has a billing relationship removes a quiet but real barrier to adoption. The pillar exists because procurement, not capability, is often what stalls enterprise deals.
The security emphasis is the substantive part of the announcement, because it speaks to the central anxiety about AI-generated code. Tools that let non-engineers ship applications also let them ship vulnerabilities they cannot see, and for a regulated enterprise that risk is disqualifying.
Wrapping Lovable’s output in continuous scanning and remediation is the company conceding that “anyone can build” needs “and it will be checked” attached before a serious buyer signs on.
There is a competitive subtext worth noting. Lovable sits in a crowded vibe-coding field alongside Cursor, Replit and Bolt, and the AI model providers themselves are building rival app-creation tools.
Tying tightly to Google Cloud, and to Gemini, gives Lovable a hyperscaler’s distribution and infrastructure at a moment when its rivals are racing for the same enterprise budgets. It also slots into Google’s broader campaign to win the “agentic enterprise,” the same push behind its $750M partner fund for agentic AI.
As a Google Cloud announcement, the framing is naturally Google’s, and the deeper commercial terms, what each side pays and commits, are not disclosed. What the partnership establishes is direction.
Lovable has decided its next phase runs through the enterprise, and that getting there means less talk of how easy building is and more proof that what gets built is secure, governed and accountable. The million projects a week are the easy part. Convincing a Fortune 500 compliance team is the part this deal is for.
Being an AI-native Designer isn't What You Think it is
True AI-native design is less about tool proficiency and more about using critical thinking to define problems before AI accelerates the execution.
Original article
AI-native design isn't about building chatbots or mastering new tools, but rather developing critical thinking skills to break down ambiguous problems. After 28 design leader interviews, the most valuable skill is asking why we're building something and for whom, rather than immediately jumping into wireframing. AI-native designers use critical thinking to clearly define problems first, then leverage AI for tedious tasks like compiling meeting notes, parsing transcripts, and generating design variations.

How IKEA Uses Four UX Strategies to Simplify Complex Buying Decisions
IKEA’s digital UX success stems from reducing decision anxiety by using guided flows and room-based context rather than just listing features or products.
Decoder
- Cognitive load: The total amount of mental effort being used in the working memory; in UX, reducing this means making an interface easier for users to process without getting overwhelmed.
Original article
IKEA UX is one of the strongest examples of how thoughtful design can make a complex buying journey feel simple, practical, and easy to follow.
Buying furniture is rarely a simple decision. Customers are not only choosing a product. They are also thinking about how that product will fit into their home, whether it matches their style, how much space it will take up, how much it will cost, and whether they will still be happy with the decision months or years later.
That is a lot of pressure for one purchase.
This is why IKEA’s approach to user experience is worth studying. IKEA does not only sell furniture. It designs a buying journey that helps people make decisions with more confidence. From guided product flows to realistic room setups, IKEA reduces uncertainty at every stage of the customer journey.
For ecommerce brands, SaaS companies, service businesses, and digital products, there is a lot to learn from this approach. When a decision feels big, confusing, or risky, good UX should not overwhelm users with more information. It should help them understand their options, compare choices, and move forward with confidence.
At Raw.Studio, this principle is central to effective UX and conversion design. A strong digital experience should not only look good. It should reduce friction, answer important questions, and guide users toward the right action.
In this article, we will break down four IKEA UX strategies that simplify complex buying decisions, and how you can apply the same thinking to your own website or digital product.
Why Furniture Buying Is So Complex
Furniture buying is complex because it combines emotion, practicality, and financial risk.
A customer might wonder whether a sofa will fit in the living room, whether the colour will look different in real life, whether the material will be easy to clean, or whether the product will match the rest of the home. They may also need to consider delivery, assembly, measurements, budget, and long-term durability.
Unlike a small everyday purchase, furniture can change how an entire room feels and functions. A poor decision can be expensive, inconvenient, and difficult to reverse.
This creates decision anxiety.
Customers are not simply comparing products. They are trying to imagine a future version of their home. They are asking themselves whether the product will solve their problem, improve their space, and feel right in everyday life.
IKEA understands this challenge. Instead of relying only on product pages and price tags, IKEA supports the full decision journey. It gives customers guidance, visual context, practical information, and reassurance.
This is what makes IKEA UX so effective.
Strategy 1: Guided Flows That Help Customers Know Where to Start
One of IKEA’s strongest UX strategies is the way it guides customers through broad choices.
Instead of forcing people to begin with thousands of individual products, IKEA often organises the experience around rooms, needs, categories, and use cases. Customers can shop by bedroom, living room, kitchen, storage, office, or outdoor space.
This immediately makes the experience easier to navigate.
Most customers do not begin with detailed product knowledge. They usually begin with a problem or a goal. They might think, “My bedroom feels cluttered,” “My kitchen needs more storage,” or “I need a better workspace at home.”
IKEA’s navigation supports this natural way of thinking. It allows customers to start with the area of life they want to improve, rather than forcing them to know the exact product they need.
This reduces mental effort.
For digital products and service websites, the same principle applies. If users arrive with uncertainty, the website should help them choose a path. A SaaS company might guide users by role, such as founder, marketer, operations manager, or designer. A service business might guide users by problem, such as low conversions, unclear messaging, poor onboarding, or slow website performance.
The goal is not to remove choice completely. The goal is to make choice feel manageable.
A good guided flow helps users answer one important question: “Where should I begin?”
Strategy 2: Product Visualization That Reduces Guesswork
Another key part of IKEA UX is product visualization.
One of the hardest parts of buying furniture is imagining how a product will look in a real space. A sofa may look appealing on a white background, but customers still need to know whether it will suit their living room. A wardrobe might seem practical online, but customers still need to understand its scale, storage capacity, and visual impact.
IKEA reduces this uncertainty by showing products in context.
Its product images often show furniture inside realistic rooms. Customers can see how a table looks with chairs, how a bed looks with bedding, or how a storage unit looks when it is filled with everyday items. This makes the product easier to understand.
It also makes the outcome easier to imagine.
Instead of forcing customers to picture everything on their own, IKEA gives them a visual shortcut. The product is not presented as an isolated object. It is presented as part of a real lifestyle, room, or practical solution.
This matters because customers need to answer one key question before they buy: “Can I see this working for me?”
The clearer the visualization, the easier it is for customers to say yes.
Digital products can use the same approach. A website should not only describe what a product or service does. It should show the result that users can expect.
This could include product screenshots, dashboard previews, before-and-after examples, case studies, interactive demos, or visual walkthroughs. For service businesses, it could mean showing the process, the deliverables, and the transformation from the client’s current problem to the desired outcome.
This is especially important when the offer is abstract. UX design, branding, CRO, analytics, software, and consulting can be difficult for users to evaluate because they are not always tangible. The more abstract the offer, the more important it becomes to visualize the value.
If users cannot picture the outcome, they are more likely to hesitate.
Strategy 3: Room Setups That Create Real Context
IKEA’s room setups are one of its most recognizable UX strategies.
In-store, customers do not only see furniture displayed on shelves. They walk through complete rooms. Bedrooms are styled with beds, side tables, lighting, rugs, and storage. Kitchens are shown with cabinets, appliances, benches, and accessories. Living rooms are arranged with sofas, coffee tables, lamps, cushions, and shelving.
These room setups are not only decorative. They are a powerful decision-making tool.
A complete room gives customers context. It shows how different products work together. It helps customers understand scale, style, functionality, and compatibility. It also gives them ideas they may not have considered before.
This is important because many buying decisions are connected. A customer may like a dining table, but then wonder which chairs match it. They may like a bed frame, but also need storage, lighting, bedding, and bedside tables. Every extra decision adds more friction.
IKEA reduces that friction by presenting complete solutions.
Instead of asking customers to build the full picture from scratch, IKEA gives them a finished example. This helps customers feel more confident because they can see how individual products combine into a practical and attractive result.
Digital brands can apply the same principle by giving users more context around their products or services.
Instead of presenting features as a flat list, a website can group them into meaningful use cases. Instead of showing services separately, an agency can show how those services work together to solve a larger business problem.
For example, a UX agency could present its services as a complete journey. It might begin with discovering where users are dropping off, then move into redesigning the experience, testing key pages, and launching a clearer, higher-converting website.
This is easier to understand than a disconnected list of services.
IKEA’s room setups work because they respect that context. They help people understand how a product fits into real life.
Strategy 4: Step-by-Step Journeys That Make Big Decisions Feel Smaller
IKEA also simplifies complex buying decisions by turning large journeys into smaller steps.
This is especially useful for categories such as kitchens, wardrobes, storage systems, and home offices. These are not simple one-click purchases. They require measurements, layout planning, component choices, materials, colours, accessories, delivery options, and sometimes installation.
If all of this information were presented at once, the experience would feel overwhelming.
IKEA makes the process easier by breaking it down into stages. Customers can choose a room, select a system, measure their space, plan the layout, pick components, review the design, and decide on delivery or pickup.
Each step asks the customer to make one smaller decision.
This makes the overall journey feel more manageable.
The same principle is useful for websites and digital products. Many websites fail because they present too much information too early. They expect users to understand the full offer, compare every feature, trust the brand, evaluate pricing, and take action all at once.
That creates cognitive overload.
A better approach is to guide users through the journey in a clear sequence. The website should help users understand the problem, see the solution, evaluate the proof, understand the process, and then take the next step.
This is especially important for high-consideration products and services. If the purchase requires trust, education, budget approval, or stakeholder buy-in, the UX needs to support the full decision-making process.
That is exactly what IKEA does well. It does not make complex purchases feel simple by removing the details. It makes them feel simple by organising the details into a clear journey.
Why IKEA UX Works So Well
IKEA UX works because it reduces uncertainty.
Uncertainty is one of the biggest reasons people delay decisions. When customers are unsure, they compare more options, leave items in their cart, ask someone else for advice, or postpone the decision altogether.
IKEA reduces uncertainty at different stages of the journey.
Guided flows help customers understand where to start. Product visualization helps them imagine the outcome. Room setups show how products work together. Step-by-step journeys make large decisions feel smaller and easier to complete.
Together, these strategies create a more confident buying experience.
The key lesson is not that every brand should copy IKEA’s design style.
The lesson is that every brand should reduce the gap between interest and action.
When users understand their options, see the outcome, and know what to do next, they are more likely to move forward.
How to Apply IKEA’s UX Thinking to Your Website
You do not need to be a global furniture brand to apply the same UX principles. Whether you run an ecommerce store, a SaaS product, a service business, a marketplace, or a startup website, IKEA’s approach offers useful lessons.
The main idea is simple: make complex decisions easier to understand.
Guide Decisions
Your website should help users choose the right path.
Do not assume that visitors already know what they need. Many users arrive with a problem, not a product category. They may know they are frustrated, stuck, or looking for improvement, but they may not know which solution is right for them.
You can guide decisions by organising your website around user goals, pain points, roles, industries, or outcomes. This helps users quickly identify where they fit and what they should explore next.
A clear decision path reduces confusion and makes the experience feel more personal.
Visualize Outcomes
Your website should help users imagine the result.
People are more likely to take action when they can see what success looks like. This is why screenshots, product demos, before-and-after examples, case studies, prototypes, and visual walkthroughs are so useful.
Do not only explain your offer in words. Show the transformation.
If you sell a product, show it in use. If you sell a service, show the process and the outcome. If you sell software, show the workflow. If you sell strategy, show how the thinking turns into a practical result.
The easier it is for users to picture the outcome, the more confident they will feel.
Break Down Complexity
Your website should make complex decisions feel smaller.
If your offer has many features, stages, deliverables, or options, organise them into a clear journey. Explain what happens first, what happens next, and how the user gets from problem to solution.
Complexity is not always a bad thing. In many cases, complexity means the offer is valuable, detailed, or highly capable. The problem is when that complexity is presented without structure.
IKEA does not pretend that designing a kitchen is simple. Instead, it gives customers a process that makes the decision easier to manage.
Your website can do the same.
Final Thoughts
IKEA UX is effective because it respects the customer’s mental load.
Furniture buying is complex, but IKEA makes the experience feel easier by guiding decisions, visualizing outcomes, creating real-life context, and breaking large journeys into smaller steps.
This is the foundation of strong UX. Good design is not only about creating attractive interfaces. It is about helping people understand their options, reduce uncertainty, and make better decisions with less effort.
For brands, this creates a major competitive advantage. When your website reduces confusion, users stay longer, understand faster, and convert with more confidence.
If your product, service, or website feels too complex for users to understand quickly, the issue may not be the offer itself. It may be the way the experience is designed.
Need help turning a complex offer into a clearer, higher-converting digital experience? Work with Raw.Studio to design a website or product journey that guides users from confusion to confidence.

Is AI Killing User Experience?
AI enables rapid prototyping, but excessive speed is creating shallow user experiences that lack the human empathy and deep discovery essential for trust.
Deep dive
- AI can generate journeys, personas, and code, but cannot observe human emotions or context.
- Over-reliance on speed causes 'shallow understanding' and me-too products.
- Recommends a hybrid model: use AI to accelerate synthesis and prototyping, but retain human oversight for strategy and empathy.
- Emphasizes that UX is a narrative structure that links business goals to human behavior.
- Warns that AI-generated artifacts can create a false sense of confidence in research results.
Decoder
- Ethnography: A qualitative research method where designers observe users in their natural environment to understand their behaviors and pain points.
- Service blueprint: A diagram that visualizes the relationship between different components of a service (people, props, processes) to understand how a customer experience is delivered.
Original article
AI has changed the pace of product design almost overnight. Ideas that once took weeks to sketch, prototype, and test can now be made visible in hours. A product manager can describe a workflow and get a working prototype. A strategist can turn a client’s rough concept into a clickable experience before the meeting ends. A founder with no technical background can “vibe code” a beta version of their product for an investor pitch.
This is not a small shift. It compresses time, lowers barriers, and gives more people the ability to participate in creation. For organizations trying to move faster, it feels like a gift.
Yet the customers on the receiving end are not sold. Despite the perceived gains in speed and personalization, only 17% of consumers believe their experiences are getting better, according to a March 2026 Medallia report. A separate February 2026 Pega study found that more than 60% of consumers lack confidence in how businesses use AI to interact with them.
The more AI accelerates the making of experiences, the more important it becomes to understand who those experiences are for. We can generate customer journeys, personas, screens, content, and front-end code faster than ever. None of that guarantees we have understood the end user’s moment or the context around it and the emotion underneath it.
So the question is not really whether AI is killing user experience (UX). The better question is whether AI is exposing the parts of UX that organizations have been treating as optional.
UX Has Never Been Just the Interface
For years, organizations have used the language of user experience while narrowing the practice to screens, flows, and usability. Those things matter. A confusing interface can ruin a great idea. A broken flow can erode trust in seconds. But UX at its best has never been limited to the surface of the product.
Good UX begins before the wireframe. It begins with curiosity: Who is this person? What are they trying to do? What is getting in their way? What do they believe before they arrive? What would make them feel understood?
Those are not just design questions. They are story questions.
Every useful product experience — whether an internal enterprise tool or a customer-facing app — has a narrative structure. There is a character, a tension, a desired outcome, and a path through uncertainty. Sometimes the story is simple: I need to pay a bill without friction. Sometimes it is emotional: I need to understand a medical result without panicking. Sometimes it is social: I need to complete this task without looking foolish in front of my boss or my customer.
UX is where that human story becomes operational. It connects business strategy to human behavior. It translates brand promise into lived experience. It blends data and observation, analytics and empathy, system performance and emotional resonance.
AI can help with much of that. It can summarize research, analyze patterns, generate prototypes, and propose design alternatives. But it does not automatically know what matters. It does not stand in the rain watching customers struggle with a broken process. It does not hear the sigh before someone abandons a transaction. It does not feel the subtle difference between “This works” and “This understands me.”
The better question is whether AI is exposing the parts of UX that organizations have been treating as optional.
The Speed Trap
The most seductive promise of AI is time compression. Teams can move from idea to artifact faster than ever, test more options, and abandon weak ideas quickly. In many cases, AI will make teams more creative, more collaborative, and more productive.
But there is a trap inside that speed. Just because we can build something in an hour does not mean it is good. It does not mean it solves a real problem. It does not mean anyone will use it. And it certainly does not mean the organization has done the hard work of understanding why the experience should exist in the first place.
When every team has access to similar tools, similar prompts, and similar model-generated patterns, expect more sameness, not less. AI can help organizations produce a lot of competent work. It can also help them produce a lot of me-too experiences that look finished before they are truly thought through.
That is where UX becomes more valuable, not less. The role of UX in an AI-powered world is not to slow everything down for the sake of process. It is to protect brand meaning and differentiation while the organization moves faster — to ensure rapid creation does not become rapid confusion, and to help teams distinguish between a prototype that looks plausible and an experience that earns trust.
AI can accelerate the what. UX has to defend the why.
The Risk Is Shallow Understanding
The most valuable moments in UX often live in the in-between spaces. They are not always obvious in clickstreams or neat rows in a spreadsheet. They emerge from watching real people navigate real situations with all the impatience, improvisation, and emotion that come with being human.
Without getting out from behind the screen and walking in the shoes of your users, designers will likely fail to get to the deep insight needed to create experiences that people love.
UX field research for a growing convenience store that offered gas and quick-service meals revealed a hidden behavior: Consumers felt guilty leaving their cars at the gas pump and blocking other cars while waiting for their food to be prepared. Overcoming this “pump anxiety” was a key design point in their mobile app that allows customers to order ahead and know that their food will be ready when they pull in. A purely AI-driven UX process would have missed this.
AI tools can create a persona, draft a journey map, propose a service blueprint, and summarize user pain points. Those outputs can be useful starting points. But they can also create a false sense of confidence. The artifact looks like research. The prototype looks like design. The deck looks like strategy. The interface looks complete.
But did the team actually learn anything? Did they spend time with the people they are trying to serve? Did they understand the emotional context of the moment? Did they test with real users? Did they discover anything surprising? Did they change their minds?
If the answer is no, then AI has not killed UX. It has simply helped the team skip it faster.
This is where leaders need to be careful. AI can make weak discovery look polished, premature ideas look market ready, and average thinking look more sophisticated than it is. The cost rarely shows up immediately. It shows up later as low adoption, customer distrust, support volume, rework, churn, or a product that technically works but never becomes part of the customer’s life.
The future belongs to teams that use AI to deepen understanding, not avoid it.
Every AI-powered experience should still answer a human question: What is this person trying to do right now, and how can we help?
Toward AI-Augmented UX
The right path is not resistance. UX teams should not treat AI as an intruder. They should treat it as a collaborator that changes the economics of exploration.
AI can help researchers synthesize large bodies of feedback, generate alternative flows, simulate use cases, identify edge cases, and prototype variations quickly. It can support accessibility reviews, content testing, localization, and design QA. Used well, AI expands optionality — but only if paired with human judgment.
The strongest teams will build a hybrid model where AI supports speed and scale while UX protects strategy, empathy, and trust. That model requires new habits.
Teams need to separate generation from validation. AI can generate possibilities, but users validate value. A hundred prototype variations are only useful if the team knows what it is trying to learn.
Teams need to treat trust as a design requirement. As AI becomes more embedded in products, users will want to know what the system is doing, why it is making a recommendation, when a human is involved, and how much control they still have.
Teams need to design for explanation, not just interaction. In AI-powered experiences, systems may make decisions, predictions, or summaries that feel opaque. The UX challenge is not only to make the interface usable. It is to make the intelligence feel understandable.
And teams need to keep the story in view. Every AI-powered experience should still answer a human question: What is this person trying to do right now, and how can we help?
Upskilling UX Practitioners
We are entering a period where UX, product strategy, service design, behavioral insight, and AI literacy will become more tightly connected. Call it AI interaction design, AI-augmented UX, or simply the next version of good product work. The label matters less than the discipline.
Designers will need to understand how AI systems behave. Researchers will need to test not only whether users can complete a task but whether they trust the system helping them do so. Product leaders will need to decide where automation belongs, where human review is essential, and where intelligence should be visible or invisible.
UX professionals will need fluency in prompts, agents, model behavior, explainability, bias, and human-in-the-loop design. AI teams will need fluency in empathy, context, story, and adoption. Business leaders will need to stop treating UX as decoration at the end of the process and start treating it as a strategic capability at the beginning.
An automated experience often feels like the company found a cheaper way to avoid you. An aware experience feels like the company understood your situation and used intelligence to help. That is the bar.
AI is not killing UX. It is forcing UX to grow up.
Recommendations for Leaders
The practical path forward is not complicated, but it does require intention:
- Invest in UX as a strategic asset. Do not reduce research and design capacity because AI can produce artifacts faster. The volume of possible output is about to explode — and the organization will need stronger UX judgment to make sense of it.
- Retrain teams to work alongside AI. Designers, researchers, strategists, and product managers should all learn to use AI tools responsibly. But the goal is not tool fluency alone. It is better questions, faster learning, and clearer decisions.
- Build trust into AI experiences from the start. Transparency, explainability, control, escalation, and human oversight should not be bolted on after launch. They belong in the experience architecture from day one.
- Protect deep discovery. Don’t mistake generated output for user understanding. Use AI to accelerate synthesis and prototyping, but do not let it replace observation, interviews, ethnography, and the deliberate work of understanding real human context.
- Reward learning, not just shipping. The teams that win with AI will not be the ones that generate the most screens. They will be the ones that learn the most useful things and turn that learning into experiences that customers trust.
AI Is Not the End of UX
AI is not killing UX. It is forcing UX to grow up. It is pushing the practice beyond static screens and into intelligent systems. It is challenging teams to move faster without becoming shallower. It is exposing the difference between design output and human understanding.
The best UX of the future will be AI powered but human led. It will use machines to generate, analyze, and accelerate. It will use people to observe, interpret, empathize, and decide what matters. And it will remember something every good storyteller knows: The technology is never the hero of the story. The human being is.
If AI helps us understand the user more deeply, respond to them more intelligently, and guide them through the moments that matter, then it will not kill UX. It will make UX more essential than ever.

Why Visual Storytelling in UX Matters More than Ever
Visual storytelling reduces cognitive load by replacing complex text with imagery, which the brain processes 60,000 times faster, directly impacting conversion rates.
Deep dive
- Visuals process 60,000 times faster than text, helping to maintain engagement.
- Simplifies complex information, preventing user abandonment due to cognitive overload.
- Video is cited as the preferred learning format for 63% of consumers.
- Emotional design and visual narratives significantly boost trust in competitive markets.
- User-generated visuals and real-world project galleries help establish authenticity.
Decoder
- Cognitive load: The total amount of mental effort being used in the working memory; in UX, this refers to how hard a user has to think to navigate a site.
- Progressive information disclosure: A UX strategy where information is shown to users only when they need it, preventing them from being overwhelmed.
Original article
Though often dismissed as irrelevant, stories are at the core of what it means to be human. From history to the news to entire belief systems, people (and their actions) are strongly influenced by narratives. It should come as little surprise that storytelling represents one of the most impactful marketing strategies — particularly for businesses aiming for differentiation.
However, what most business owners, designers, and marketers overlook is that storytelling also plays a role in determining website user experience.
Ultimately, stories and user experience design both aim to accomplish the same goal: guiding listeners/viewers/website users through an experience while prioritizing clarity and purpose.
But here’s the deal. The role of storytelling in web design isn’t just narrative. Yes, designers can borrow narrative techniques to attract leads into their sales funnels (and nudge them toward a conversion). Nevertheless, it’s just as important to note that storytelling also aligns with what consumers expect from businesses — now more than ever. Moreover, when storytelling incorporates visuals, its impact in UX design becomes even more powerful.
Are you interested in optimizing your site’s UX design? Do you want a more effective way to connect with your target audience (and guide them through the buyer’s journey)? Here’s everything you need to know about why visual storytelling in UX matters more than ever, along with a few actionable tips on how to apply it to your business’s online presence.
The Brain Processes Visuals Faster Than Text
There’s no doubt about the fact that incorporating any type of storytelling into your website’s UX design is a great choice. But to drive tangible results (i.e., sales), one of the best decisions you can make is to rely on visuals rather than text.
Yes, written narratives are engaging and effective at guiding web visitors through the buyer’s journey. Nevertheless, research consistently shows that humans react more strongly to visual formats than written text.
Data suggests that the human brain processes imagery 60,000 times faster than written words. Web user behavior data also indicates that people tend to gravitate toward visual elements when consuming online content — whether on websites or on social media.
With this in mind, one of the easiest methods to incorporate visual storytelling in your site’s design is to use it to communicate product value — especially when it can do so with a speed and efficiency that descriptions can’t.
As an example of how easy this is to accomplish, check out the Drift homepage. This brand understands that it sells a somewhat unconventional type of product, which is why its UX design prioritizes product understanding. To accomplish its goal, Drift simply employs visuals to quickly communicate core product features — a visual storytelling technique that significantly boosts visitors’ product understanding and purchase intent.
Visual Storytelling Reduces Cognitive Load
Simplicity — or ease of use, to be more precise — is a crucial aspect of user-friendly web design.
Research clearly shows that web users prefer websites that are simple and predictable. Moreover, data reveals that too much complexity can reduce website user experience, primarily by overwhelming visitors with excess information.
Ultimately, the goal of user-friendly design is to avoid these outcomes, and not just because navigating too much complex text can feel tiring or frustrating for web visitors. Much more importantly, because excess cognitive load can often prevent movement through the sales funnel, causing shoppers to stall in their decision-making or totally abandon the buyer’s journey.
Naturally, UX design can help reduce cognitive load — whether through formatting, layout optimization, progressive information disclosure, or by replacing text with more user-friendly formats. However, very few of these tactics can be as effective as visual storytelling.
Though it’s not commonly used in UX design, visual storytelling — particularly in video format — can be exceptionally effective at empowering visitors with high-value information without causing overwhelm or frustration from text complexity. Additionally, if you look at the data on how consumers prefer to learn about new products, you’ll find that 63% of people’s favorite way is to watch a short video.
So, one of the easiest methods to elevate website user experience through visual storytelling is to incorporate short (or long-form) videos into your design, primarily to educate prospects about how your products work or how they can resolve their pain points.
For instance, if you check out Golf Cart Tire Supply, you’ll notice the homepage features an instructional video. This resource teaches viewers how to convert their golf carts to lithium power. This visual storytelling resource explains an otherwise complex process in a way that’s accessible to practically anyone. On top of that, it facilitates product discovery through relevant product mentions, effectively guiding this brand’s target audience through the entire buyer’s journey within a single piece of content.
Images and Videos Boost Engagement Rates
Website engagement rate is one of the most important UX metrics to track to evaluate the effectiveness of your site at driving conversions. And while there are numerous UX design tactics you can employ to elevate web visitors’ willingness to engage with web content, incorporating visual storytelling into your online presence could be exceptionally effective.
If you’re not entirely convinced that this is the case, just look at the latest data on what content formats manage to attract and retain consumer attention on social media websites (where they’re constantly bombarded with information). According to research from 2026, some of the most engaging social media formats include carousels, short-form videos, and images.
But it’s not just that images and videos align with the type of content web users prefer to interact with. They can also play a key part in keeping readers focused, especially when used alongside storytelling to guide prospects through the buyer’s journey.
The Jeni’s Ice Creams homepage is an exceptional example of what this means in practice. This brand understands that standing out in its target industry isn’t easy — especially considering that it needs to compete with several big businesses. So, to ensure higher on-site engagement rates and create a memorable user experience, Jeni’s combines photography and storytelling to educate customers about its product and its primary features, including factors like texture, melt, flavor, and the philosophy behind each ice cream scoop.

Stories Drive Connection and Appeal to Consumer Emotions
According to consumer behavior research, the majority of all shopping decisions are subconscious. And it’s not that buyers don’t actively seek to make the best possible choice when evaluating potential solutions to their pain points. It’s that their actions are much more easily swayed by messaging that appeals to their emotions or that makes them feel connected to a specific brand.
But what does emotional design have to do with website user experience? It all boils down to what consumers seek when buying a product or hiring a service provider. These days, it’s about much more than just solution features.
According to new data from Adobe, the two core elements of customer experience for 2026 include connection and emotional appeal. The organization states that 50% of shoppers are more likely to buy from brands that make them feel joy. Moreover, 70% of consumer decisions are driven by emotion.
So, if you consider the fact that UX design can help businesses position their products as more than just functionality and assign meaning and enjoyment to their offer, it’s evident that the non-rational aspects of website design deserve just as much attention as those focusing on technical specs.
And the easiest way to use UX to drive connection and appeal to consumer emotions is through visual storytelling.
For example, incorporating the right narratives into your online presence can demonstrate that your brand genuinely understands its target audience. Moreover, some visual storytelling UX decisions can make your prospects more invested in what your brand has to say, which automatically drives better memorability and recognition — two key factors in determining your leads’ chances of converting into customers.
If you check out Brain Ritual, you’ll notice that this business actively uses video-based storytelling to communicate the effectiveness of its solution. Instead of making impressive claims, Brain Ritual simply dedicates a section of its homepage to user-generated video testimonials. Here, satisfied customers share personal stories about using the brand’s product.
This type of visual storytelling doesn’t just make it super easy for first-time web visitors to comprehend the products’ value. Nor does it stop at encouraging leads to perceive the business as trustworthy. More importantly, this tactic drives an emotion-based connection that’s more likely to lead to a conversion down the line.

Visual Storytelling Creates Excitement About Everyday Products
In some niches, the biggest UX design challenge isn’t supporting consumers while they move through the buyer’s journey. Instead, the most difficult aspect of creating engaging, user-friendly website experiences is that the brand’s niche is simply unexciting.
Yes, ‘boring’ businesses can be extremely profitable. Nevertheless, making prospects feel elated about a conversion in these niches is often a Sisyphean task.
The good news is that storytelling — particularly that which incorporates attractive visuals — can help.
Using images and videos can be a great way to entertain or connect with your audience. You can even use these formats to convey the value your solutions offer.
What’s fascinating, however, is that telling product stories this way can actually make your target audience feel excitement about the prospect of interacting with your business and, potentially, purchasing with your brand.
For instance, if you check out the Custom Sock Lab website, you’ll find an extensive Gallery page. Here, the business shares past projects it has done for customers. Now, socks may not be the most appealing product. However, by using imagery and providing some basic information about the context each custom design was created for, Custom Sock Lab manages to position its offer as an attractive solution to a common customer pain point, all the while designing a website user experience that gently guides visitors toward the bottom stages of the sales funnel through usability, informational value, and trust-building elements.
Stories Prevent Marketing Fatigue
Optimizing your website for user-centricity isn’t just about ensuring your ideal customers have an enjoyable experience while browsing your offer. It’s equally important to create an online presence that doesn’t overwhelm or frustrate your audience. Especially in a world where 67% of people say that they’re suffering from marketing fatigue.
Essentially, today’s consumers are practically bombarded with marketing messages.
Some of these are enjoyable, relevant, and genuinely matter to shoppers trying to resolve their pain points. But the majority are purely conversion-oriented, often even being seen as unimportant.
So, when exploring the benefits of incorporating visual storytelling into your site’s UX design, it’s important to understand that the right narrative can transform your messaging from frustrating noise to something your audience truly wants to learn more about.
If you check out The Pig, you’ll quickly see how this brand uses visual storytelling to position its hospitality business as exciting and innovative — not just another generic hotel chain trying to attract customers with the same old offer of luxury. With a homepage video that tells the tale of garden-to-table, The Pig employs UX design to communicate value without forcing visitors to read a single word of copy, creating an exceptionally smooth and enjoyable website experience that sells without making leads feel like they’re being sold to.

Use Visual Storytelling as a Tactic to Establish Brand Authenticity
Lastly, when exploring the value of incorporating visual storytelling into your UX design, it’s crucial to understand that highly usable, consumer-centric websites drive customer trust, which, in turn, boosts purchase intent.
In traditional approaches to branding and marketing, the primary methods of earning customer trust include showing social proof and trust signals throughout your website. Nevertheless, it’s important to remember that how well your website works says just as much about your brand’s competence and dependability as any other marketing message in your online presence.
So, investing in UX design could be a natural continuation of your trust marketing efforts, particularly in highly competitive or low-trust industries.
But what other ways are there for your business to boost brand trust through optimizing for user experience?
Well, if you consider that trust is earned by proving expertise, showcasing benevolence, and establishing brand authenticity, it’s easy to conclude that emphasizing your company’s genuineness could allow you to design more enjoyable browsing experiences for site visitors. And visual storytelling can accomplish a great deal in this regard.
From using visuals to showcase the timeline of your brand’s story to producing videos that feature the team behind your business, you can use multiple visual storytelling strategies to establish brand authenticity.
Or how about if your focus is more on product marketing rather than just brand positioning? In that case, you can do something similar to Pergola Kits USA and use user-generated visuals to describe your products and customer experience processes, so potential customers have a clear idea of what to expect if they convert.
Takeaways
Visual storytelling can be a marketing, branding, and conversion optimization goldmine — as long as you use it right. And even though its role in your advertising strategies is undisputed, don’t forget that it can be just as valuable when incorporated into your site’s UX design.
By following the tips above, you can easily apply visual storytelling in your online presence.
And if you want to verify that these design strategies work for your business (and contribute to your specific goals), you can use UXPin’s UX Design features to test and validate your ideas. That way, you can ensure that your hard work translates into desirable outcomes, enjoyable user experiences, and overall business success.
Apple's Messages app on iPhone now has a third-party AI agent
Apple has officially approved the integration of the third-party AI agent 'Poke' into the iPhone Messages app.
Original article
Apple approved the third-party AI service Poke for use in its iPhone Messages app. This integration allows users to chat with Poke directly in iMessage to perform various tasks. Some users report issues with response times, likely due to high demand.
EVA-Bench Data 2.0: 3 Domains, 121 Tools, 213 Scenarios
ServiceNow updated EVA-Bench to version 2.0, expanding the evaluation suite to cover enterprise domains including Airline CSM, IT Service Management, and Healthcare HR.
Decoder
- ITSM (IT Service Management): Policies and practices for managing the delivery of IT services to customers.
- HRSD (Human Resources Service Delivery): The framework for managing HR tasks and interactions, often automated within large enterprises.
Original article
EVA-Bench Data 2.0 expands its evaluation to three domains: Airline CSM, Enterprise ITSM, and Healthcare HRSD.
SpaceX, Other Mega IPOs Denied Fast Index Entry by S&P
S&P Dow Jones Indices has rejected calls to shorten its IPO 'seasoning' period, maintaining strict 12-month requirements for companies like SpaceX.
Decoder
- Seasoning period: The duration a company must be publicly traded before it is eligible for inclusion in an index, designed to filter out short-term price volatility.
Original article
S&P Dow Jones Indices will not shorten its 12-month seasoning period for newly public companies or waive profitability and public-flowed requirements based on a company's size.
Nested layout for pipeline graph view
Jenkins Pipeline Graph View now supports arbitrary nested parallel and sequential stages, replacing the previous limited column-based visualization.
Original article
Jenkins Pipeline Graph View now includes a new graph-based nested layout that fully visualizes arbitrarily nested parallel and sequential stages.
Google Photos Will Turn Your Pictures Into a Digital Wardrobe that You Can Mix-and-match
Google Photos is introducing a Wardrobe feature that uses AI to catalog clothing items and suggest outfits directly from your image library.
Original article
Google Photos is rolling out a new feature called Wardrobe that scans users' photo libraries to automatically identify clothing items and group them into a digital closet for mixing and matching outfits. The feature requires enabling Face Groups and meeting regional age requirements, and is initially available to Google AI Pro and AI Ultra subscribers in Brazil, India, and the US, with iPhone and iPad support coming later. Beyond wardrobe organization, it signals a broader shift in Google's AI strategy toward managing everyday personal decisions, not just search and productivity.
AI-created document fatigue: how I designed my way out of it
Designers are fighting 'AI document fatigue' by shifting from screen-centric reviewing to voice-based, asynchronous tools like ARC to avoid burnout.
Original article
AI was supposed to reduce tedious work and free people to focus on more meaningful tasks, but in practice, it has often increased workloads, expectations, and information overload. One response to this problem is ARC (Audio Review Companion), a voice-based tool that reads Google Docs aloud and records spoken feedback as comments, allowing document review while walking or performing other activities. The idea is to use AI not just for productivity gains, but to create more flexible, screen-free ways of working without letting work spill into personal time.
Annotate Anything on Screen, Highlight Cursor, and More (Website)
Presentify provides a lightweight set of macOS utilities for screen annotation, cursor highlighting, and zooming, designed for remote presenters.
Original article
Presentify is a macOS app for annotating your screen, highlighting your cursor, spotlighting important areas, and zooming in for a closer look.
AI Email Marketing Platform (Website)
Brew is an AI-powered email marketing platform that utilizes a visual canvas for constructing complex, branching communication flows.
Original article
Brew is an AI email marketing platform that generates emails in seconds. It features a visual canvas where users can build messages, branches, and conditions in a shared flow.
How Hinge Keeps You Engaged (Not Romantically)
Hinge drives engagement by gamifying uncertainty through features like hidden likes and temporary highlights that play on psychological triggers.
Original article
Dating apps can increase engagement by leveraging psychological principles such as curiosity and scarcity. Features like hidden likes and limited-time profile highlights create a desire to resolve uncertainty, while priority messaging, premium visibility, and “New Here” badges make potential matches feel more valuable and time-sensitive. These mechanisms encourage users to spend more time on the platform and, in many cases, pay for features that promise greater visibility or faster access to potential matches.

This Van Gogh-inspired Laptop Breaks Every PC Design Convention
MSI is attempting to elevate laptop aesthetics with the 'Prestige 14 Flip AI+ Vincent van Gogh Edition,' featuring a chassis designed to mimic the artist's brushwork.
Original article
MSI unveiled the Prestige 14 Flip AI+ Vincent van Gogh Edition laptop at Computex 2026.
Scuderia Ferrari and HP's laptop collab is actually good
HP's collaboration with Scuderia Ferrari attempts to integrate high-end performance hardware with genuine automotive-grade materials and engineering.
Original article
The HP–Ferrari laptop combines high-end workstation performance with Ferrari-inspired materials, engineering, and design details, making it a luxury product that offers more than just branded aesthetics.