How OpenAI's Performance Factory keeps ChatGPT fast
OpenAI has deployed the 'Performance Factory,' an autonomous system using Codex to investigate, diagnose, and fix performance regressions in ChatGPT.
Deep dive
- System Architecture: Composed of a task service, a dispatch loop for agent assignment, a cloud-based execution environment for Codex, and event subscriptions.
- Adversarial Review: OpenAI uses a secondary 'reviewer' agent to challenge diagnoses and proposed fixes, significantly increasing accuracy by catching hallucinations or incomplete investigations.
- Performance Impact: Over three months, the system handled over 1,700 investigations, with 600 root-caused automatically.
- Handoffs: Designed to be human-in-the-loop; agents summarize technical findings into reports and PRs for human review before deployment.
- Self-Repair: The system monitors its own tools, using agents to create tasks to fix broken profilers or permission errors blocking investigation pipelines.
Decoder
- Performance Regression: An unintended degradation in system performance (e.g., increased latency or memory usage) introduced by a code change.
- Codex: OpenAI's foundational model family optimized for code generation, search, and reasoning tasks.
- Adversarial Review: A validation technique where an AI model acts as a critic to attempt to disprove the output of another model to improve reliability.
Original article
How OpenAI’s Performance Factory keeps ChatGPT fast
The staggering pace of agentic development has made traditional approaches to performance engineering unsustainable. To keep up, we built the Performance Factory, an autonomous system that uses the full capabilities of Codex and our models to find and fix regressions at an unprecedented speed. The Performance Factory, which runs in the cloud and automates investigating and resolving performance problems, enables us to keep pace with the ambition of our roadmap.
In the Performance Factory, our engineers define workflows for recurring jobs and write instructions for the Codex agents that carry them out. In particular, the Regression Workflow opens a task when a performance alert fires. An agent investigates the slowdown, records its findings in the task, and proposes a fix for an engineer to review. After deployment, another agent picks up the same task to check whether performance has returned to baseline. From investigating to authoring the fix to verifying mitigation, this first workflow in the Performance Factory has automated the entire process of fixing regressions. In just over three months, the Regression Workflow tracked more than 1,700 investigations and root caused over 600 cases. That’s 17 automated investigations every day.
Here, we’ll share how our use of Codex evolved into what’s now the Performance Factory, walk through our first running workflow, and share early lessons from building and running agent workflows in production.
The path from manual investigations to automated workflows
As we used Codex for more of our performance work, we noticed a progression in how our team worked. We hope other service teams can learn from our process as they adopt agentic workflows in other domains.
1. Pre-Codex. Before Codex, engineers manually examined metrics and logs, compared traces, debugged live machines, and read code to investigate a slowdown. This work was time consuming, and knowing where to look often required deep knowledge of the service. Relevant signals were easy to miss. When we encountered the same kinds of problems repeatedly—like regressions in ChatGPT’s first token latency—we built advanced tools, like CPU and allocation profilers, to make those investigations easier. Over time, we accumulated more than 30 performance tools.
2. Codex as a partner. Once we had Codex as a partner, engineers could ask, “Why did this get slower?” and work with Codex to investigate, even in an unfamiliar system. Codex could search large codebases, find relevant metrics and traces, follow interactions across services, and do appropriate profiling to piece together what had happened. But engineers still had to steer the process, knowing which performance tools to use and how to guide the investigation. Difficult investigations were more debuggable for more people, with less expertise and time required.
3. Reusable skills. To automate further, we captured our performance team’s investigation process in a shared skill called perf-forensics. It tells Codex which tools are available, when to use them, and how to work through a slowdown so Codex can try to resolve the problem from a few angles:
- Find when the slowdown began
- Identify the affected requests
- Investigate whether deployments or configuration changes could explain it
We tested and refined the perf-forensics skill using evals based on past regressions. For the types of regressions we focused on (for example, ChatGPT latency and availability drops), we could now give Codex an alert and get back a diagnosis in a single run, without guiding it through each step.
4. The human proxy. As we added and refined perf-related Codex skills like perf-forensics, we started to feel like a proxy between our alerts and Codex. An alert would fire, and an engineer would simply copy and paste it into Codex with the right skill, then paste the findings back into Slack.
5. Automated investigations. Next, we moved investigations to the cloud so an alert could start a Codex session automatically. Codex investigated the slowdown and posted its findings in the Slack thread, but the automation ended with that reply. An engineer still had to pick up the diagnosis, develop a fix, and check whether it worked after deployment. As alerts accumulated, even figuring out which regressions needed attention meant sifting through Slack threads.
6. The factory. We built the Performance Factory to run end-to-end agentic performance engineering workflows. It tracks what each active task needs next and assigns an agent when that step is ready. Each task keeps its state and findings, so work can pass between agents and engineers and resume after a code review or deployment. For a regression, the work starts with investigating an alert and ends with verifying recovery in production. We can turn common optimizations into workflows that run regularly across our services. A workflow that spots a potential optimization can open a task in another workflow to test and implement it.
The Performance Factory system’s four parts
The Performance Factory is made up of four components: a task tracker with configurable workflows, a dispatch loop that assigns ready work to agents, an API that runs Codex in the cloud, and subscriptions that wake agents when something changes (such as a GitHub review comment posting or a deployment completing).
Task service with configurable workflows
The task service is where engineers define workflows by adding configuration files and prompts for the agents to follow, written in Markdown. The configuration lists the states a task can move through, the allowed transitions, and which steps need an engineer. Separate prompts tell agents what to do at each step.
1code-change/
2├── config.toml
3└── work/
4    ├── implementing.md
5    └── reviewing.md
Each piece of work becomes a task in a workflow, and all workflows are visible in a UI. Engineers can see what’s open, follow progress, and share a task with a teammate who might have more context or be able to help with the next step.
Dispatch loop that assigns work
A dispatch loop periodically checks which tasks are ready for the next step. It assigns an agent to each task by starting a Codex turn with the instructions for the task’s current state. The agent records its progress on the task and moves it to the next state if it completes the step.
Codex in the cloud
Once a task is assigned, the agent needs a place to do the work, with access to the same tools an engineer would use. We built an internal API to programmatically invoke a Codex turn in the cloud. The Codex turn runs on an environment inside our network, with access to our code repositories and the observability tools our engineers use, such as metrics, logs, traces, CPU profiles, and memory snapshots.
The agent runs under a service identity, so we can scope its permissions and see which actions came from our performance agents. Moving agentic work to the cloud lets us run work in parallel without relying on engineers’ laptops being open or manually managing individual cloud development boxes.
Subscriptions that wake the agent when something changes
Some work has to wait for a person or a deployment; an agent shouldn’t have to keep running in the meantime. When a task needs to wait, it can subscribe to events like review comments or failed CI checks on a GitHub pull request to get notified when it’s time to pick the work back up. When an incoming event matches the subscription, the task becomes ready again and the dispatch loop can then assign an agent to continue the work.
The first workflow: from alert to recovery
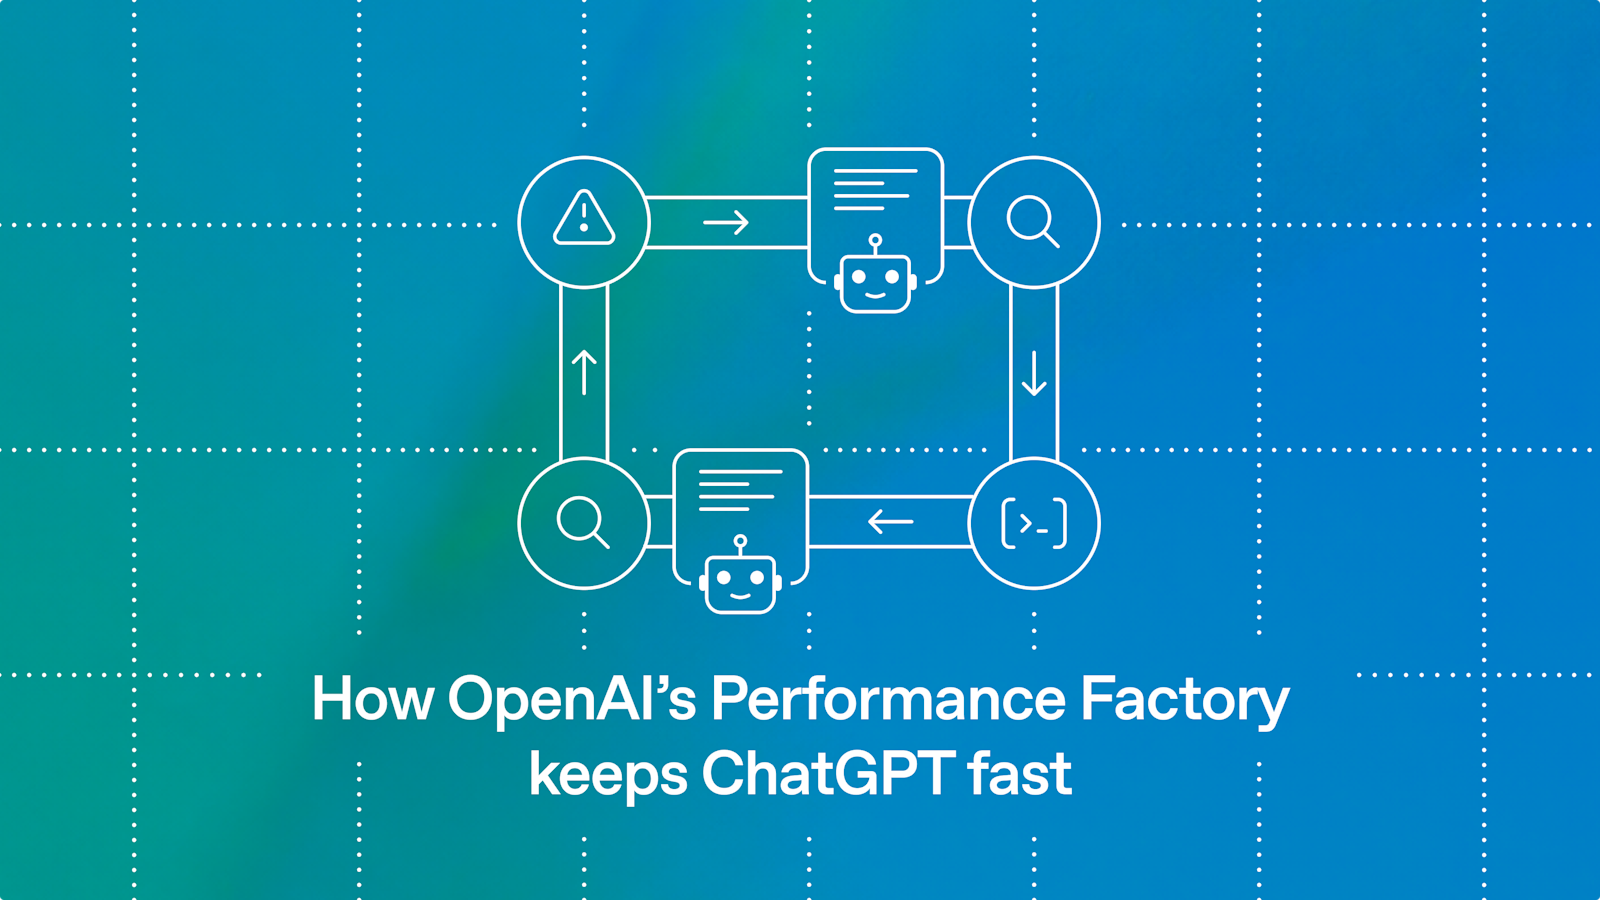
Finding, root causing, and solving regressions is the first workflow we built inside the Performance Factory. We call it the Regression Workflow. A performance regression moves through several stages: needs investigation, root caused, fix proposed, and resolved, so we built the automated workflow to reflect and move a task through those same stages.
When one of its configured performance alerts fires, the Regression Workflow opens a task that agents pick up and move across these stages. The task records its status and key findings outside of any one agent’s context so that other agents or engineers can pick up the work. Engineers can follow the work in Slack or the Regression Workflow UI, add context, and review proposed changes. After a fix is deployed, an agent checks whether the performance has recovered to its original state before resolving the task.
Agents find the root cause
Finding the root cause (or causes) is the first major step in the workflow. The agent starts by figuring out which metrics got worse, when they started to change, and which service requests were affected. The perf-forensics skill gives Codex access to the tools our performance engineers use and a playbook for working through those questions.
Adversarial review strengthens the diagnosis
Early on, agents sometimes stopped at the first plausible explanation they found, and some of those diagnoses turned out to be wrong. To catch these mistakes, we added an adversarial review: a separate Codex session that tries to disprove the proposed diagnosis. The reviewer rechecks the assumptions and tests counterfactuals. If a rollout caused the slowdown, did similar requests that weren’t exposed stay healthy? If the suspected change was rolled back, did the affected metric recover?
Fixing the regression is the hard part
Once the diagnosis passes adversarial review, the workflow asks Codex to implement a fix and open a pull request. An engineer reviews the PR and decides whether to merge it. We’ve put a significant amount of work into making this handoff as easy as possible. Each task has a report with an automatically generated summary of the regression, its impact, the root cause, and the proposed fix.
After an engineer deploys the fix, the workflow wakes an agent to check whether performance has returned to its earlier baseline. If it has, the agent marks the task as resolved. If performance has only partially recovered, the agent resolves the original regression and opens a new task for the remaining slowdown, which may have a different cause.
What we learned
Protect engineers’ attention
The raw output from a Codex investigation can be a wall of text that’s hard to parse. It takes effort to figure out what the agent is claiming and track down the graphs to see whether the data backs it up. We want engineers to spend their attention on decisions rather than reconstructing the agent’s work.
Evaluate changes to your agents
Updating an investigation skill or upgrading the model can make the agent better at diagnosing some cases and worse at others, so we need to test their impact before updating them.
Turn recurring failures into self-repair
Lastly, our agents need monitoring just as much as the services they investigate. A broken profiler or a missing permission can keep an agent from verifying what caused a slowdown. Those failures can be hard to spot in the final report, so we run an agent every day to look through messages and logs from recent runs for tool failures and access errors.
What’s next: broader applications, proactive monitoring
The Regression Workflow is just one instance of the agent factory pattern that moves tasks through explicit states. Agents advance the task when more work is ready; separate reviewers challenge the conclusions; engineers step in when the next decision requires judgment.
Currently, our Regression Workflow starts when an alert fires. However, we’re working on more proactive ways for the Performance Factory to find slowdowns and optimizations even when no alert fires. We want agents to use the large amount of fine-grained performance data we already collect to spot regressions our alerts miss or discover optimizations.
Next time you’re using ChatGPT and notice a slowdown, there’s a good chance the Performance Factory is already figuring out why. Today, the bottleneck may be waiting for an engineer to review and merge the fix. We’re already exploring whether agents can do this themselves. As product development keeps accelerating with Codex, performance systems need to become increasingly autonomous and self-improving to keep up. Codex already helps us build ChatGPT faster. Now it’s helping us keep ChatGPT fast.
Fresh dev news, AI-digested daily. Never miss a trend at devoured.fyi